

Statistical models in practice
Revealing the hidden concentration risk in US Equities
On February 22, the US market rallied sharply, driven by Nvidia’s enormous upside earnings surprise.
This sparked a resurgence of the conversation around extreme concentration in the US stock market. We have often been asked whether or how this concentration risk might be explained by our factor models. While it can be difficult to “see” this risk in fundamental factor models, we have shown that the statistical variants of the Axioma models often pick up on transitory systematic risk that can remain hidden to fundamental models. This latest surge in the enormous, expensive technology-related stocks dominating the US stock indices has prompted us to take another look at how the statistical models can be used in conjunction with the fundamental models to understand the risk of concentration in US equity indices.
We continually monitor the spread in index risk forecasts between each of the four risk model variants (Fundamental / Statistical Short Horizon and Fundamental / Statistical Medium Horizon) in each geographic region. Throughout 2024 year to date*, we have seen wide spreads between the statistical and fundamental variants in both the short and medium horizon forecasts for the United States market. While the spread has narrowed from the beginning of the year, it is still significantly wide at 112 bps.
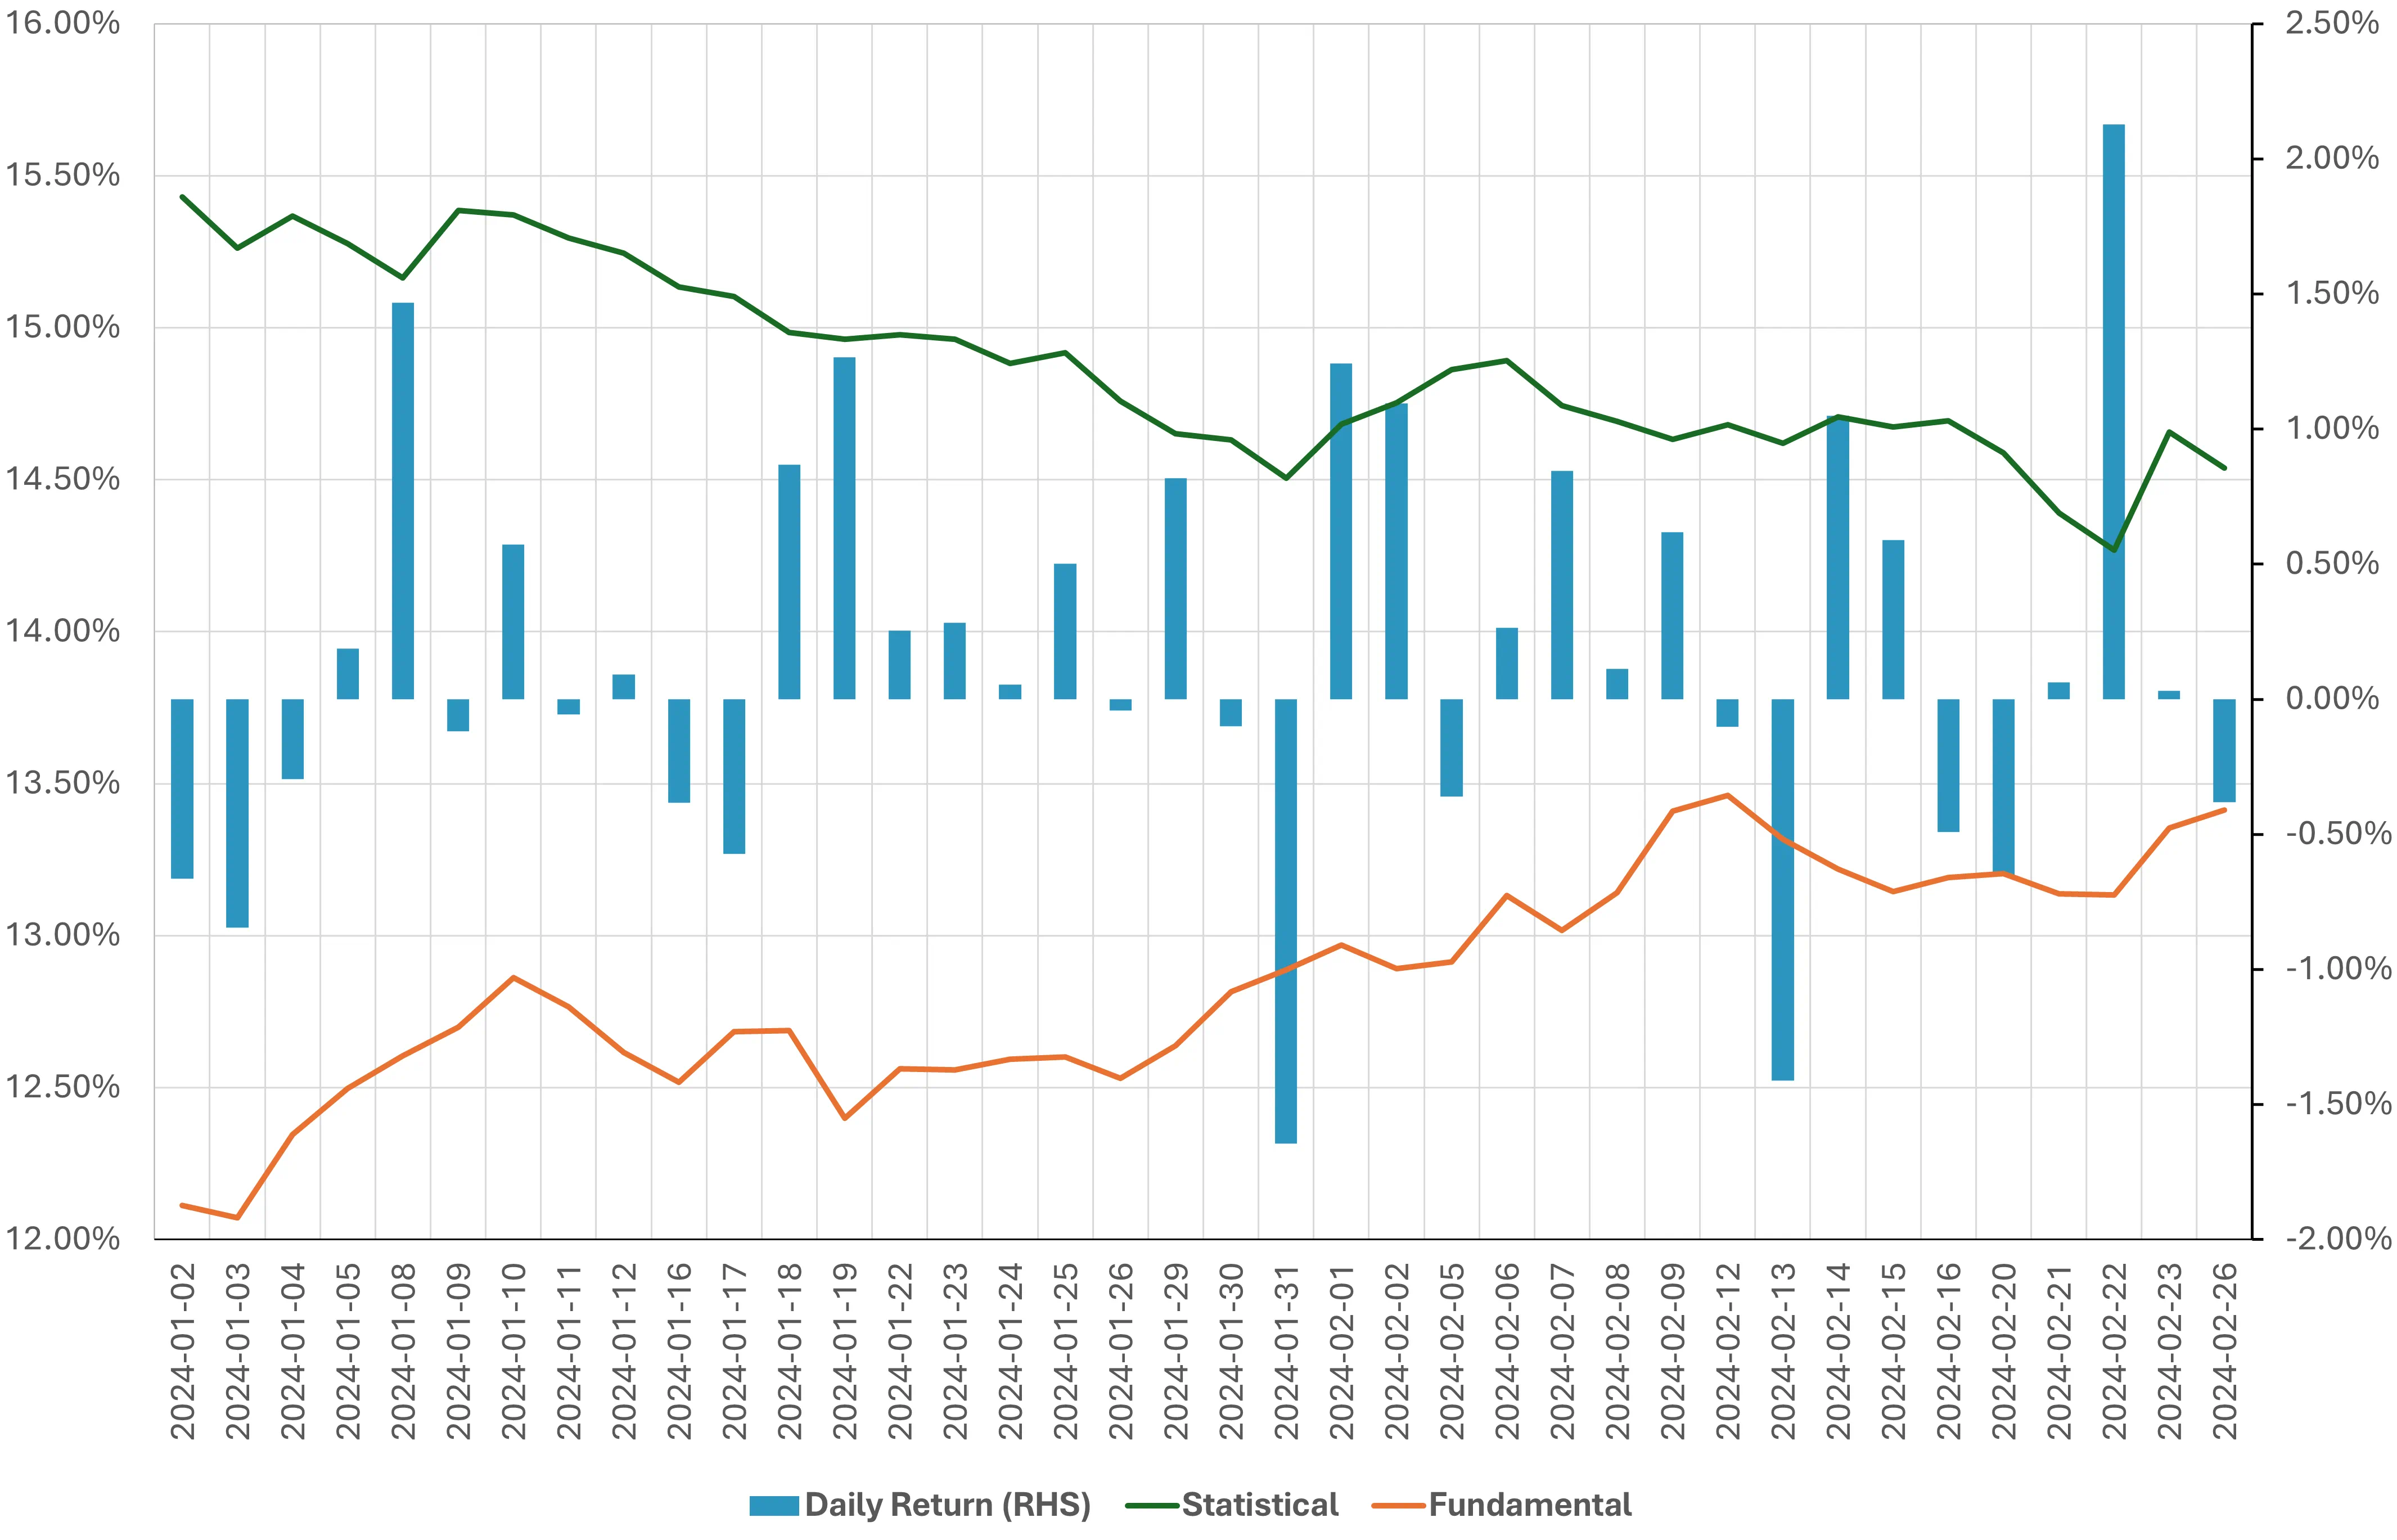
Figure 1: Short Horizon Risk Forecasts
Source: STOXX World US Index, Axioma Equity Factor Risk Model (US5.1)
Measuring concentration
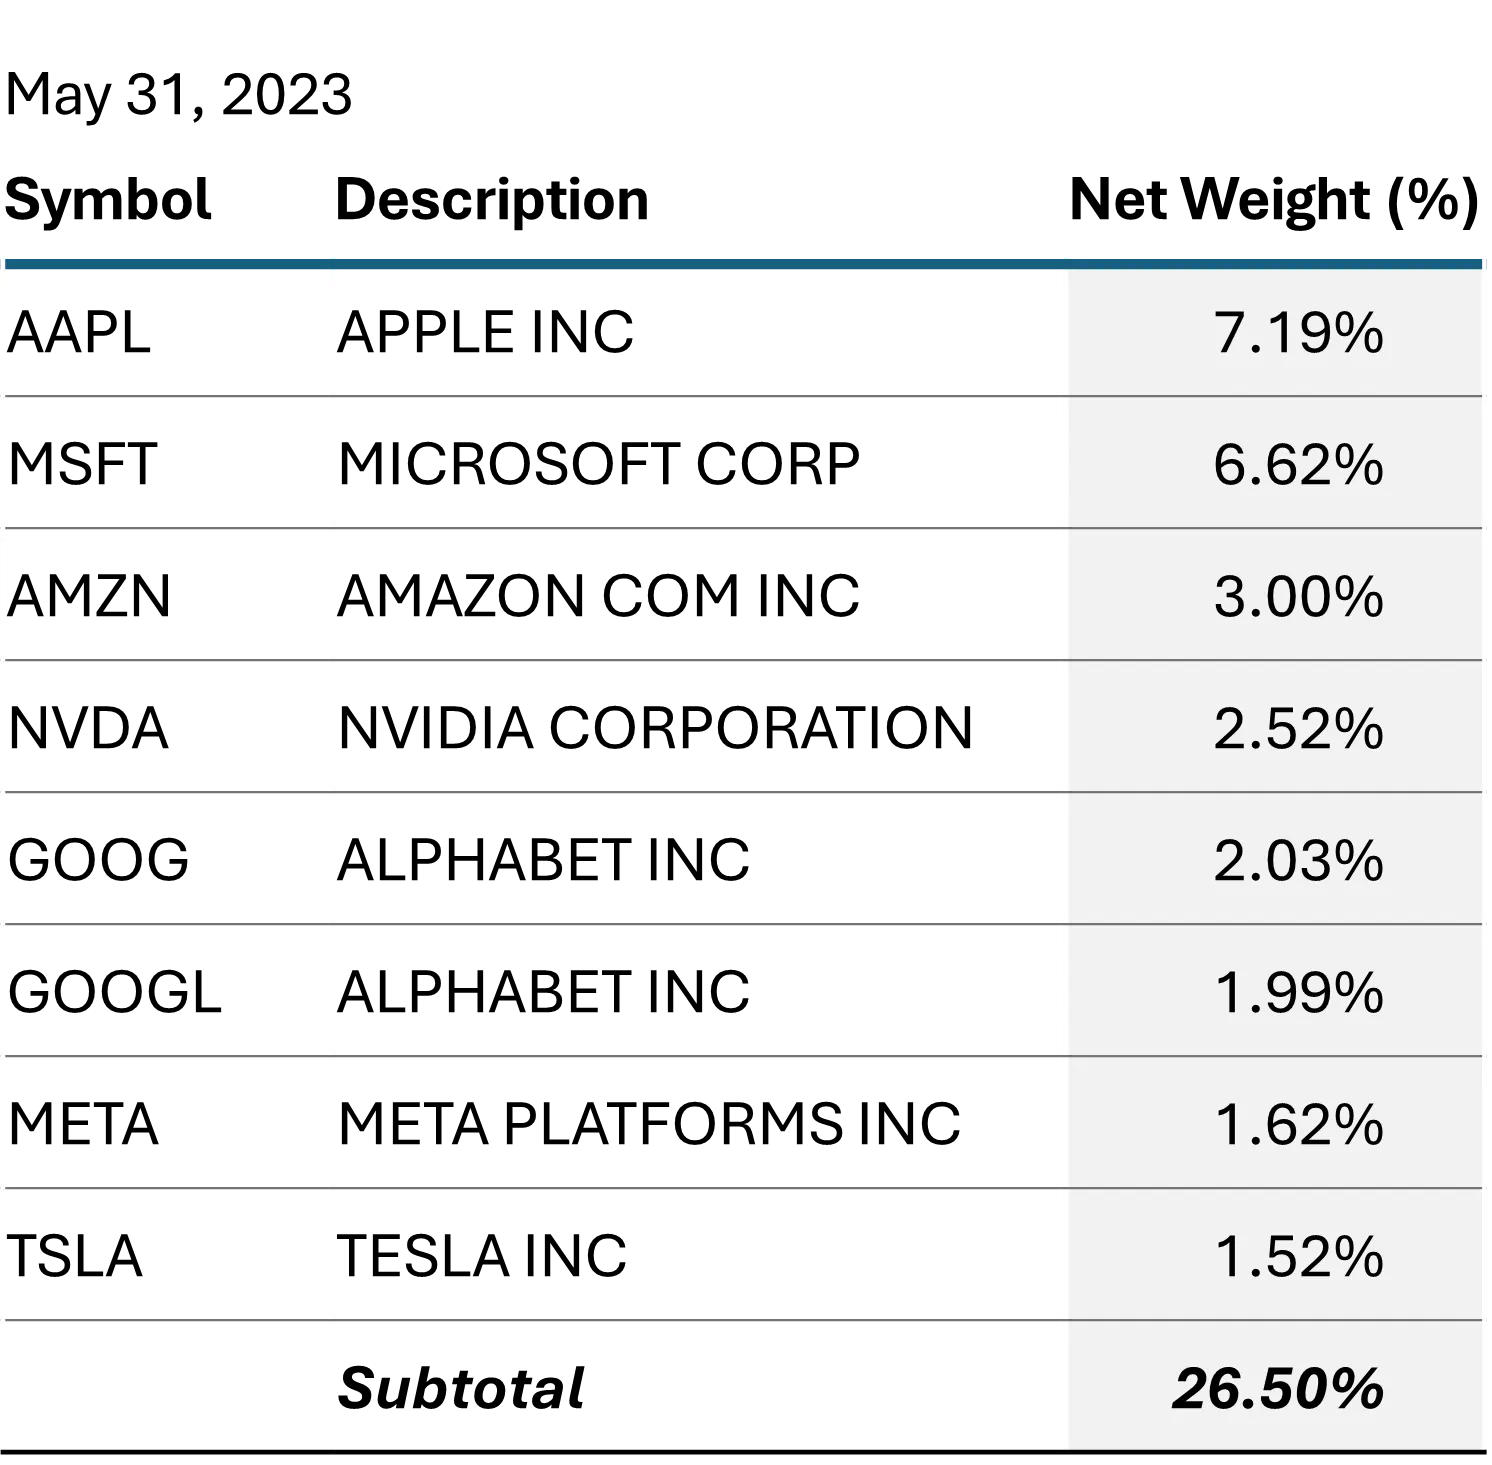
An “effective number of companies”, measured by the inverse Herfindahl Index, is a tool for measuring the degree of concentration in a portfolio or index. A predominantly large cap US index such as the STOXX® World US averages around 600 total constituents, but at any given point in time, the concentration in the largest names may effectively reduce the diversification available in that index. By computing the inverse Herfindahl Index of a portfolio (1 divided by the sum of the squared weights), we can gauge how much that diversification potential is reduced. In May of 2023, when the memetic “Magnificent 7” narrative first took hold, the STOXX® World US had reached a new all-time low in its effective number of names – just 66. As of February 23, 2024, the effective number was down to 64. Below are the top 7 Issuers in the index last May and as of February 23, 2024, respectively.
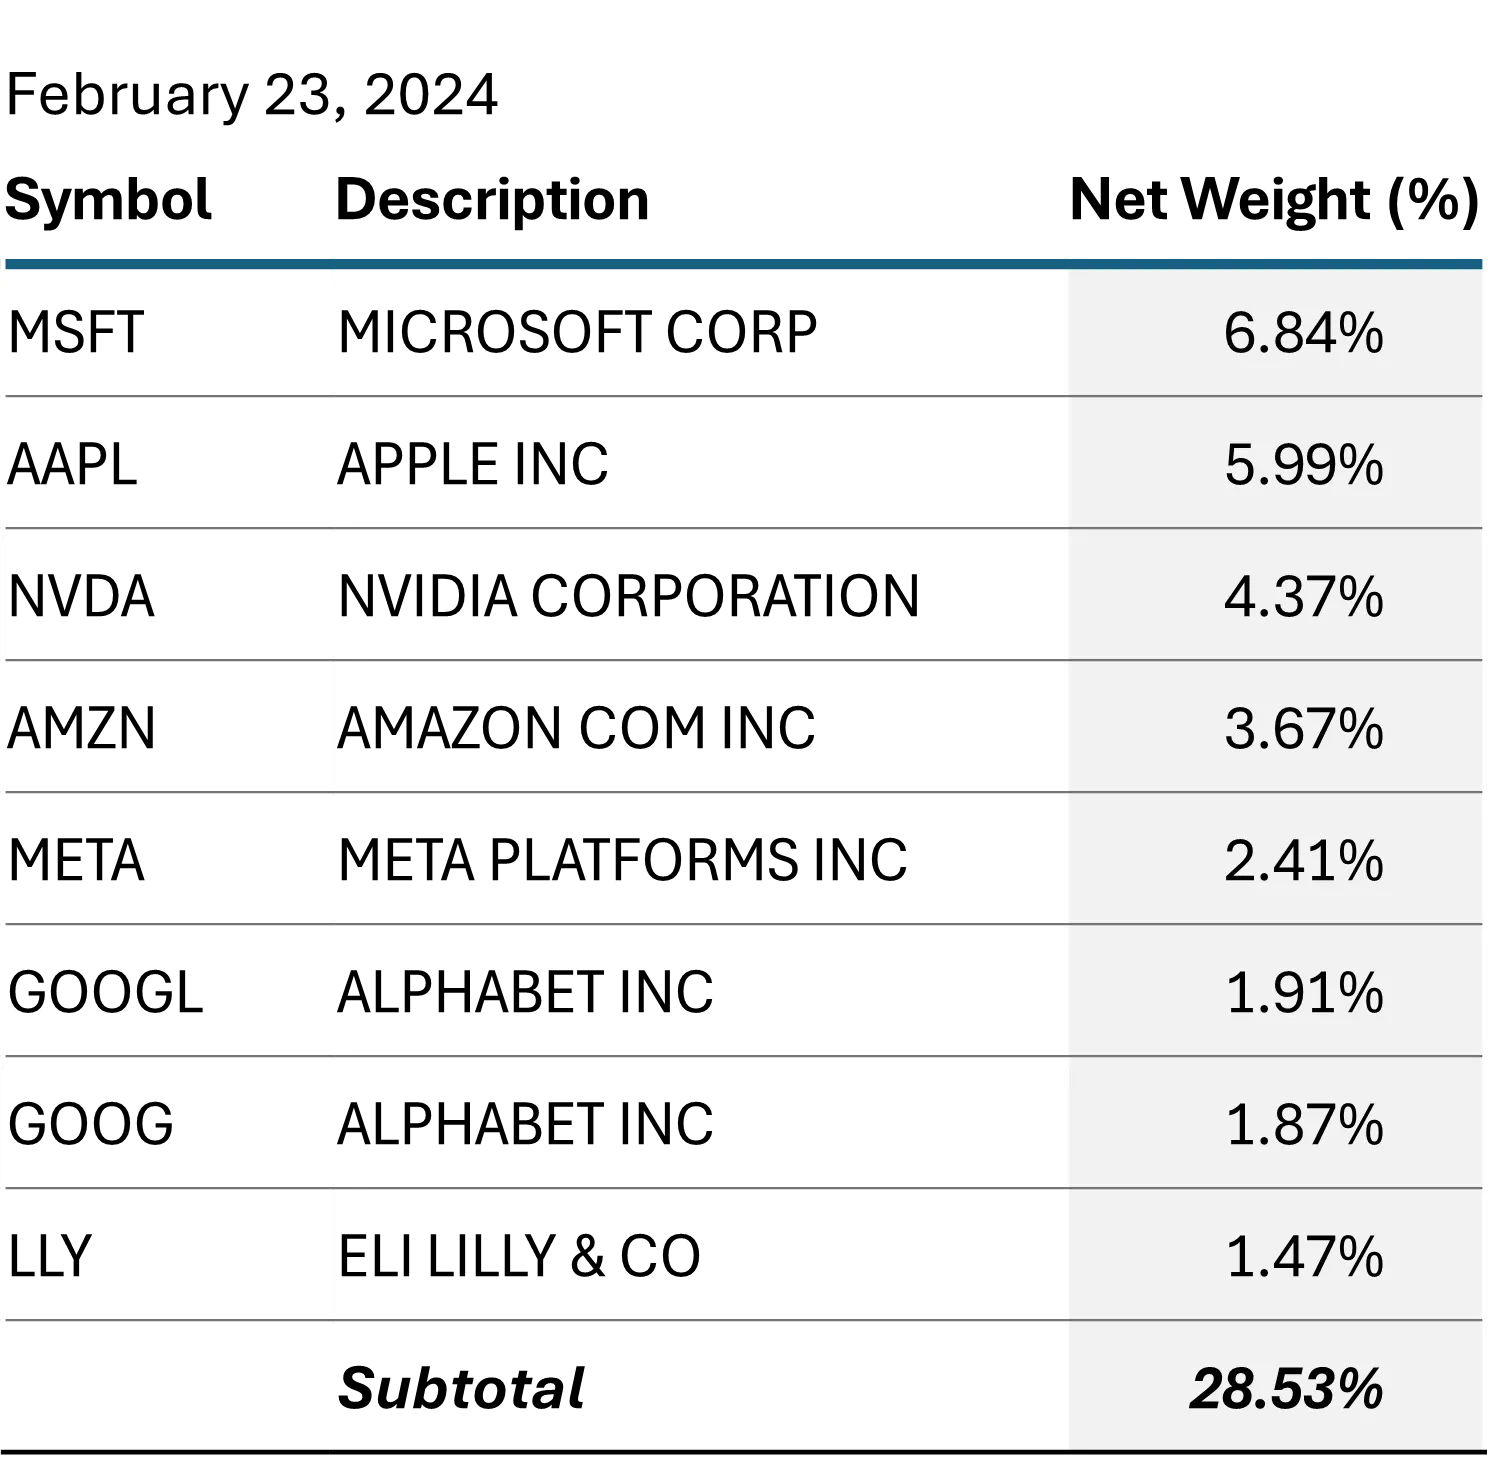
Figure 2: Top 7 Issuers in the STOXX® World US Index
Source: STOXX® World US IndexThe concentration at the top has become more extreme, even if it is spread a bit more evenly over the top 7 issuers (maybe Tesla is just a car company after all). The addition of nearly a second trillion to Nvidia’s market value in the last eight months is certainly unprecedented, and its weight has nearly doubled. Intuitively, it seems that this concentration should be a risk factor unto itself, yet the fundamental model’s risk decomposition does not reveal this to be the case.
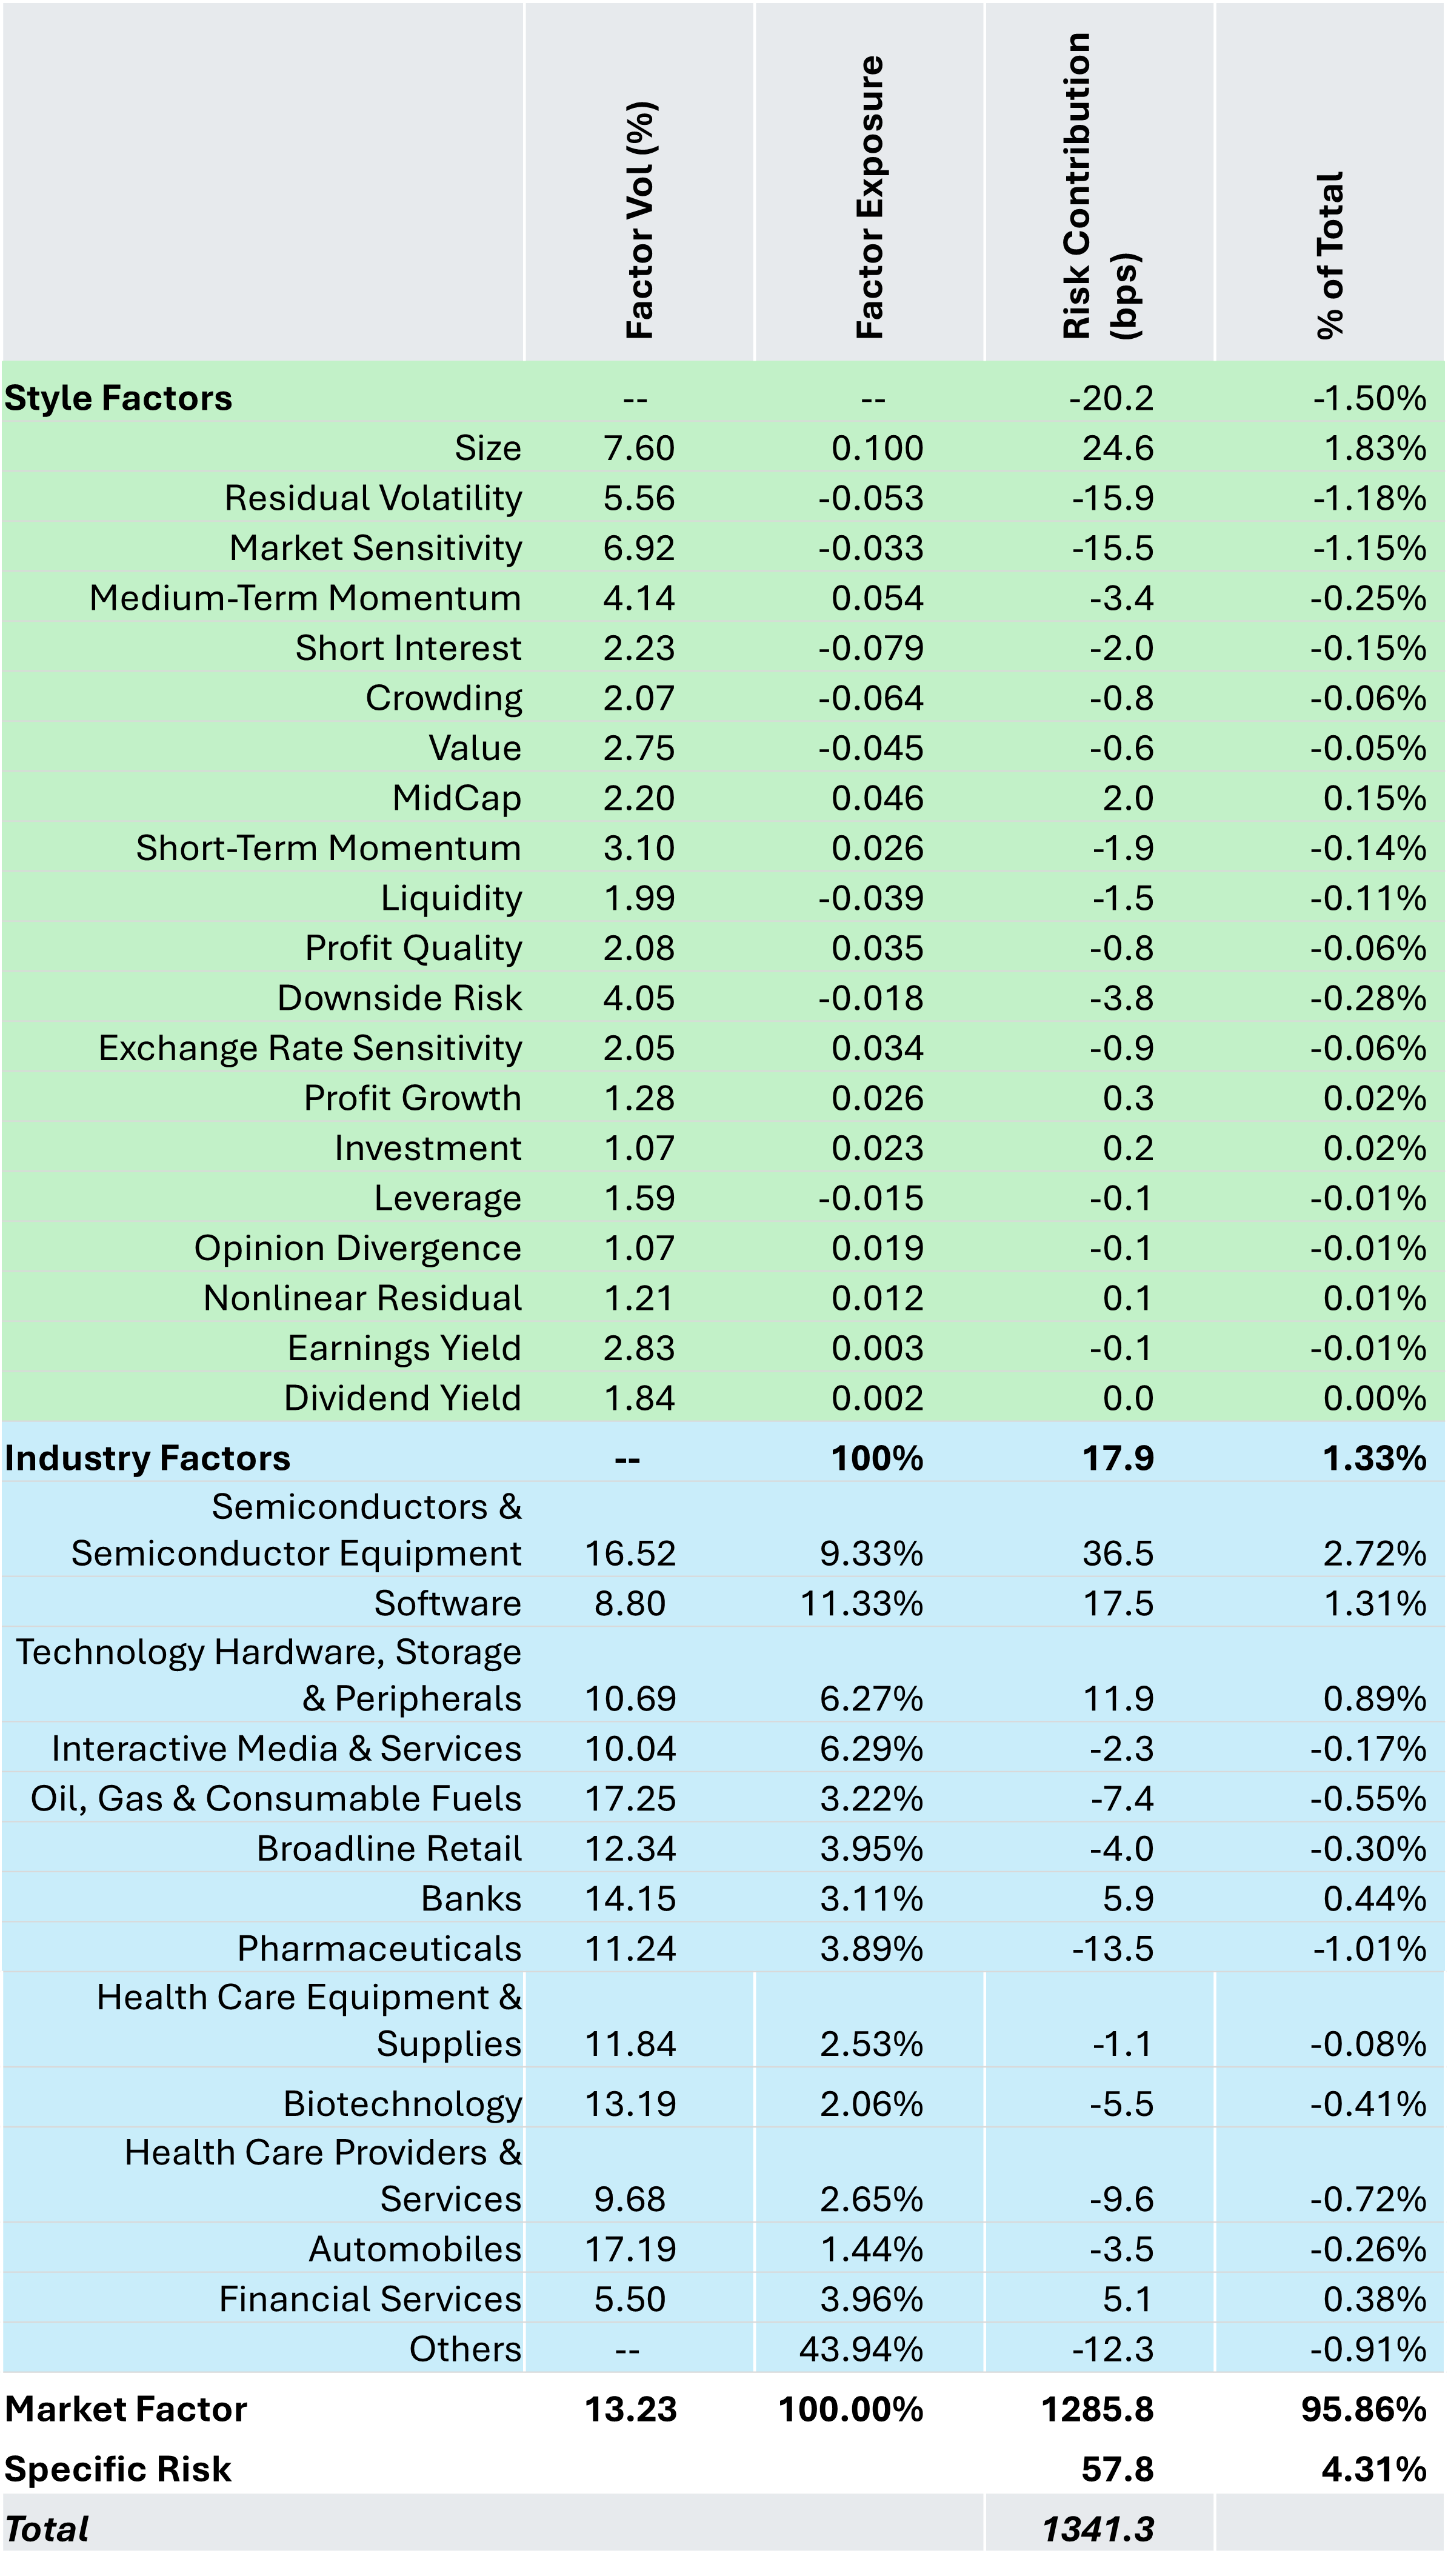
Figure 3: US Risk Decomposition – Fundamental Model
Source: STOXX® World US Index, Axioma Equity Factor Risk Model (US5.1)
What is the fundamental model telling us?
The US 5.1 Model includes “Sentiment” factors that capture institutional popularity, such as Hedge Fund Crowding and Short Interest. At the index level however, there is not much net exposure to either of these factors as typically, broad market indices are factor neutral. The exception in this case is the Size factor, because this is a large-cap index. However, the risk attributable to the positive exposure to Size coming from the biggest of the big names is more than offset by negative exposures to the “Carry” factors, such as Market Sensitivity, Residual Volatility, and Downside Risk. The style factors as a group actually provide diversification from the market factor and the concentration is in the biggest industry allocations, such as Semiconductors, Software, Technology Hardware, and Interactive Media. In aggregate, the Style and Industry factors have a slightly diversifying effect of only -2.3 basis points.
The story here is the Market Intercept factor. While the STOXX® World US Index is generally large cap, it is similar enough to the broadest definition of the US market so that the other factors do not provide much differentiation. When we run a similar analysis using the statistical model, we see that first of all, the overall risk forecast is higher, and all the additional forecast risk is systematic in nature, not idiosyncratic.
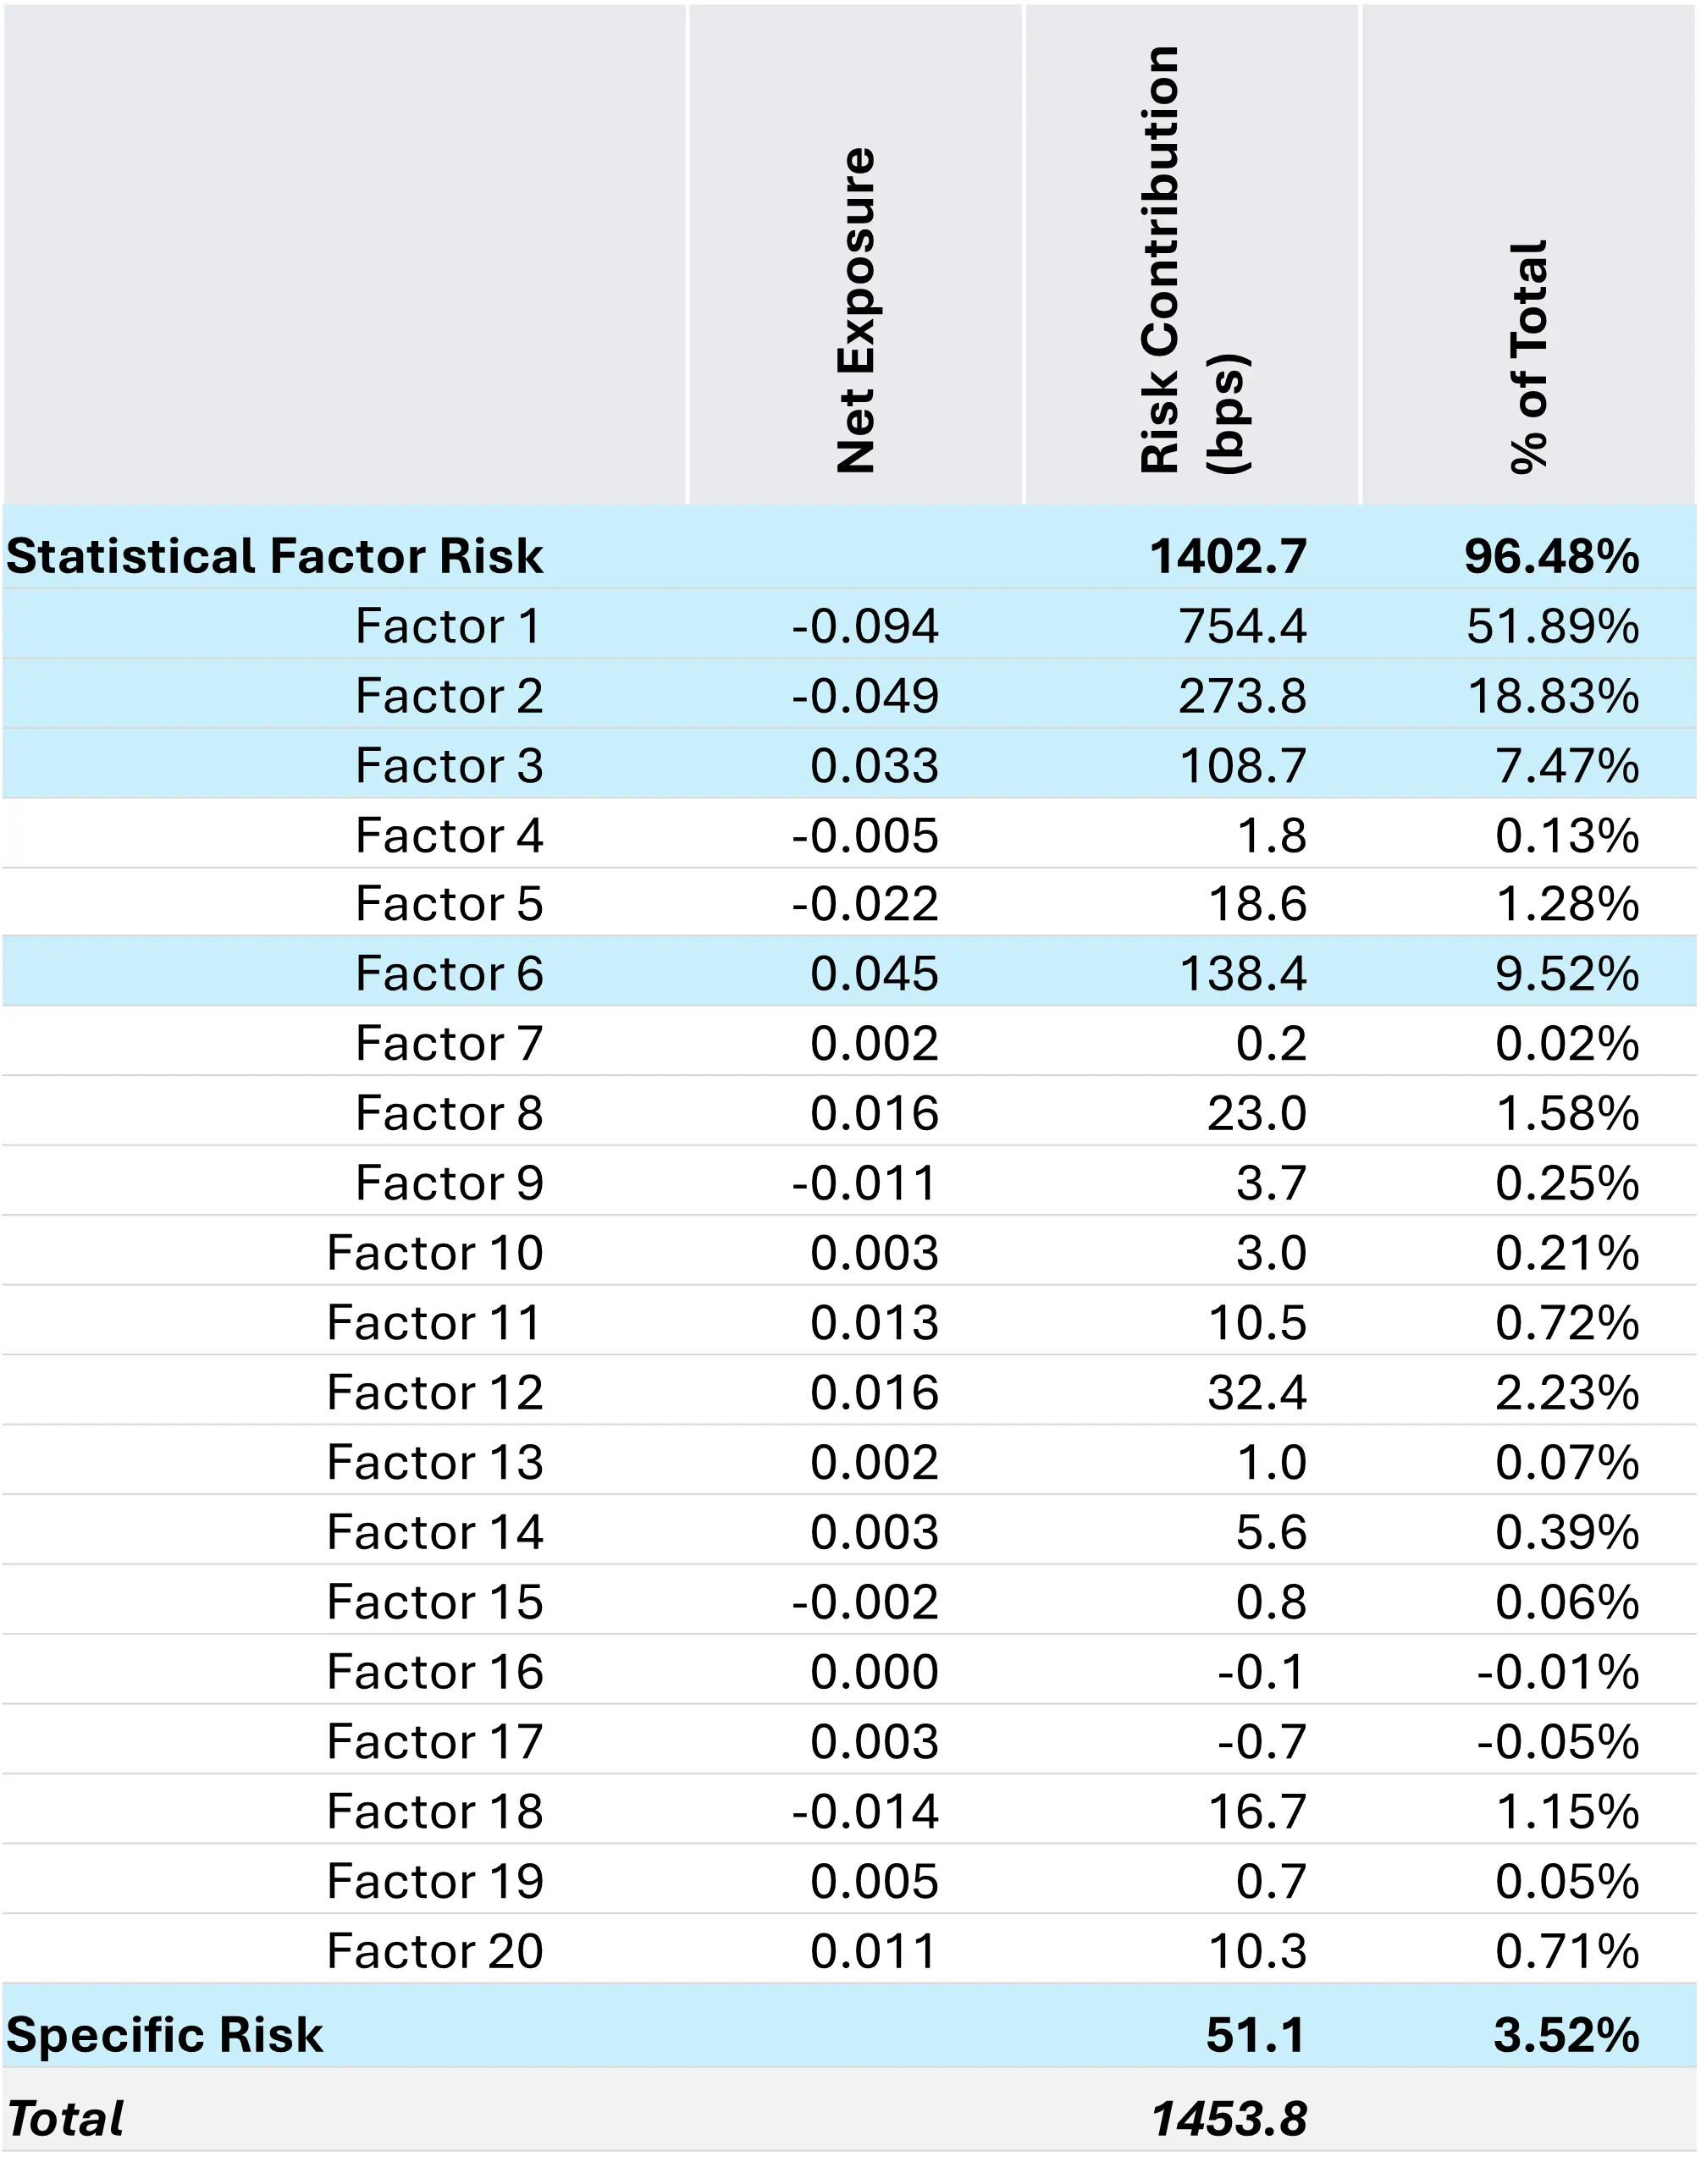
Figure 4: US Risk Decomposition – Statistical Model
Source: STOXX® World US Index, Axioma Equity Factor Risk Model (US5.1)
Comparing the total risk in Figure 3 with Figure 4, the statistical model yields a risk forecast that is 112.5 basis points higher. The total factor risk contribution is 119 basis points higher, while the specific risk contribution is 7 basis points lower. 119 additional basis points of systematic risk is not trivial. The challenge is interpreting where it is coming from.
How factors are derived in the statistical model
These statistical factors are estimated via Principal Components Analysis (PCA) and there are no a priori assumptions about what the factors are or should be. In most cases, the first principal component, or factor, explains the vast majority of the commonality in returns. Most practitioners agree that it represents the broad market. When compared with the Market Intercept factor in the fundamental model, the first principal component appears to explain about half the risk of that clearly defined factor. The difference is in the factor loadings. In the fundamental model, the market factor is indeed the intercept term. All assets in the model have a unit exposure (loading of 1) to this factor (representing perfect linear sensitivity). When the factor return is estimated in the weighted cross-sectional regression each day, we are guaranteed to get the weighted average return of the model estimation universe as the regression coefficient (the factor return). In other words, this factor return is what we would expect the estimation universe return to be if all the other factor returns were zero. That is not the case with the first principal component in the statistical model. The PCA process simultaneously estimates the factor returns and the asset loadings on the factor. The loadings (factor exposures) can be almost any value and are certainly not determined to be 1. The result is a market-like factor that explains most of the dispersion in returns, but clearly not all of it.
It is some of the other statistical factors with significant risk contributions that are of the most interest, particularly Factors 2,3, and 6 since they contribute 18.8%, 7.5%, and 9.5% of the total risk, respectively. What could they be, and how might we discover something about them?
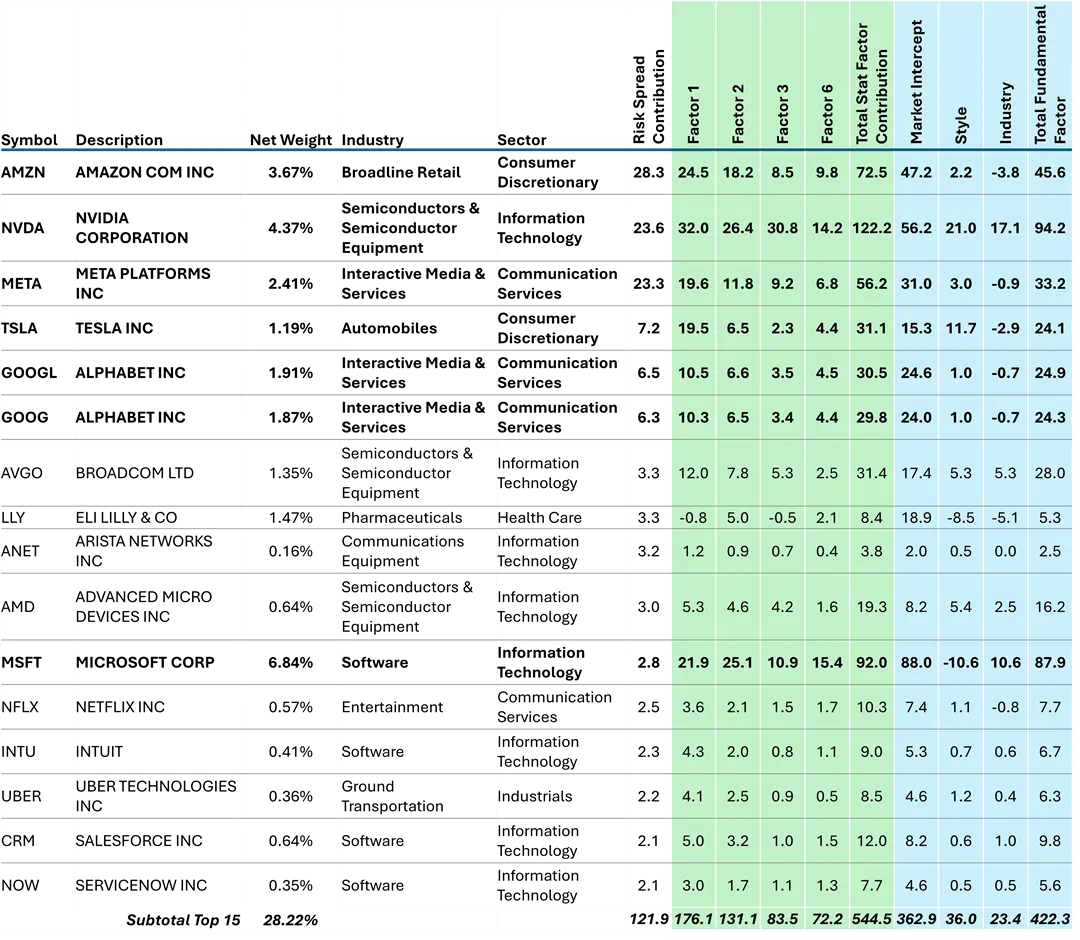
Figure 5: Top 15 contributors to Statistical-Fundamental Risk Spread Risk contributions in basis points per annum. | Source: STOXX® World US Index, Axioma Equity Factor Risk Model (US5.1)
The risk contributions in Figure 5 are the product of the stock’s weight and the marginal contribution to risk of the factor. These contributions, over all of the factors in each model, sum back to the total factor risk forecast from that model. Of the “Magnificent 7” (shown in bold in Figure 5), only Apple Inc. is conspicuously absent from this list of the top contributors to the risk spread. Apple is actually the single stock with the largest negative contribution to the risk spread, meaning the fundamental model shows it to have a larger risk contribution than the statistical model as seen in Figure 6.
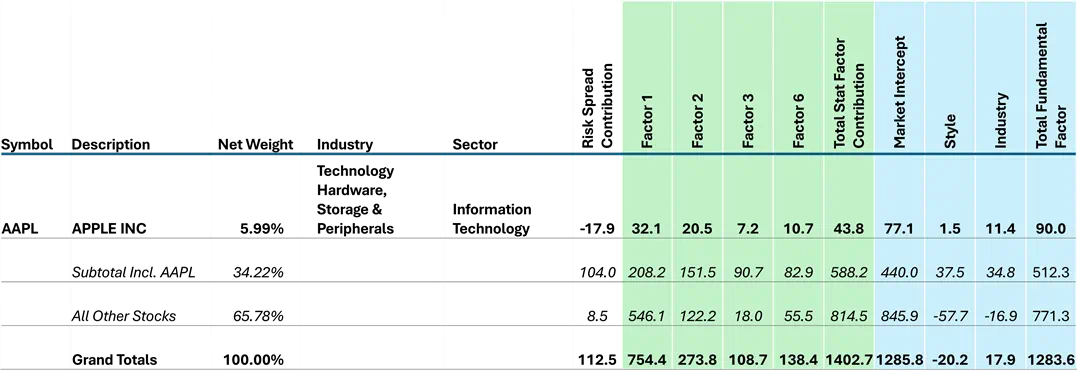
Source: STOXX® World US Index, Axioma Equity Factor Risk Model (US5.1)
The top 15 contributors account for 108% of the total risk spread, and 103% of the factor risk spread. The other 579 names combined account for only 8.5 basis points of the total risk spread, and 43 basis points, or 36% of the factor risk spread. Apple contributes -16% and -39%, respectively, to the total and factor risk spreads. Apple is interesting in that it has significant risk contributions from the key statistical factors, but its contribution from the 16 other statistical factors is just 5 basis points.
In aggregate, the risk contribution from the four key statistical factors over the top 15 is 463 basis points. When we include Apple it increases to 533 basis points. When we add the contributions from the other 16 statistical factors over the top 15 to Apple, we get 588 basis points of factor risk. By comparison, the fundamental factors explain 512 basis points of factor risk for a factor risk spread of 76 basis points from just those 16 names, which is 64% of the total. The top 15 combined with Apple also account for 104 basis points, or 92.5% of the total risk spread.
The bulk of the spreads, in both total and factor space is attributable to Amazon, NVIDIA, and Meta. After those top 3, the spread contributions drop off quite a bit. All of the “Magnificent 7” have large risk contributions from the key statistical factors, but these three have the largest. In particular, the contributions from “all other stocks” to Factors 3 & 6 is just a fraction of the total.
So, what are these factors? It’s impossible to know exactly, but one thing we can do is to analyze the cross-sectional correlation of the factor loadings between the fundamental and statistical model and see where those loadings line up.
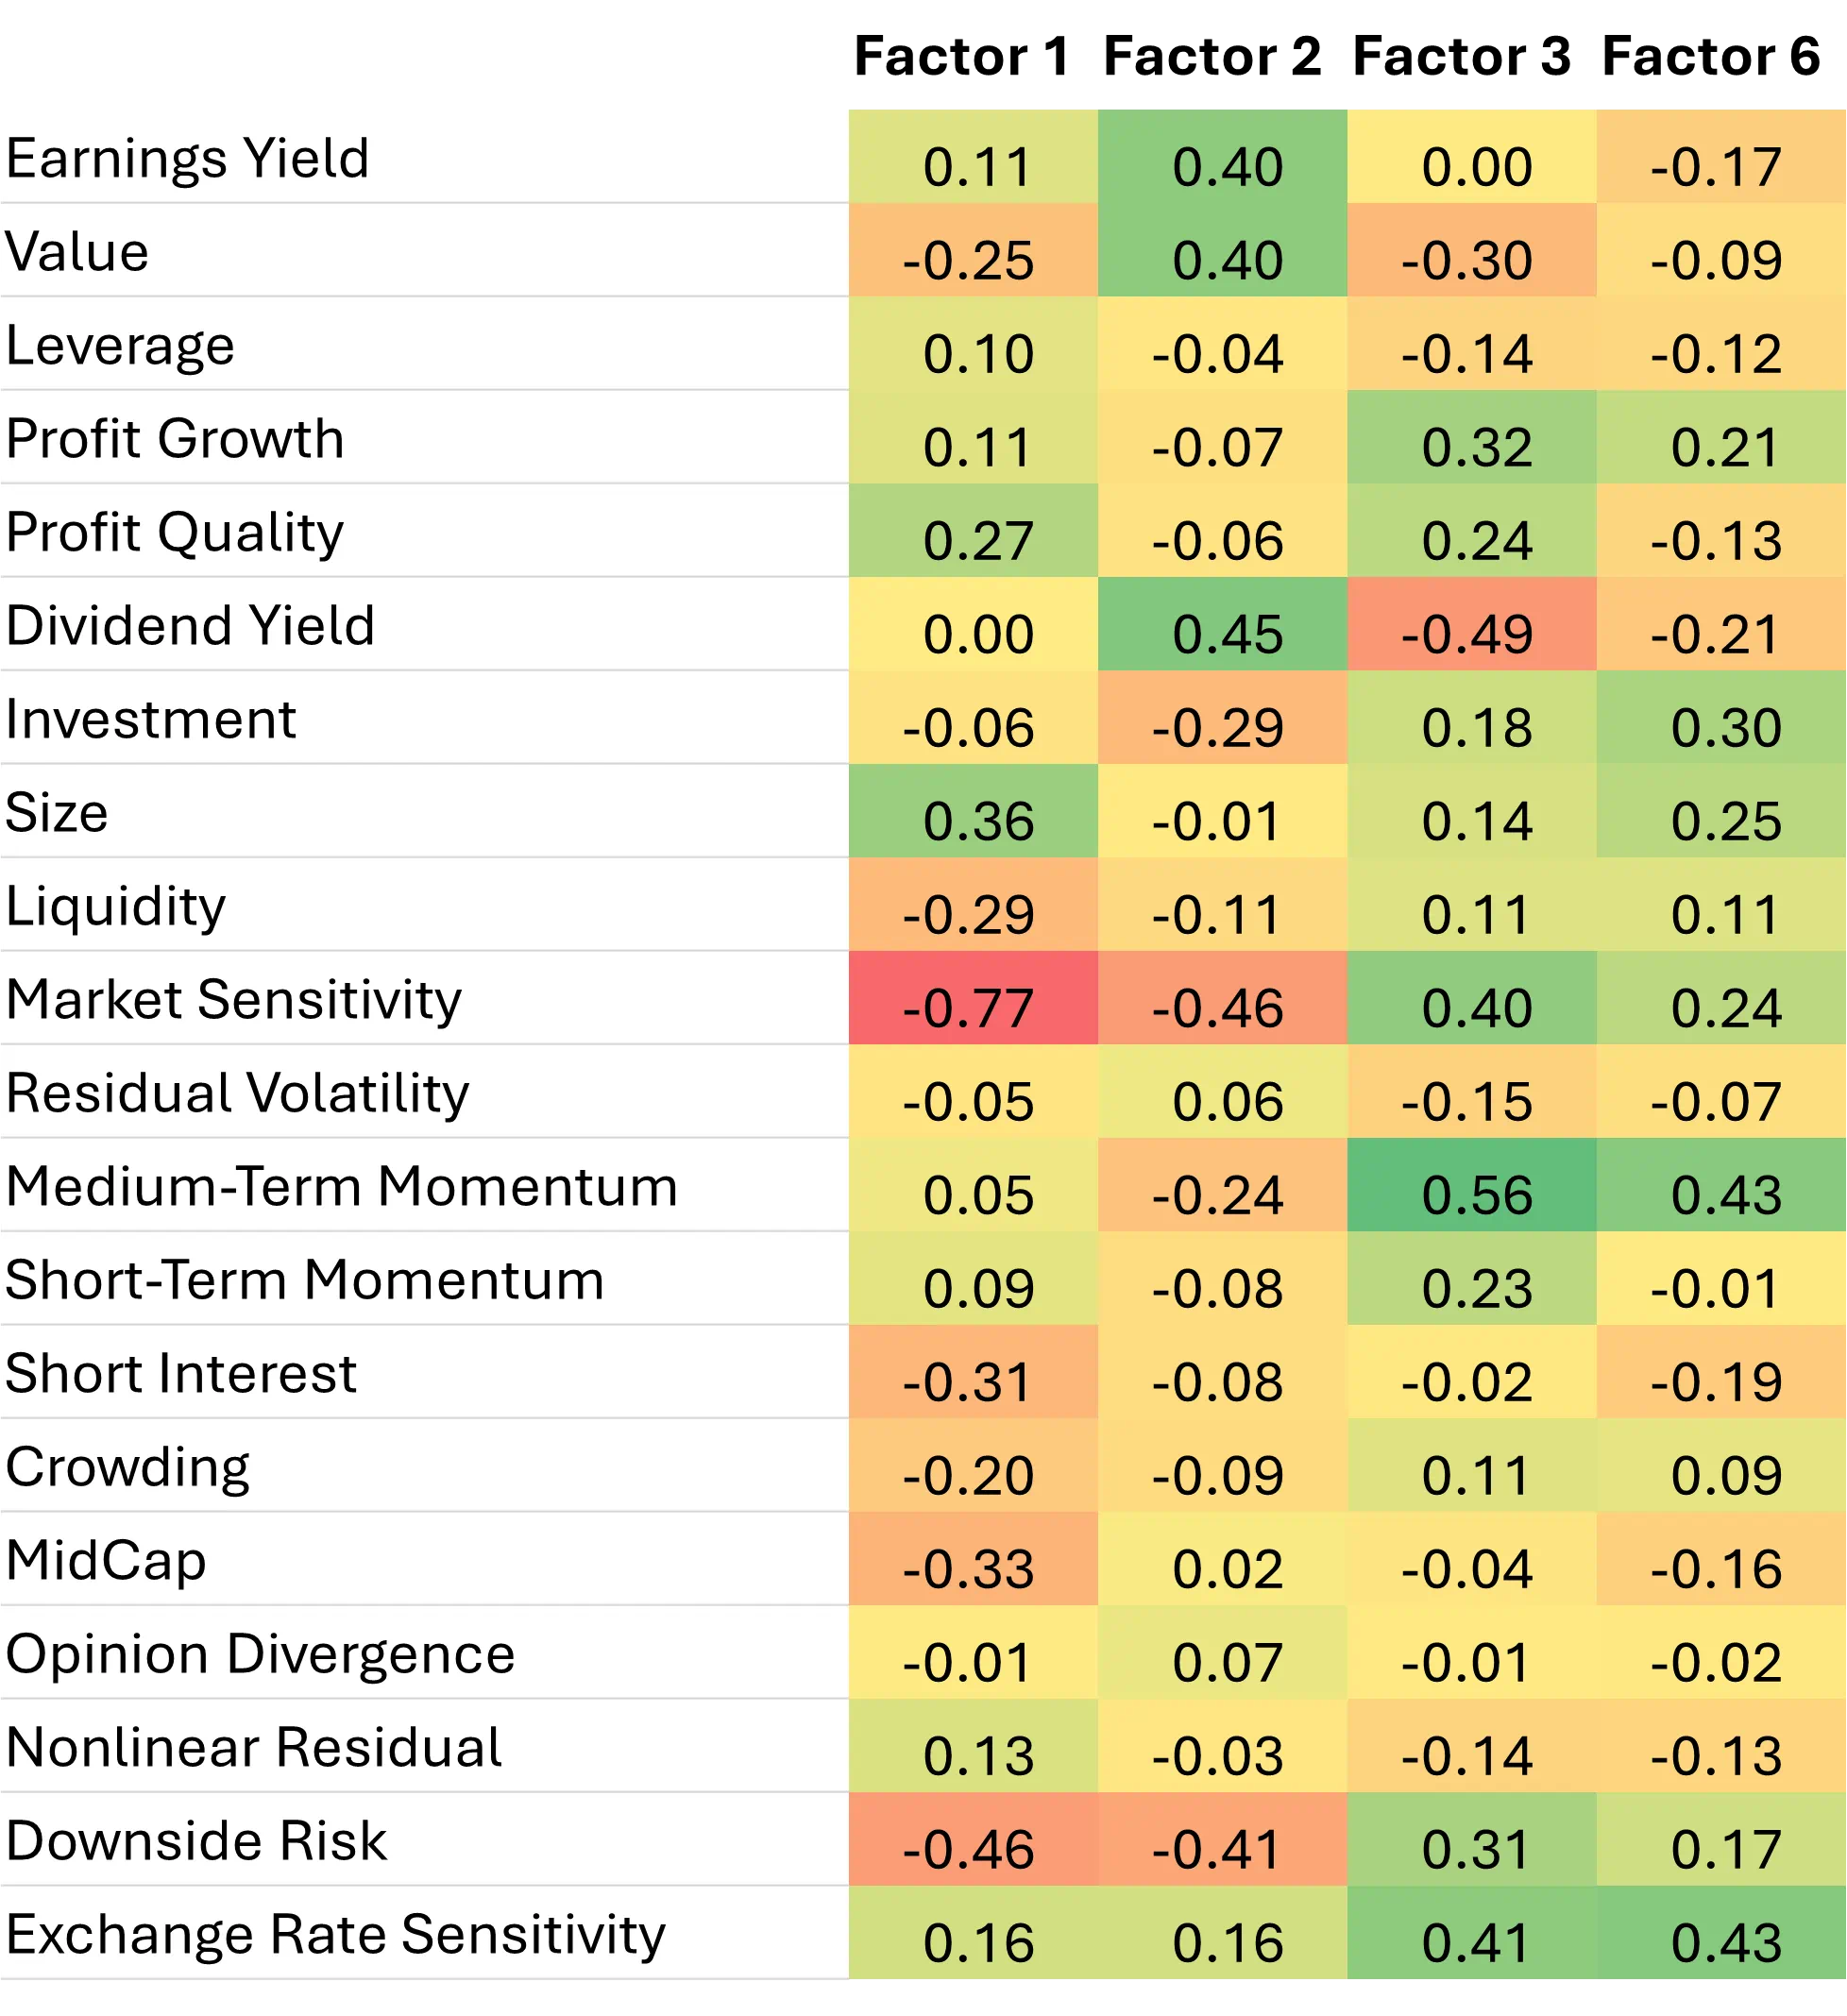
Figure 6: Cross-sectional correlation of Factor Loadings: US5.1 Short Horizon (Fundamental) vs Short Horizon (Statistical)
Source: STOXX® World US Index, Axioma Equity Factor Risk Models (US5.1)
The positive and negative correlations are proxies for “loadings on loadings” to some extent, shedding some light on what the statistical factors are capturing. Starting with Factor 3, the high positive correlations to Market Sensitivity, Medium Term Momentum, Profit Growth and Profit Quality, along with negative correlations to Value, Dividend Yield, and Residual Volatility all would appear to “fit” the mega-cap tech concentration we believe the factor spread captures. On the industry factor side, high positive correlations to Software, IT Hardware, and Semiconductors, as well as a high negative correlation to Electric Utilities confirm this further. The correlations for Factor 6 tell a similar story, with positive correlations to industries like Interactive Media as well (Meta, Alphabet). With Factor 2, the positive correlations are on the Value-related fundamental style factors, and industries such as Energy Equipment, Oil & Gas, Banks, and Insurance. The STOXX® World US index has a negative net exposure to statistical Factor 2.
The importance of alternative lenses
Multiple views of portfolio and market risk are crucial for accurate risk decomposition and portfolio construction. It’s why the Axioma factor risk models include both fundamental and statistical models as standard. While the use case for statistical models is not always so straightforward for fundamentally-driven equity investors, the very structure of the fundamental models that makes them so useful in everyday portfolio management may also prevent them from capturing the transitory systematic risk that exists in the market in times such as these. This is when the availability of “another set of eyes” can be most useful.
Sign up for the our Equity Risk Monitors and learn more about the Axioma Equity Factor Risk Models.
References
*All data is as of February 23, 2024.
Related articles