

EQUITY RISK MONITOR HIGHLIGHTS
WEEK ENDED MARCH 21, 2025
As much hair-pulling and hand-wringing we’ve seen from the mainstream and financial press over the uncertainty introduced into global markets by the Trump administration’s seemingly haphazard application of trade, foreign, and domestic policy, a close look at even very recent market history would show that it hasn’t been that bad.
Using the Russell 1000 index, realized volatility in the 23-day period from the latest market high on 19 February ending Friday the 21st of March stood at just under 20%. Last summer, the confluence of the second leg of the Bank of Japan’s tightening cycle and the invocation of the “Sahm Rule” in the same week (3-month moving average of Unemployment rises by 50 bps from lowest point in last 12 months) indicating the beginning of a recession yielded a much higher spike in volatility, even though the drawdown was not as severe as the current one has been:
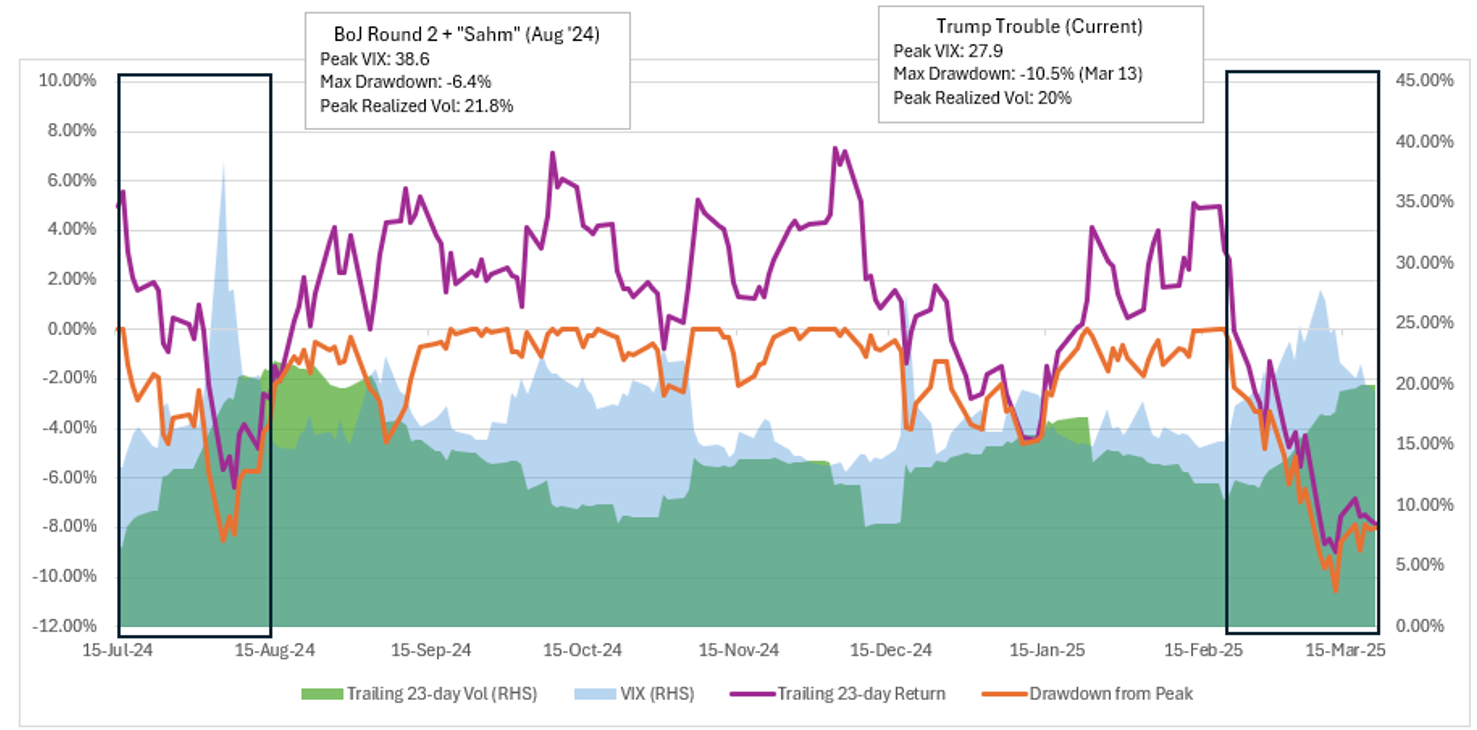
That’s just the most recent prior hiccup we’ve seen. If we go back to 2022 we would be wise to recall the dual volatility spikes and drawdowns that year, from the invasion of Ukraine (February-March) and the recognition of the highest US inflation in 40 years (August-October) . Both of those saw realized 23-day volatility peak closer to 30% and the VIX closer to 40%, and both were much more long-lived, making 2022 a year most investors would like to forget.
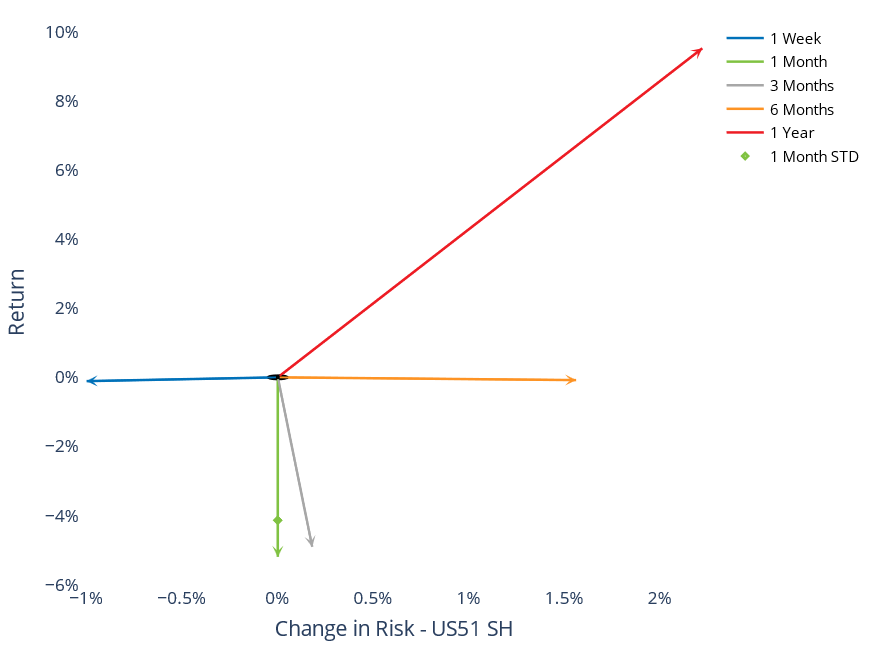
US 5.1 Risk model Forecast Drops
While the Russell 1000 gained 61 basis points this week, the US5.1 short-horizon model’s risk forecast came down by 100 basis points:
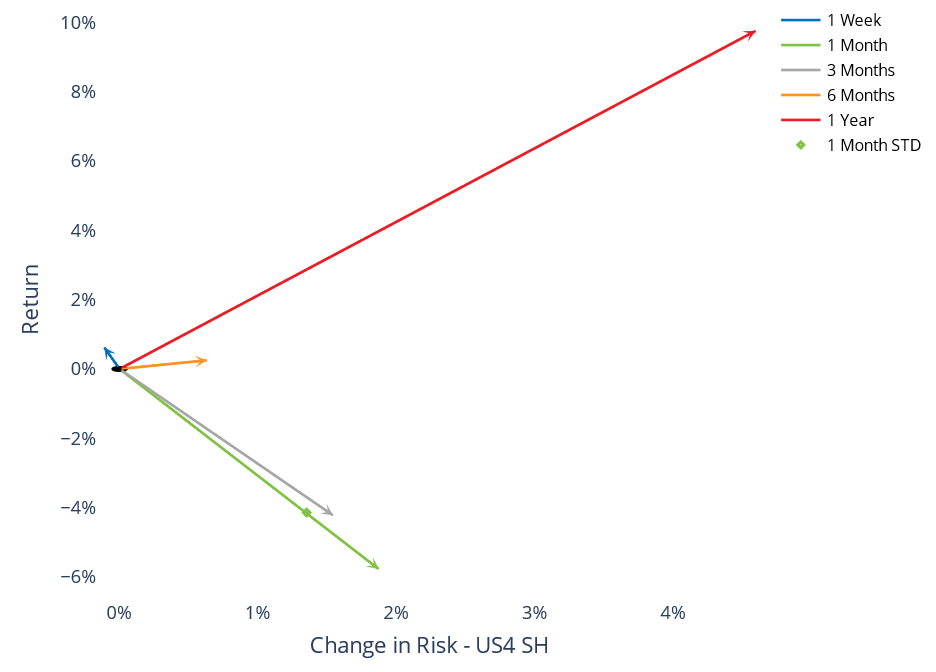
That is a large drop in a single week, and the US4 short-horizon model did not drop by any significant amount:
The 5.1 Version US models introduce a new methodology for adjusting the factor covariance matrix called “Cross-Sectional Volatility Adjustment”, or CSV for short. The CSV method computes the average bias over all the factor returns over 5 day (MH) and 2-day (SH) periods over the last 60 days. Then an exponentially-weighted adjustment factor is used to scale the forecast for the market intercept factor up or down accordingly.
While we don’t know yet if the 5.1 model’s decline is premature, if we look back at the relative performance of US4-SH vs. US5.1-SH in the last volatility shock from the summer of 2024, we see that while both models were caught off guard by the sudden increase, US5.1’s forecasts stopped increasing and began to decline as market volatility began to revert downwards, while US4’s continued to climb:
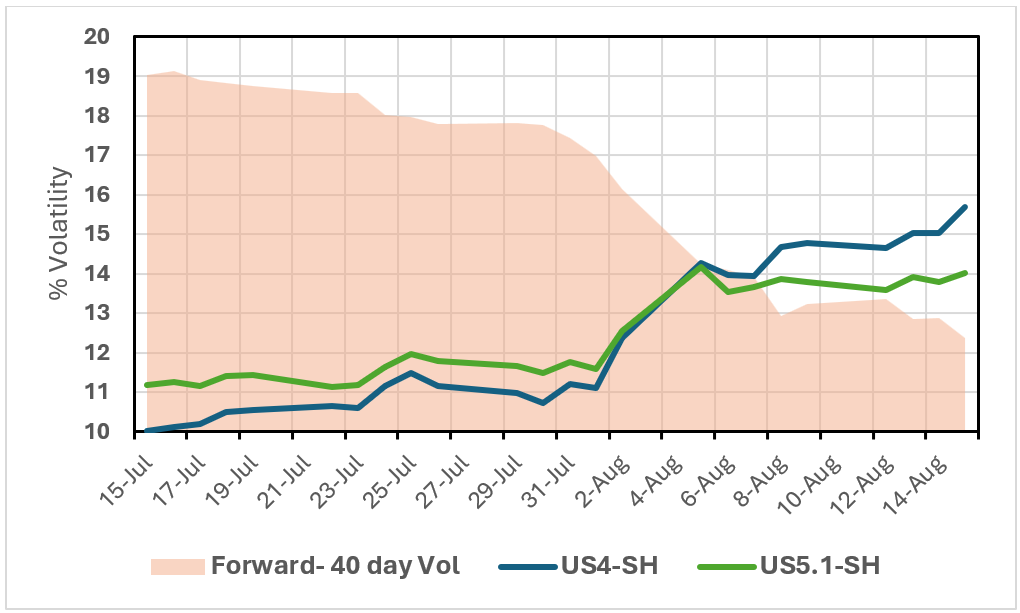
The forecast horizon for SH models is meant to be between 1-2 months (about 40 trading days) so we show the concurrent 40-day forward volatility on each date on the horizontal axis. This demonstrates how US5.1’s CSV adjustment was quicker to adjust to the downside as risk declined rapidly from its peak. Both models were severely under-forecasting going into the shock (although 5.1 was 100 basis points higher in mid-July), but overall, the overshoot/undershoot for 5.1 is a significant improvement over US4, especially in an environment where the risk regime itself appears more volatile. We should expect the same as this more recent shock subsides as well.
You may also like


