

EQUITY RISK MONITOR HIGHLIGHTS
WEEK ENDED MARCH 28, 2025
Style investors beware: factor risk has been climbing in the US, less in other developed markets
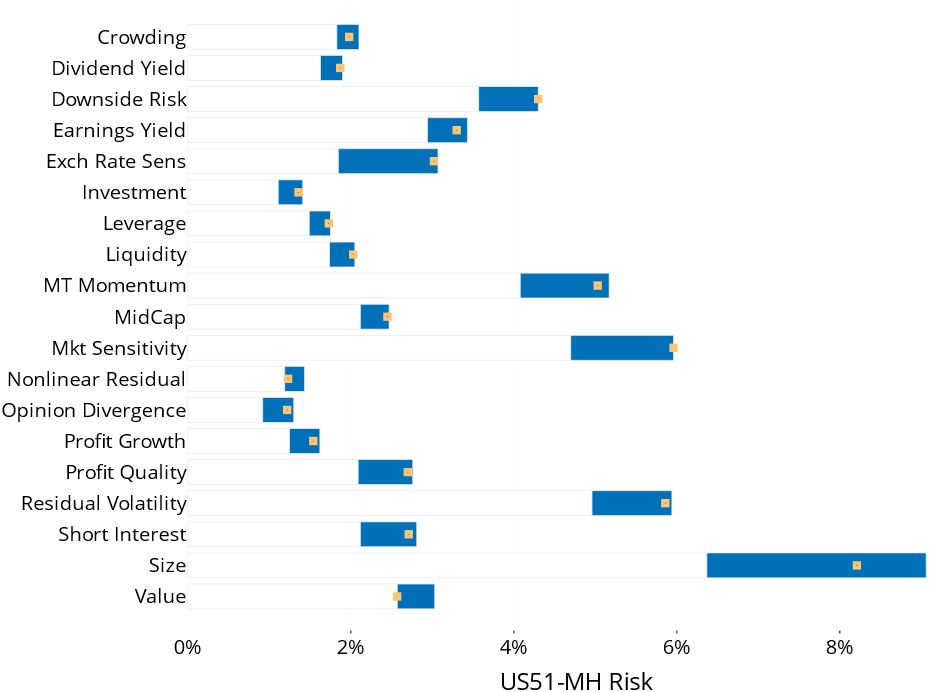
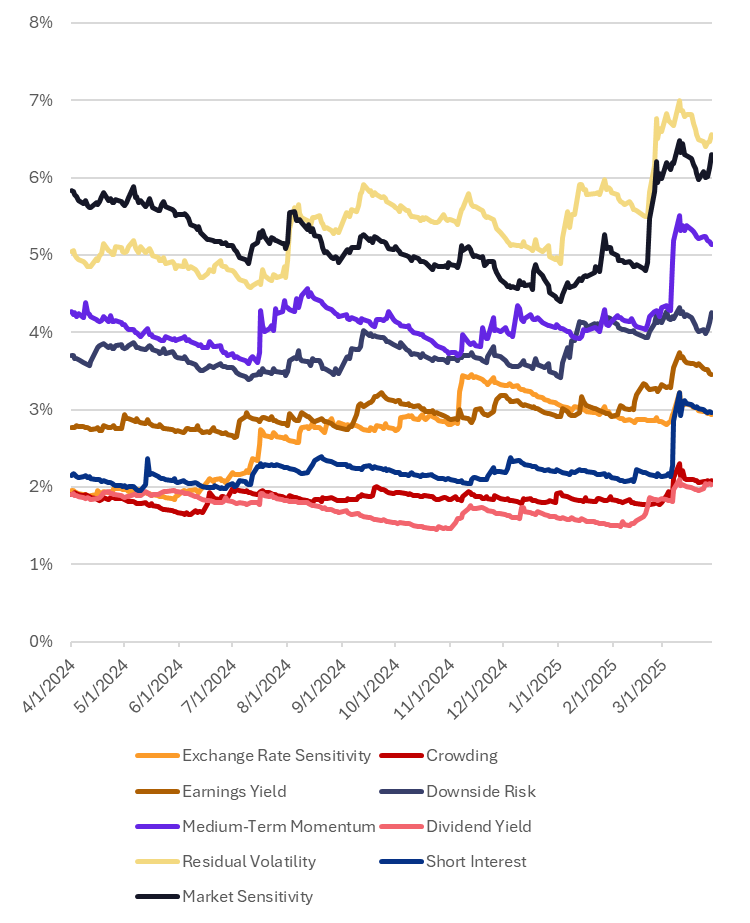
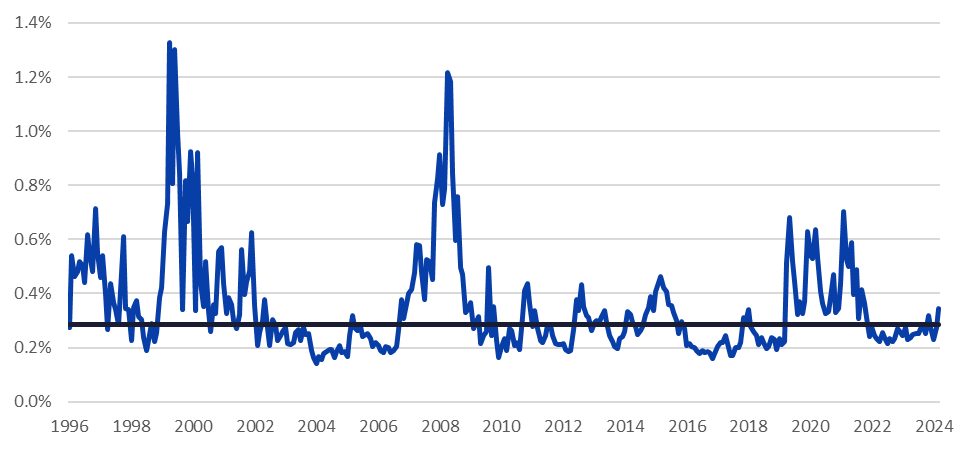
In the US, most style factors in the short-horizon US5 model ended last week at the high end of their 12-month volatility range. Many saw abrupt jumps starting in mid-February, after having drifted down starting around August 2024. When comparing the current level of style risk with a longer history, we find that expected risk for most factors is well above the historical median, with Crowding, Dividend Yield, Downside Risk, Earnings Yield, Leverage, Medium-Term Momentum, Profit Growth, Profit Quality, Residual Volatility and Short Interest all falling in the 80th – 90th percentile relative to history since 1990, and Exchange Rate Sensitivity in the 95th percentile.
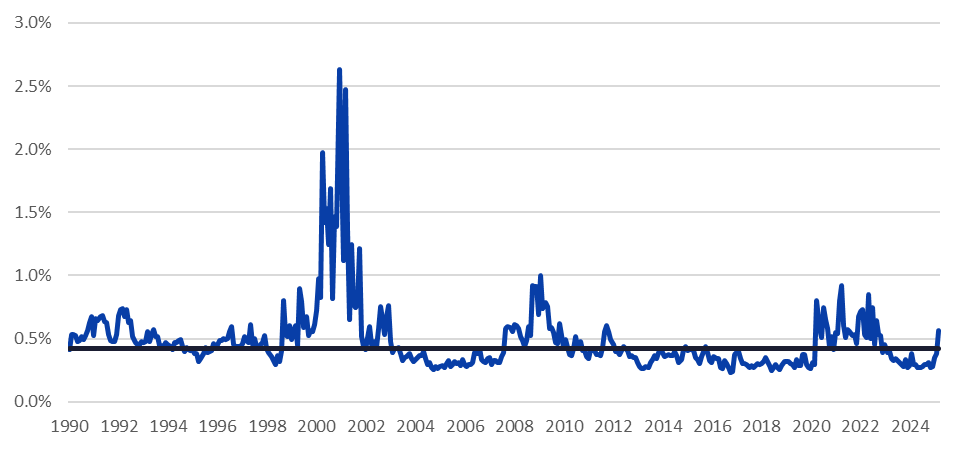
Aggregate style factor volatility for a broad US market index also jumped recently, and is close to the 80th percentile relative to where it has been historically. However, that percentile is deceptive, as the level of style risk has been substantially higher in high-market-stress times such as the burst of the internet bubble, the Global Financial Crisis and the period after the Covid crisis.
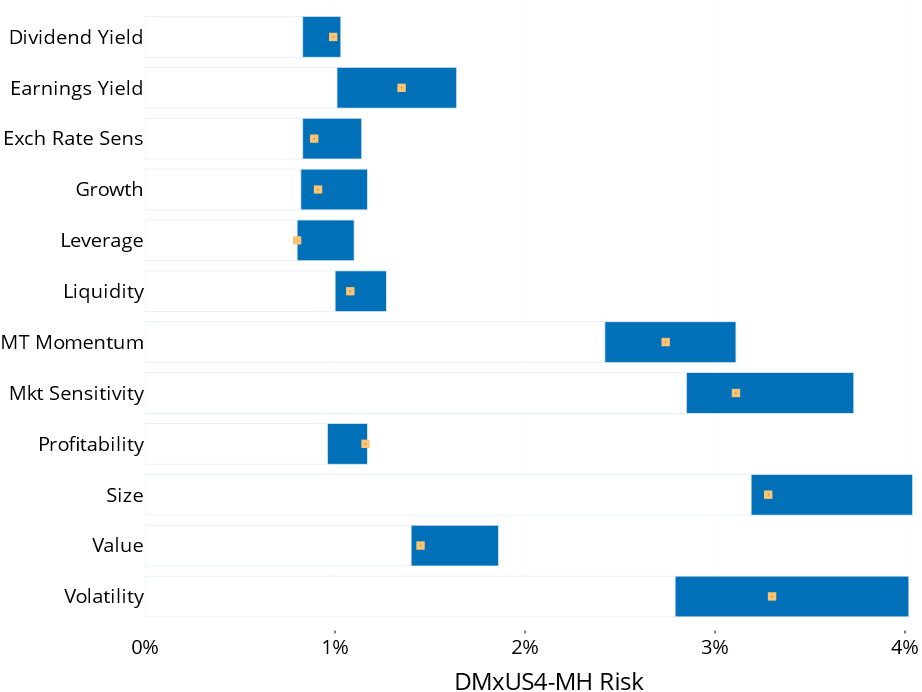
Outside the US the picture is quite different, however. Only Dividend Yield’s expected volatility is near the high end of the 12-month range. Most other factors’ risk is in the middle or toward the low end. And compared with the longer-term, the current forecast for many factors is in the bottom third. Dividend Yield, Medium-Term Momentum and Profitability are the exceptions, all around the 60th-70th percentiles.
Aggregate style risk for the Developed Markets ex-US index using the Axioma Developed Markets ex-US short-horizon model ticked up slightly, but is lower relative to history than what we see in the US.
See the following graph from the US5 Equity Risk Monitor:
Axioma United States Model Style Volatility Range (1 Year)
The following charts are not included in the risk monitors, but are available on request:
Axioma United States Model Daily Predicted Style Volatility
Aggregate Style Risk, Axioma All-Cap US Market Portfolio
See the following graph from the Developed Markets ex-US Equity Risk Monitor:
Axioma Developed Markets ex-US Model Style Volatility Range (1 Year)
The following chart is not included in the risk monitors, but is available on request:
Aggregate Style Risk, Axioma All-Cap Developed Markets ex-USA Market Portfolio
The following is a preview of one of the (many) topics we will cover in our quarterly Insight webinar. Please click here if you are interested in registering.
Many US5 style factor returns had a big quarter, and not always in the direction expected
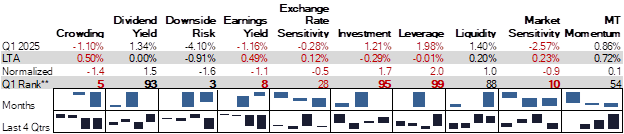
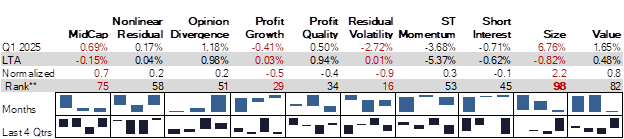
Many style factors in our US5 model had first-quarter returns that fell into the top or bottom quintile relative to the model’s history. Several were also more than one standard deviation away from the long-term average return, suggesting they may have produced some portfolio surprises relative to their expected risk. Finally, certain factors’ returns were in the opposite direction to expectations (where expectations are set by the long-term average), causing further pain. The many factors with higher-magnitude-than-expected returns helps explain the high current level of style volatility as well as the increase in aggregate style risk. Note that these returns are calculated through Friday, March 28, and while the numbers will change based on Monday’s market activity, we suspect the conclusions for the first quarter will not.
The following table shows the Q1-to-date factor return, the long-term average quarterly return, the “normalized” return defined as (Q1 – average) / long-term standard deviation, and the rank of the quarter versus the full model history. The blue sparklines show the return for the three months of the quarter and the black sparklines depict the returns for the last four quarters. Numbers in red highlight Q1 returns that were in the opposite direction from the long-term average.
Crowding, Earnings Yield and Market Sensitivity1 all stand out as factors that have a positive return over the long-term but were likely to have disappointed investors. In contrast, Crowding saw a very negative return in Q1 as investors rotated out of some formerly popular themes, despite the expectation that crowded stocks are likely to outperform. Earnings Yield produced a negative return, although Value (book/price) was positive as expected, suggesting investors may be questioning earnings expectations made earlier in the quarter.
Investment and Size both saw very positive returns, contrasting with their long-term negative expectations. Size’s performance came despite the beating taken by many of the biggest names. Investors sought higher leverage stocks, perhaps with the expectation that rates will fall. This was one of the highest-returning quarters for Leverage in the history of the model, and was two standard deviations above the long-term average. This could be the kind of factor that investors have unintended bets on, and that return therefore may have had a bigger than expected impact on performance.
Be sure to tune in to the webinar, or contact us, for similar analysis of the many single-country, regional and global markets covered by Axioma risk models.
The following tables are not included in the risk monitors, but are available on request:
First quarter 2025 US5 style factor returns and historical comparisons
You may also like


