

EQUITY RISK MONITOR HIGHLIGHTS
WEEK ENDED APRIL 4, 2025
Axioma Risk Monitor: US and Japan hardest hit by tariff turmoil; Asset-asset correlations soar driving up risk and tanking diversification; Energy becomes the biggest loser in the US and internationally
US and Japan hardest hit by tariff turmoil
Major US stock indexes experienced their sharpest weekly declines since March 2020, when the COVID crisis began to unfold. The selloff was driven by the implementation of sweeping tariffs by the US on April 2 and subsequent retaliation by key trading partners, which disrupted global trade expectations and raised fears of slower economic growth and inflationary pressures.
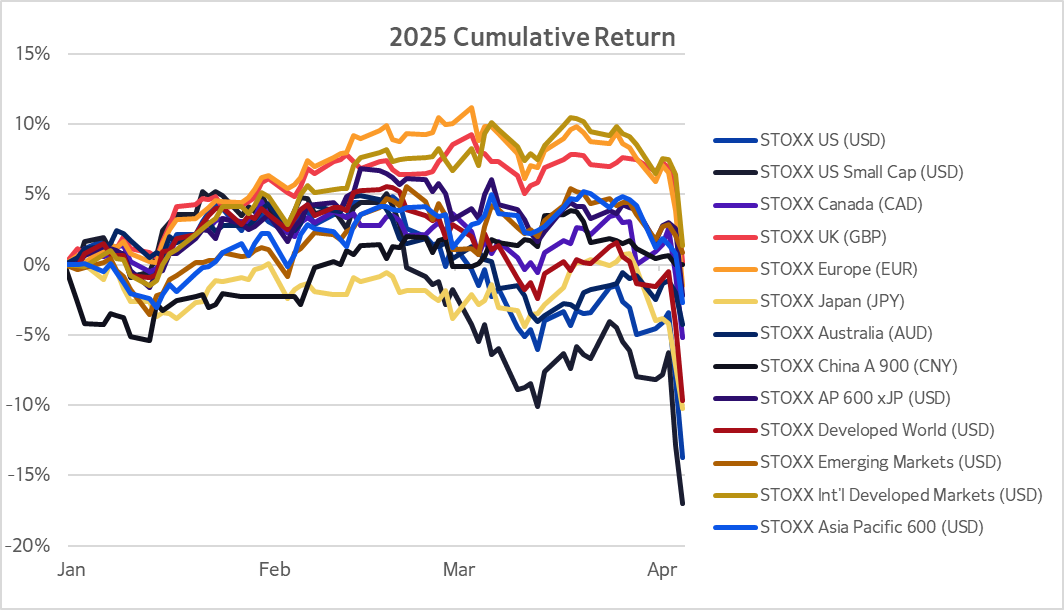
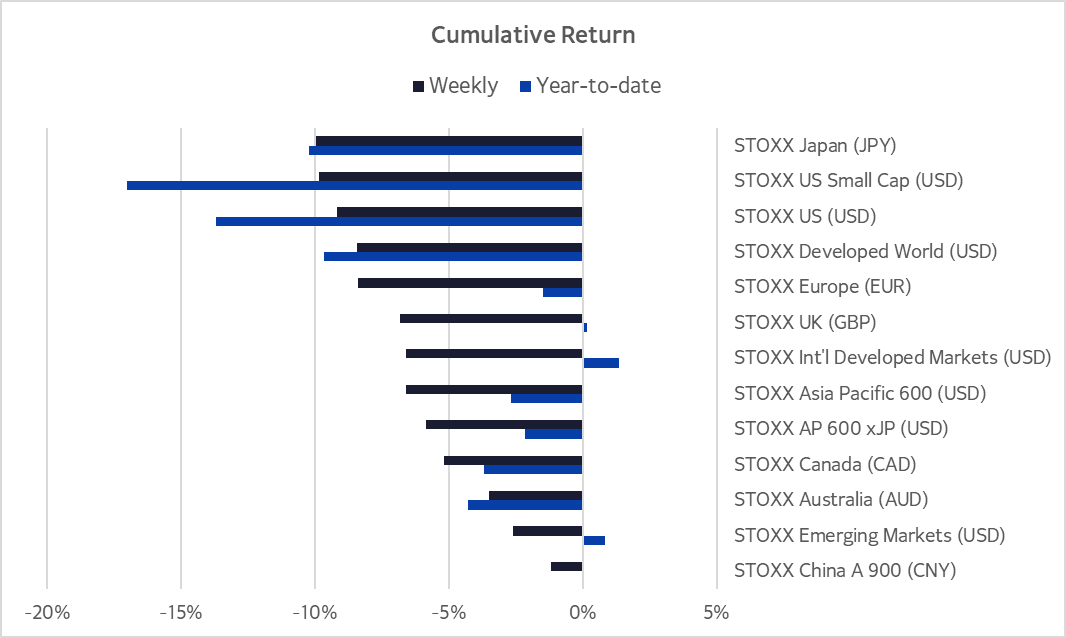
The US and Japan suffered the largest weekly losses, pushing them deep into negative territory for 2025. STOXX Japan and STOXX US Small Cap both fell 10%, while the STOXX US index dropped more than 9% over the past five business days, resulting in year-to-date losses of 10%, 17%, and 14%, respectively.
STOXX Developed Markets (of which the US constitutes 70%) and STOXX Europe 600 suffered the next largest weekly losses, both at 8%. However, the year-to-date return for STOXX Developed Markets is now at -10%, while STOXX Europe 600 is at -1%.
STOXX Emerging Markets and STOXX International Developed Markets (Developed Markets ex-US) fell 3% and 7% over the past week, respectively, and were the only two regions among the geographies tracked by the Equity Risk Monitors to still see a positive, albeit small, year-to-date return (about 1% for both). China, whose market was closed on Friday, saw the smallest weekly decline.
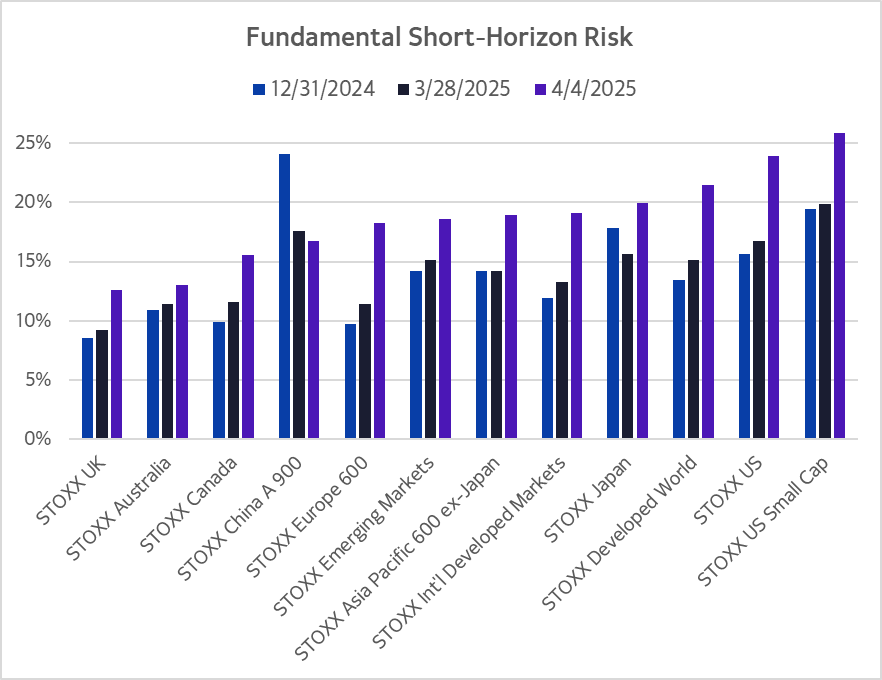
While risk had already been on the rise this year, Wednesday’s announcement sent volatility soaring, with the US and Europe seeing the largest changes. Short-horizon forecasted risk for STOXX US and STOXX Europe 600 jumped about seven percentage points for both indices—a 43% leap for STOXX US and 59% for STOXX Europe 600 from the level of risk only five business days prior. STOXX International Developed Markets’ risk experienced the second-largest weekly jump—44% (or six percentage points in absolute terms).
The US is now the riskiest geography (with forecasted risk around 25%), followed by Developed Markets, Japan, and Developed Markets ex-US. The UK remained the least volatile region, while Europe’s risk positioned it somewhere in the middle of the pack, as measured by Axioma fundamental short-horizon regional models. We have not seen these levels of risk since late 2022, when countries around the world were battling high inflation.
One bright spot in this turmoil is the diversification available from investing in US Treasuries and outside the US equity market. See more information in this week’s Multi-asset Class Risk Monitor Highlights.
The following charts are not in the Equity Risk Monitors but are available on request:
Asset-asset correlations surge driving up risk and tanking diversification
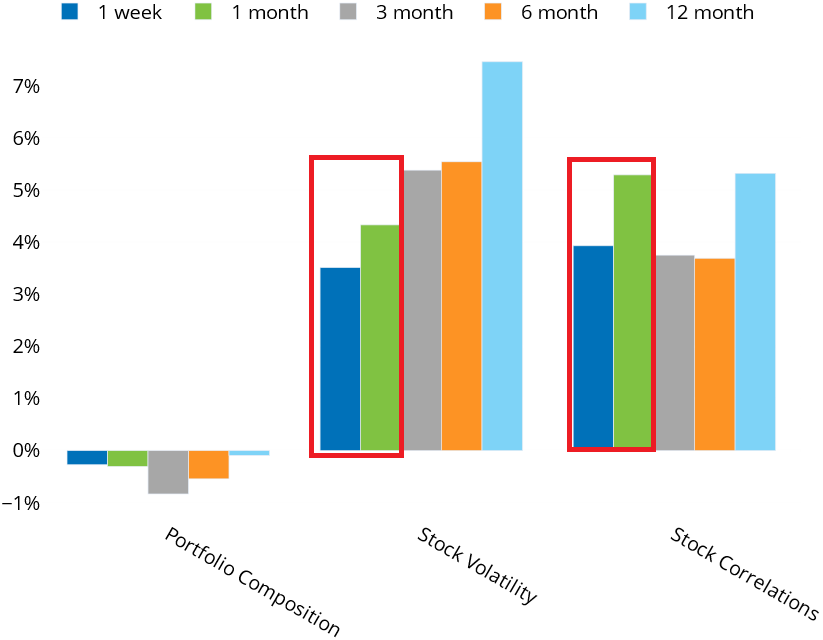
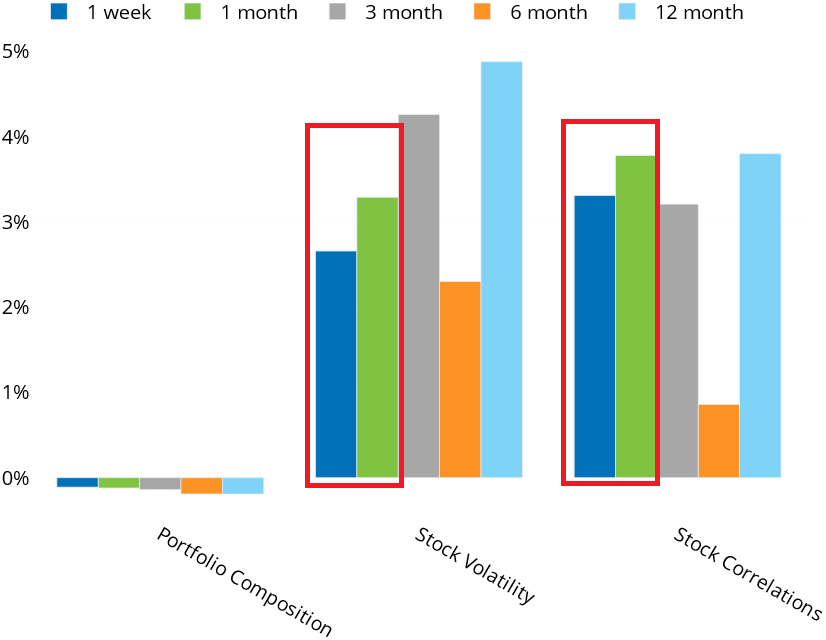
Asset-asset correlations surged worldwide as stock prices were influenced more by tariff-related news than by individual company characteristics. The increase in stock correlation contributed slightly more to the change in risk over the past week and month for most benchmarks tracked by the Equity Risk Monitors, compared to the increase in stock volatility. This contrasts with the three-, six-, and twelve-month periods, where the decomposition of the change in risk from a dense matrix perspective revealed that stock volatility was the main driver of the risk increase.
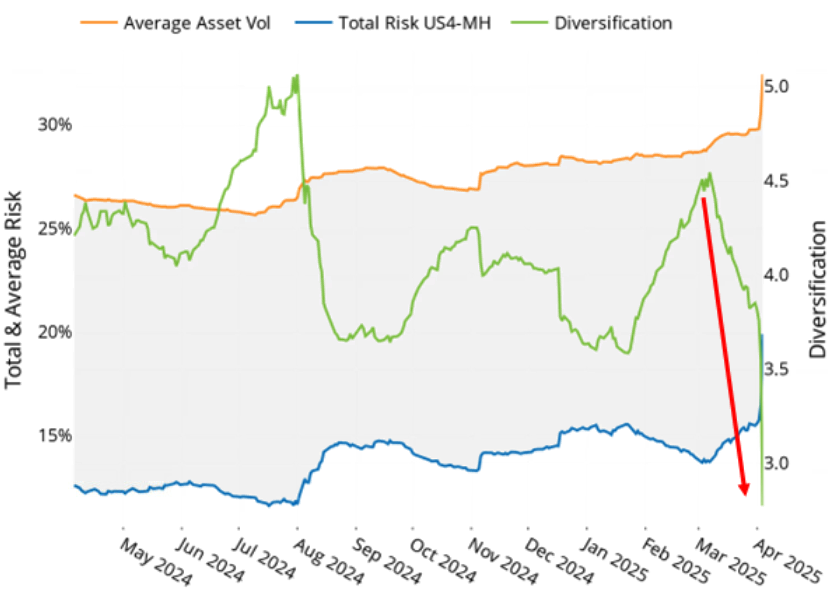
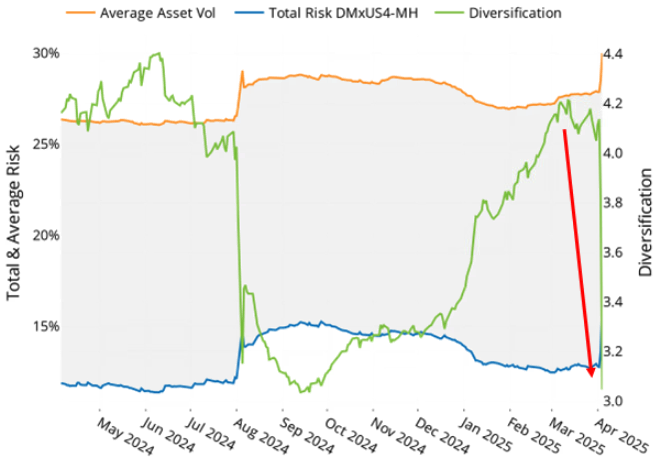
With correlations soaring, asset diversification plummeted globally. After peaking around 4.5 in March, asset diversification in both STOXX US and STOXX International Developed indices dropped to about 3.0. In the US index, asset diversification has reached at least a 12-month low, indicating that portfolio managers are now in the worst position to diversify their portfolios in quite some time.
The asset-diversification ratio is calculated as the weighted sum of asset variances for each stock in the index divided by the total forecasted index variance. It measures the impact of correlations on total risk. A diversification ratio of 1.0 would indicate perfect positive correlation among the stocks in an index, and the lower it gets, the higher the implied average correlation among index members.
See graphs from the STOXX US Equity Risk Monitor as of 4 April 2025:
STOXX US - US4 Risk Change Decomposition - Dense Matrix
STOXX® US - Diversification Ratio
See graphs from the STOXX International Developed Markets Equity Risk Monitor as of 4 April 2025:
STOXX® International Developed Markets – DMexUS4 Risk Change Decomposition - Dense Matrix
STOXX® International Developed Markets - Diversification Ratio
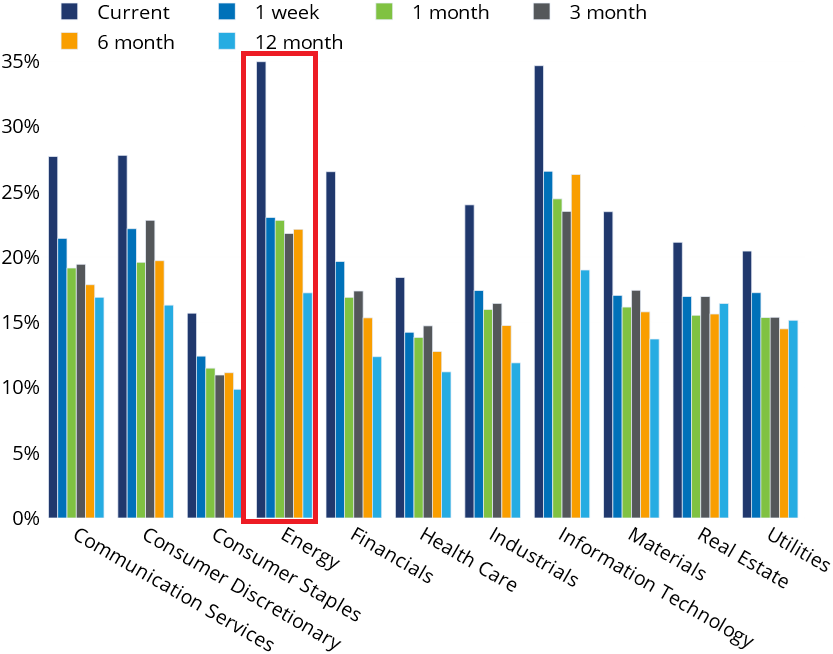
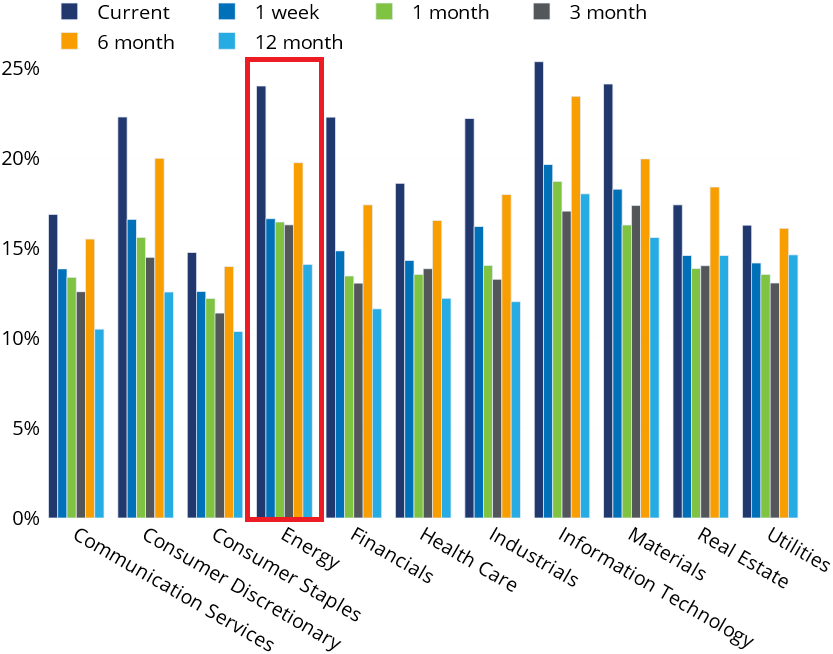
Energy becomes the biggest loser in the US and internationally
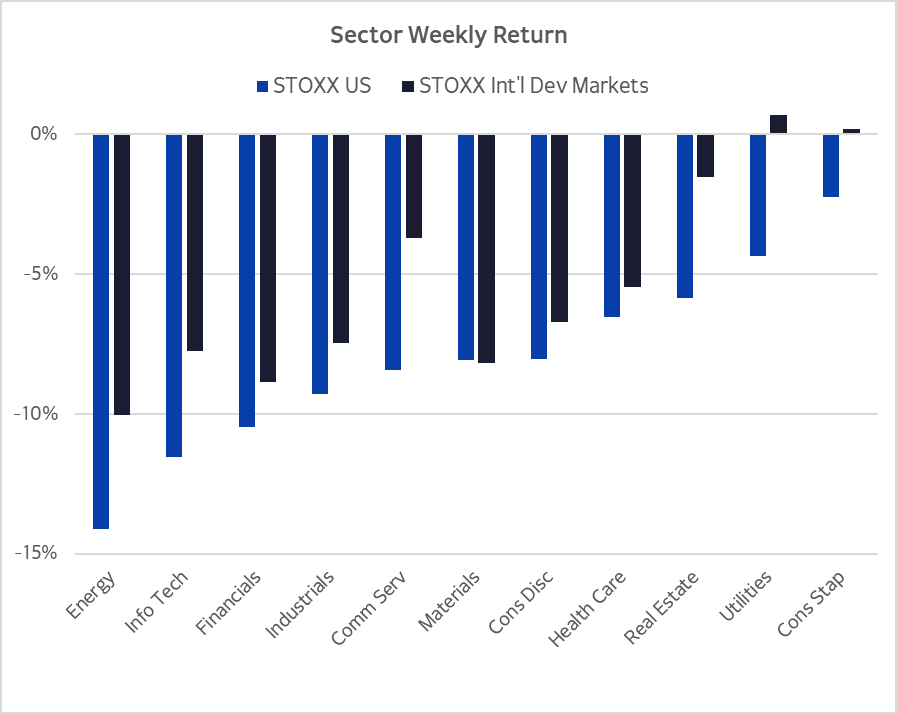
Energy saw the largest losses in the US and international markets, as a potential global economic slowdown induced by tariffs would translate into less energy demand. All sectors participated in the US market decline but in Developed Markets ex-US there were still a couple of sectors that showed small gains.
Information Technology and Financials, the top largest sectors in the US were also the second and third biggest losers after Energy, contributing nearly half of the US market decline. Energy’s weight in the STOXX US index is less than 5%, resulting in a relatively small contribution to the weekly market decline.
In Developed Markets ex-US, Financials and Materials experienced the second and third largest losses after Energy. Here, Financials and Industrials drove the market down due to their significant weights in the STOXX International Developed Markets index.
Utilities and Consumer Staples—defensive sectors that tend to be more resistant to economic turmoil—experienced the smallest losses in the US and minor gains in Developed Markets ex-US.
Risk increased for all sectors in both the US and Developed Markets ex-US. Energy became the riskiest US sector, surpassing Information Technology, which had been the riskiest sector over the past 12 months. In Developed Markets ex-US, Energy’s risk has not yet exceeded that of the tech sector, but it is getting closer. Consumer Staples remained the least risky sector in both regions.
The following chart is not included in the Equity Risk Monitors but is available on request:
See graph from the STOXX US Equity Risk Monitor as of 4 April 2025:
STOXX® US - Sector Risk
See graph from the STOXX International Developed Markets Equity Risk Monitor as of 4 April 2025:
STOXX® International Developed Markets - Sector Risk
You may also like


