

EQUITY RISK MONITOR HIGHLIGHTS
WEEK ENDED APRIL 11, 2025
Axioma Risk Monitor: Historic swings highlight US stock market fragility; Surging US risk mirrors past crises, but falls short of peaks; As risk soars globally, Middle Eastern markets show more stability
Historic swings highlight US stock market fragility
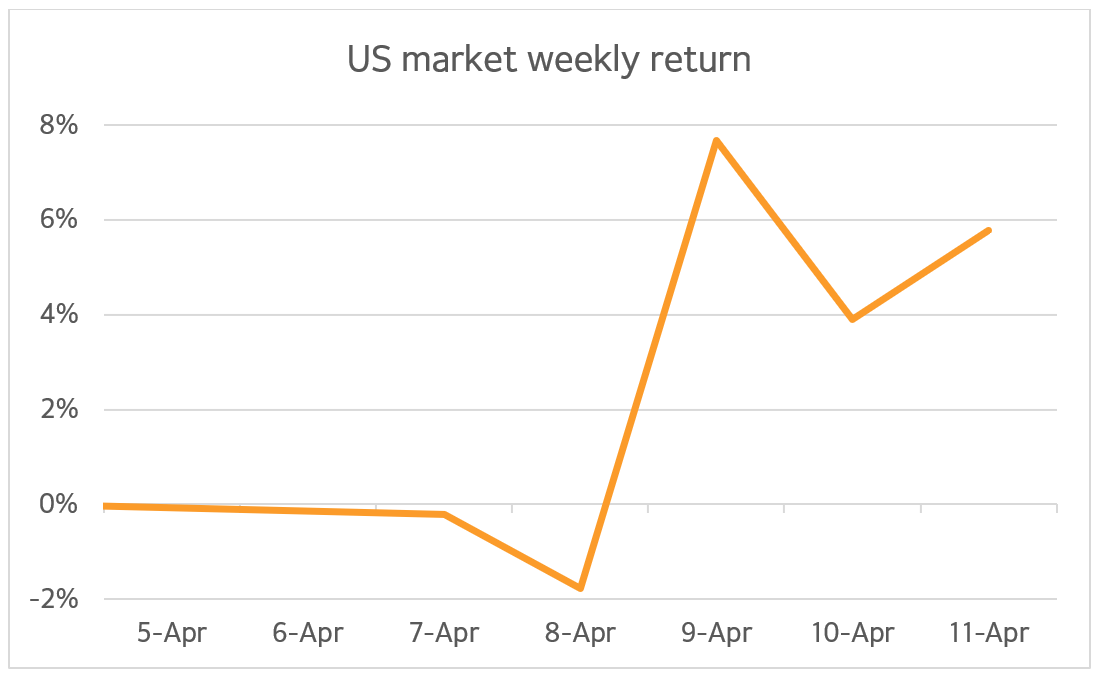
The US stock market faced extraordinary turbulence last week, with historic highs and lows defining the period. On April 9, the market recorded its strongest single-day performance in 44 years, reflected in a remarkable 9.6% surge in the STOXX US index. This rally stemmed from investor optimism following the Trump administration's announcement of a 90-day halt in reciprocal tariffs, though notably excluding China.
However, the optimism evaporated by the following day, when China imposed retaliatory tariffs and the White House confirmed an increase in tariffs on Chinese goods to 145%. The STOXX US index fell by 3.5% on April 10 marking one of the market’s worst days since 1982.
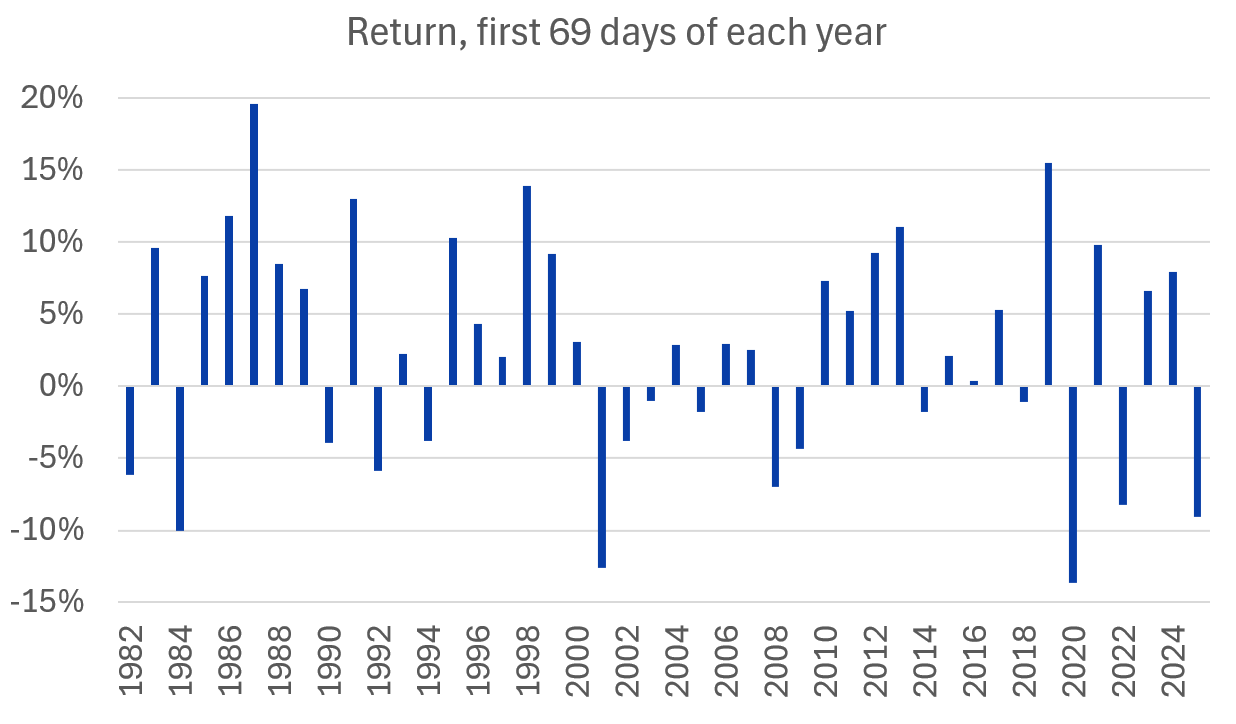
By the end of the week, the market had achieved a 5% gain; however, STOXX US remained down nearly 9% for the year. This first-69-day cumulative return in 2025 ranks among the worst since 1982—surpassed only by the beginning of 2001 during the bursting of the internet bubble, and 2020 amid the COVID-19 crisis. Factors such as erratic tariff moves, fears of persistent inflationary pressures, and the Federal Reserve's cautious approach to interest rates weighted on investor sentiment. This week's events underscored the fragility of the market and the challenges posed by geopolitical and economic uncertainties.
The following charts are not in the Equity Risk Monitors but are available on request:
Surging US risk mirrors historic crises, but falls short of peaks
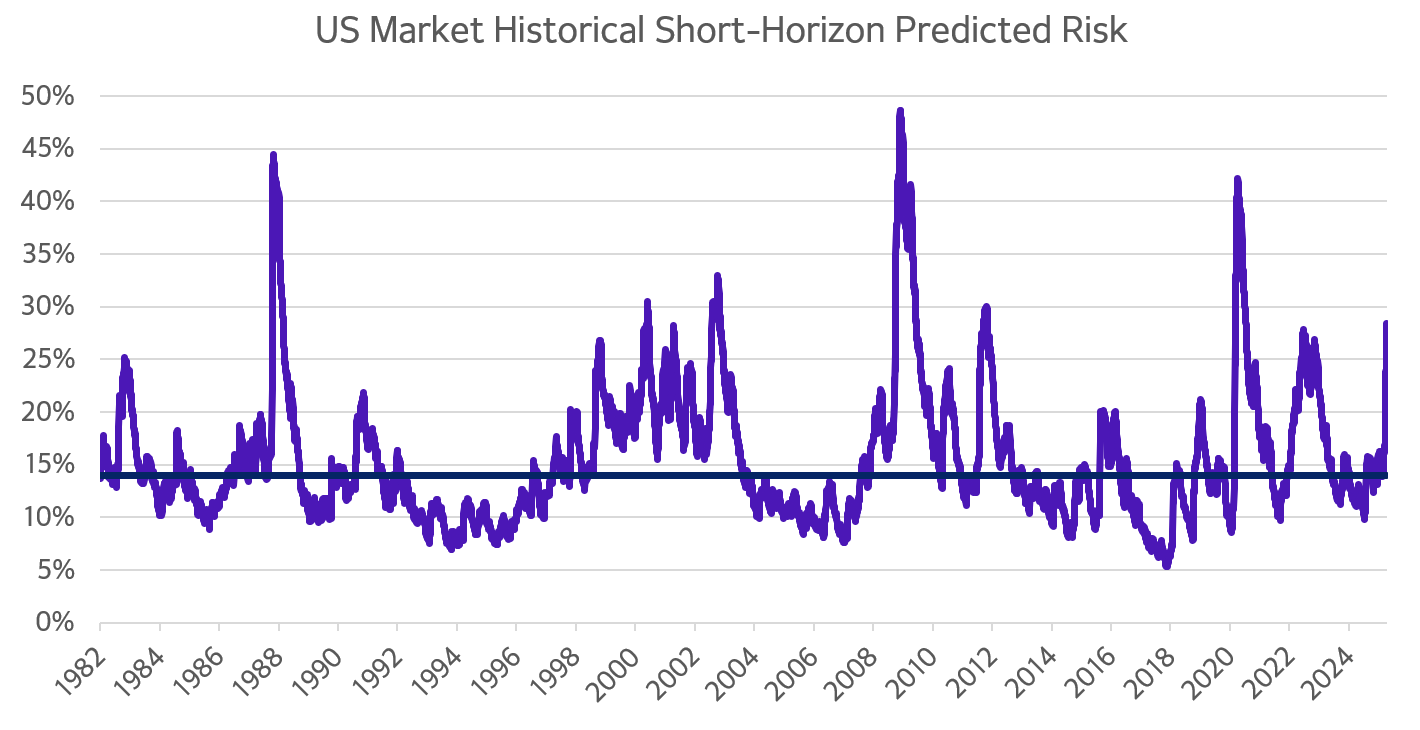
Last week witnessed a significant surge in US forecasted risk, which had already been climbing since the April 2 tariff announcement. The tumultuous April 7-11 week added nearly 300 basis points to US risk to bring the total increase over the past seven business days to 10 percentage points, according to the Axioma US4 fundamental short-horizon risk model. The five-day change since April 4 ranks among the highest proportional changes in US market history.
Currently the US risk level stands at 28%, placing it in the 94th percentile in data going back to 1982. This is double the long-term median of 14% and it mirrors the levels initially observed during the COVID crisis. However, it has yet to reach the peaks seen in 2020 or during the Global Financial Crisis in 2008.
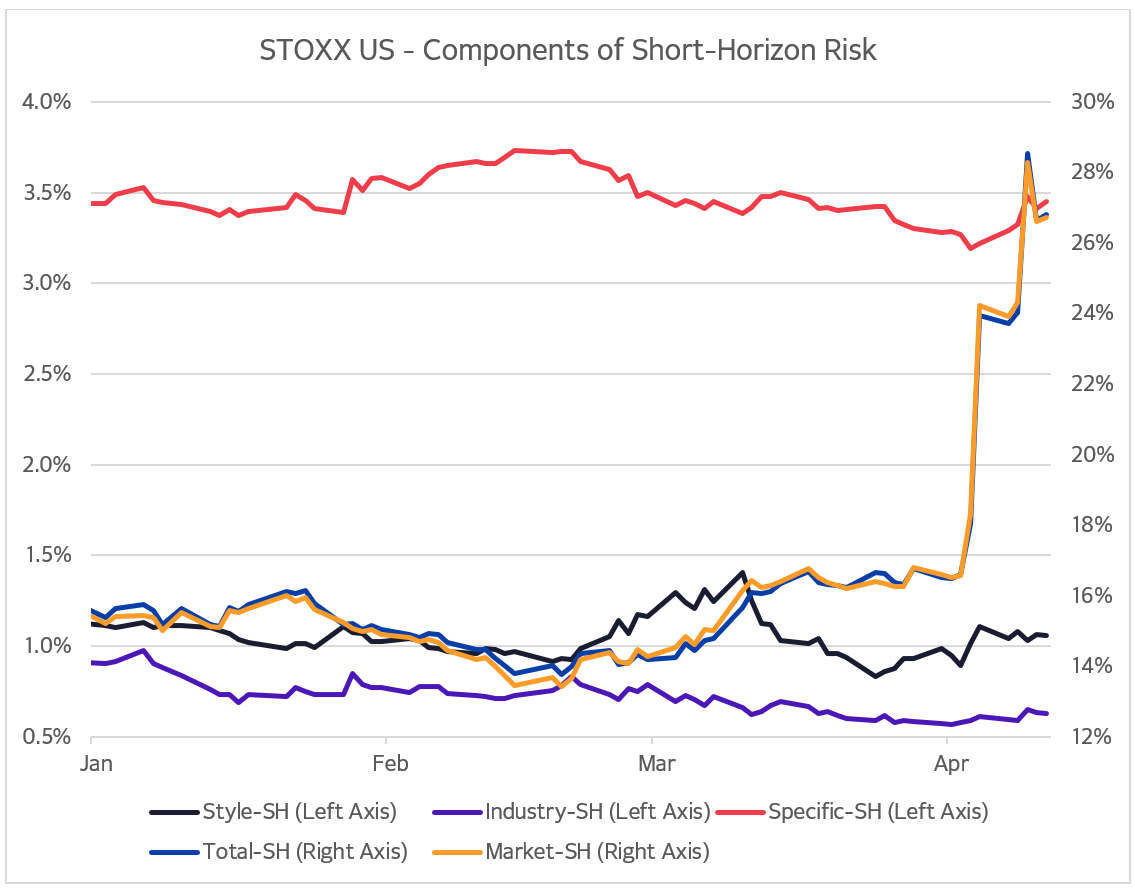
Among the major components of risk, market risk has been the primary driver of US total risk rise since April 2. Style risk saw the second-largest increase in risk over the same period, while industry and stock-specific risk (which is only a small part of total benchmark risk) also rose slightly, with their percentage changes remaining in the single digits over the past seven business days.
For an illustrative example of how one may go about capturing the systematic risk of tariffs and limiting exposure to this risk and other transient themes in equity portfolios see blog post Beyond the fundamentals: Tariff and meme risk blind spots.
The following charts are not in the Equity Risk Monitors but are available on request:
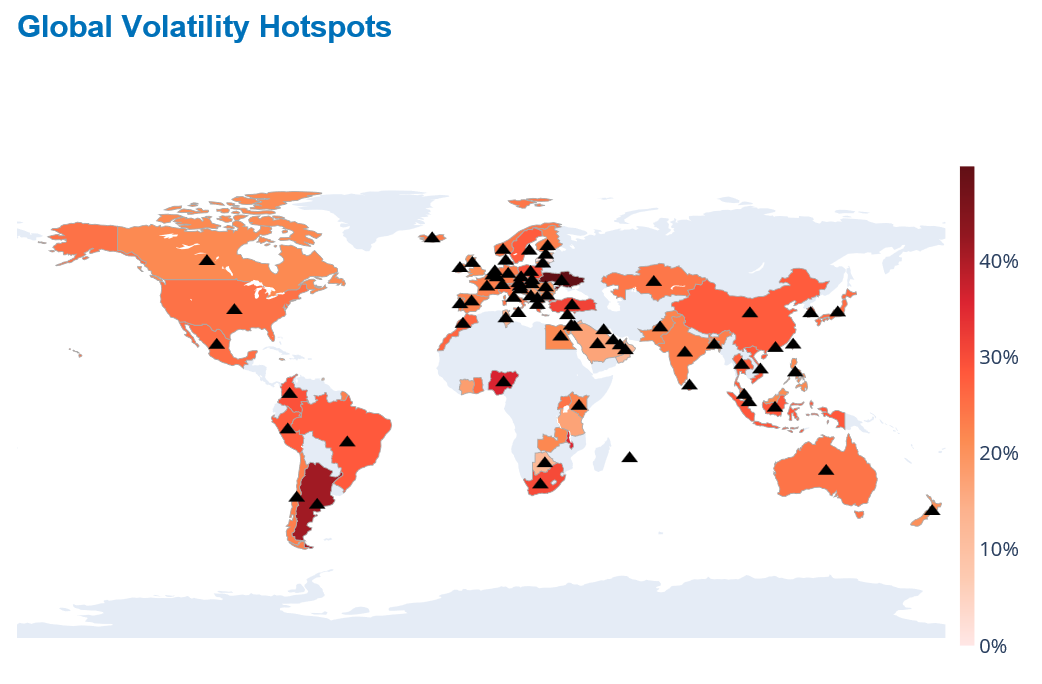
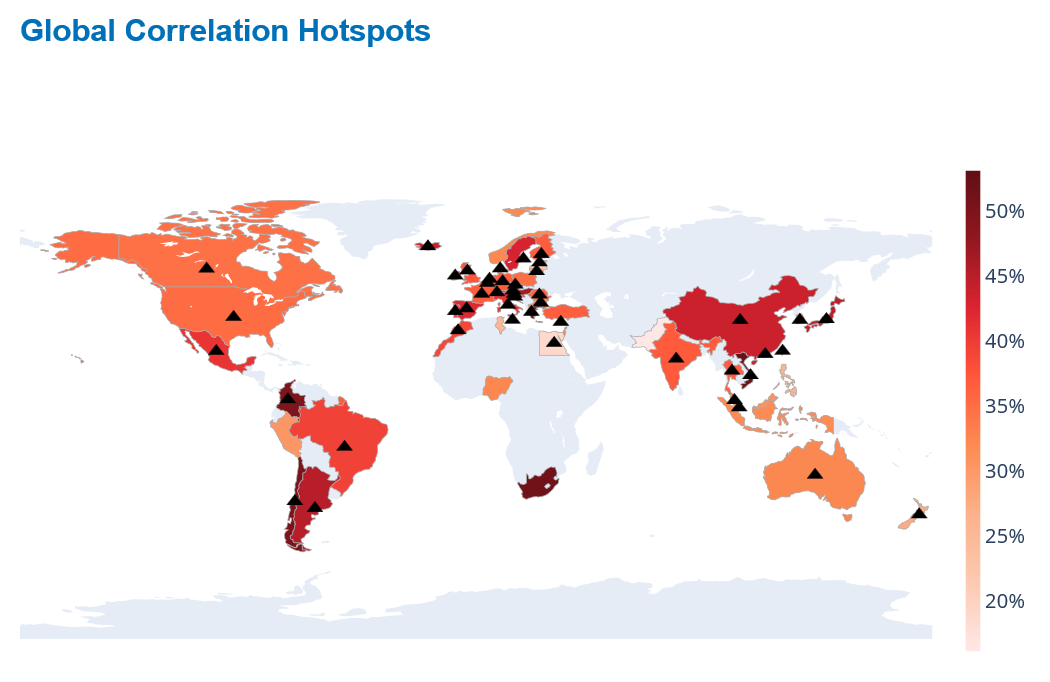
As risk soars globally, Middle Eastern markets show more stability
The ripple effects of the bank-and-forth on US tariffs and the potential realignment of global trade reverberated worldwide. The latest charts of global volatility and correlation hotspots were littered with upward arrows, reflecting sharp increases in volatility and correlations at the individual country level. Axioma’s Worldwide short-horizon fundamental model showed that volatility rose more than one percentage point, while correlations increased by more than two percentage points in the majority of countries on all continents last week.
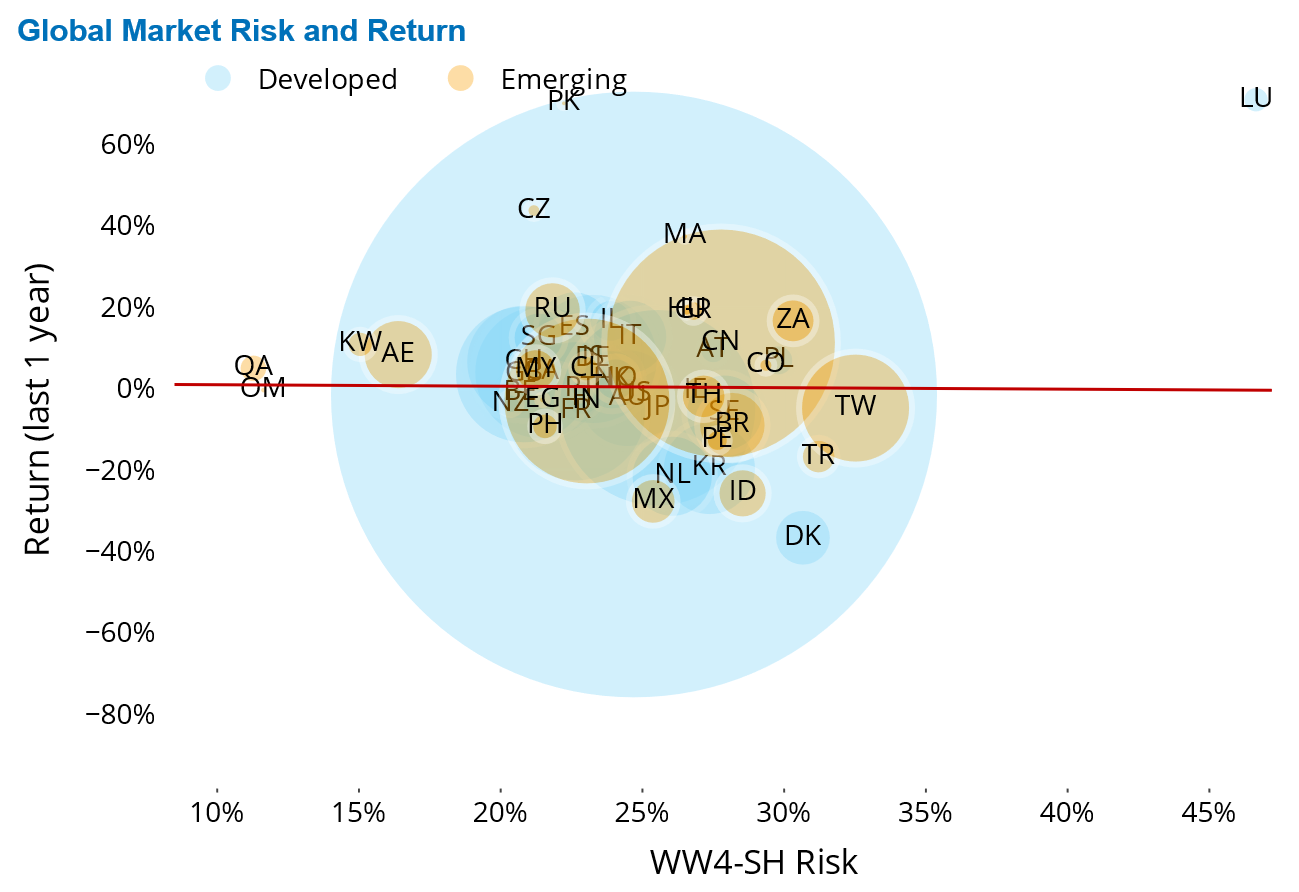
Asian countries saw the most significant market declines last week, with Hong Kong, Taiwan, Singapore, and China leading the fall. Conversely, South Africa, the Czech Republic, and Hungary experienced gains, emerging as the top performers over the past year as well.
Over the 12-month period, performance was mixed, with about half of the main developed and emerging countries in positive territory and half experiencing losses. Denmark, Mexico, and Indonesia recorded the largest one-year losses. The United States experienced a modest 1% loss, while China saw an impressive 11% gain when measured in US dollars.
Taiwan has become the riskiest emerging market with a volatility rate of 32%, closely followed by Turkey and Denmark. In contrast, Middle Eastern countries such as Qatar, Oman, Kuwait, and the United Arab Emirates were among the least volatile, indicating more stable market conditions.
See graphs from the Equity Risk Monitors as of April 11, 2025:
You may also like


