
EQUITY RISK MONITOR HIGHLIGHTS
WEEK ENDED APRIL 17, 2025
With markets so volatile, writing commentary that is not stale before it is even out the door is becoming increasingly difficult. Yet we persist, and hope our commentary can at least help managers understand what has happened to risk in their portfolios recently.
- US volatility increase has stalled, but predicted risk remains high
- Energy and Technology style exposures have changed
- High equity volatility is reflected in outsized factor performance
US volatility increase has stalled, but predicted risk remains high
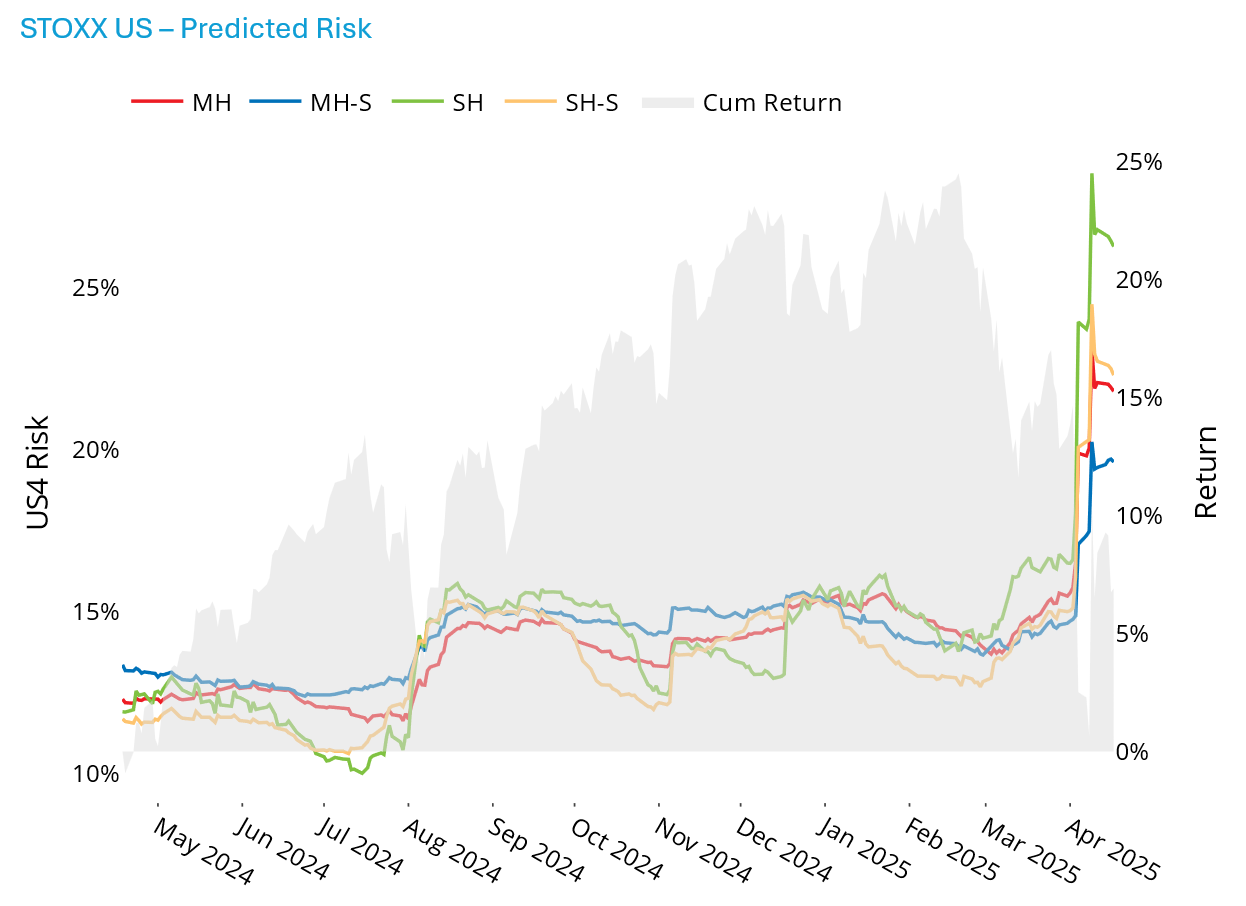
According to the Axioma US4 model, short-horizon predicted volatility for the STOXX US Index as of April 17 has backed off slightly from its recent highs, although it remains quite elevated relative to recent and long-term history, as well as when it is compared with other markets. The short-horizon fundamental forecast – highest among the four model variants (statistical and fundamental, medium- and short-horizon) – ended last week at 26.3%.
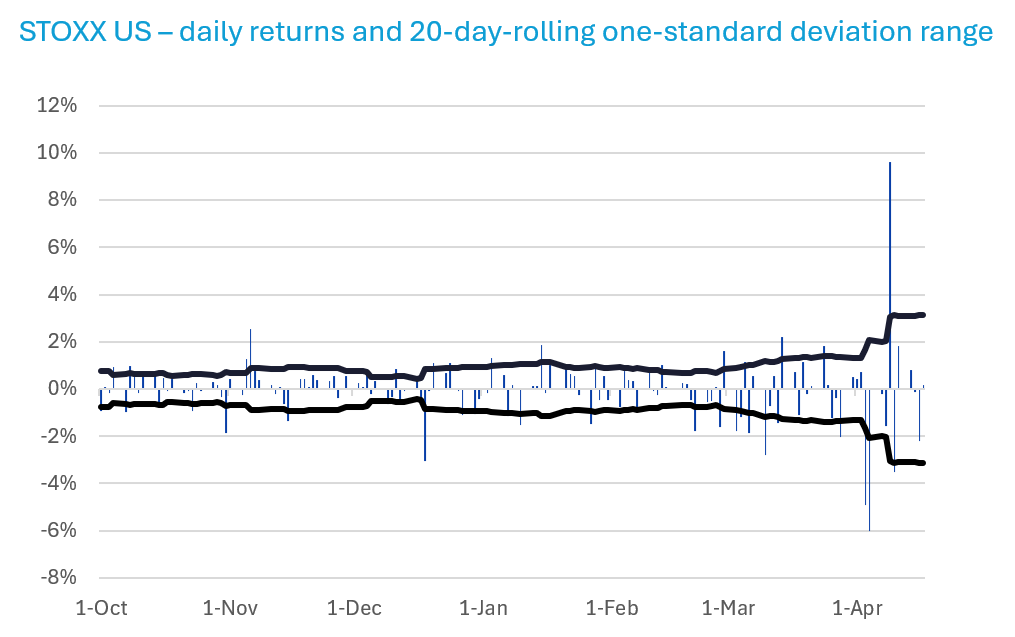
A chart of daily returns shows how much more volatile the days since “Liberation Day” have been relative to the prior six months and indeed over the longer term. Since 2018 the average absolute value of daily returns for the index has been about 85 basis points. The average since April 3 has been 281 basis points, or more than three times the longer-term average. However, most of that extreme volatility occurred in the seven days commencing on the 3rd; the recent relative calm (through last Thursday, when the average absolute value of returns was equal to the long-term average) explains the slight fall-off in volatility.
See graph from the STOXX US Equity Risk Monitor as of April 17, 2025
The following chart does not appear in the risk monitors but is available on request
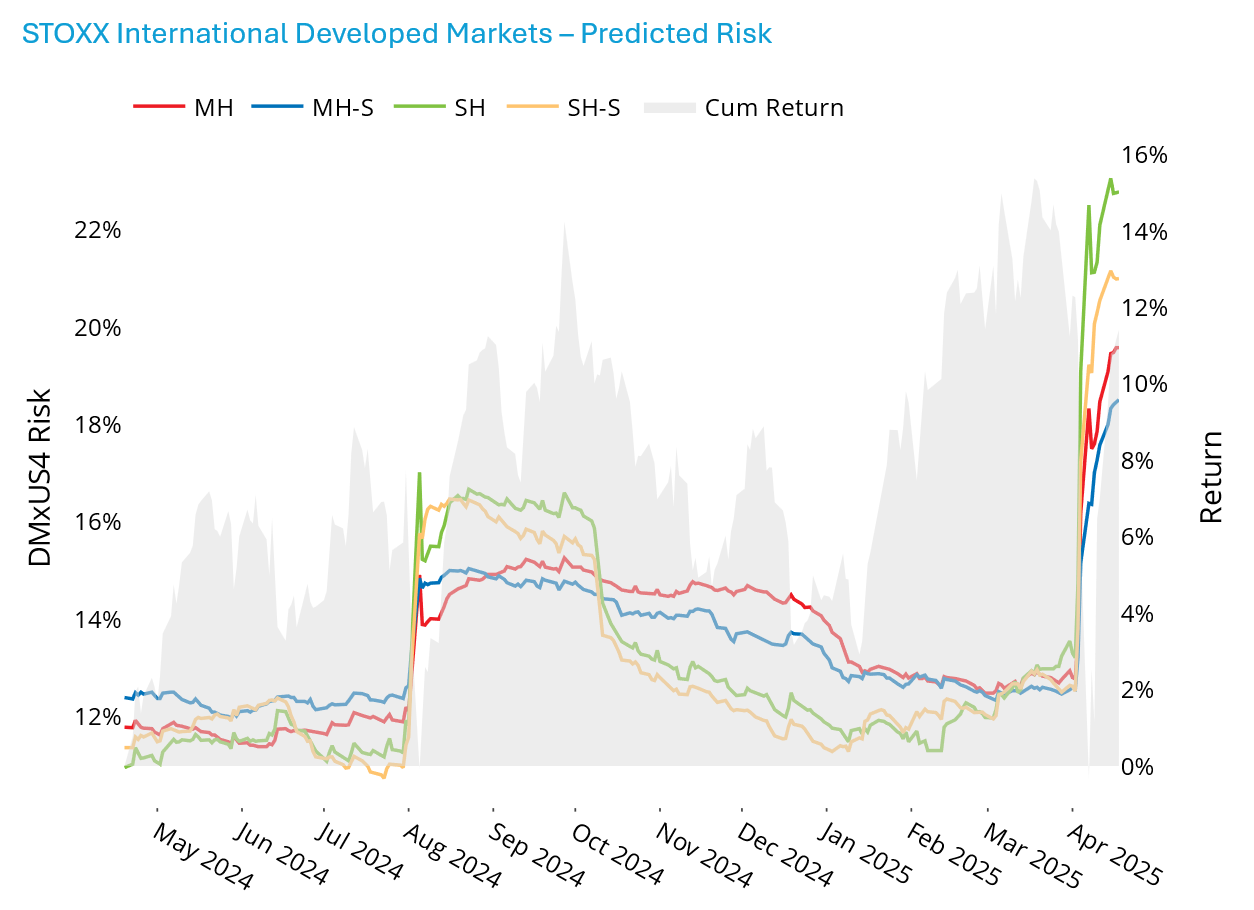
For the STOXX International Developed Markets Index, meant to represent a core portfolio of non-US developed markets stocks, short-horizon fundamental risk did not tick down, although at 22.8% it remains lower than what we see in the US. While non-US markets are clearly not immune to the current turmoil, they have seen a slightly smaller impact, with risk roughly double the low of the last 12 months, vs. an increase of about 2.6 times for the US.
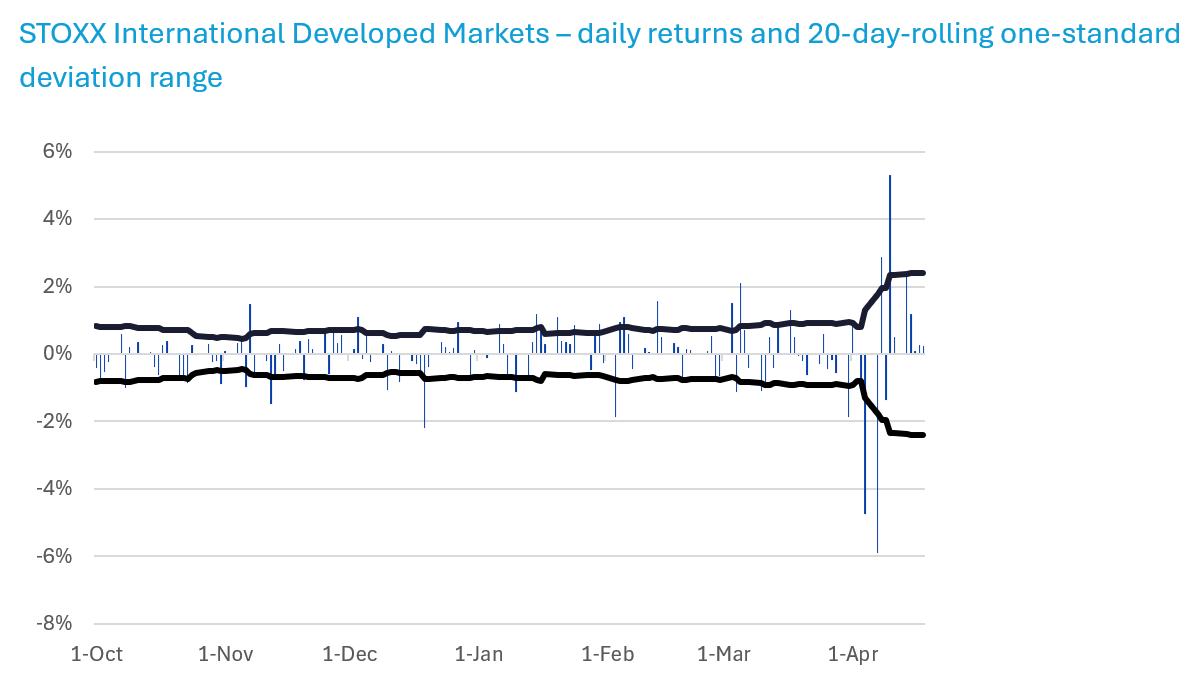
The absolute value of daily returns for the DMxUSindex averaged 66 basis points since 2018 and 215 bps since April 3. While we noted above that US daily volatility came back down to average levels over the most recent seven days, that was not the case for DMxUS, where daily market moves, while all positive since April 10, were still larger than average in magnitude.
See graph from the STOXX International Developed Markets Equity Risk Monitor as of April 17, 2025
The following chart does not appear in the risk monitors but is available on request
High equity volatility is reflected in outsized factor performance
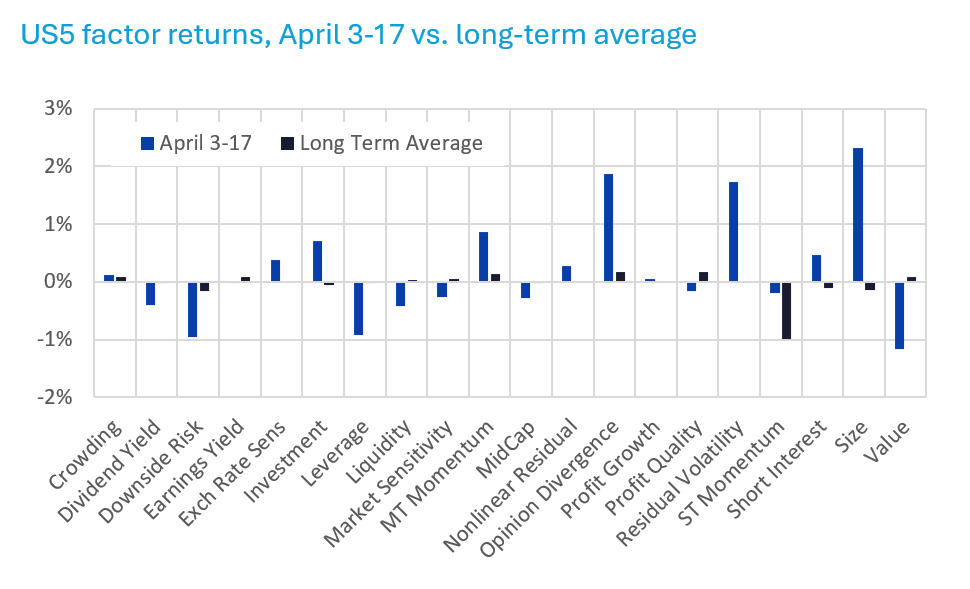
The heightened market volatility since April 3 has also been reflected in a higher-than-average magnitude of factor returns, although the direction of return for most factors was the same as the long-term average, which should provide some comfort to factor-based managers.
For the US5 model, only a few factors’ returns were in line with the average 11-day return since the model’s inception.
The biggest differences (risk-adjusted) in recent returns versus long-term averages can be seen in Investment and Size, where the strongly positive return runs counter to the negative average (note that the return to Size was quite negative in the most recent three days).
The return to Medium-Term Momentum was positive, as expected, but Value (price/book) has produced a highly disappointing negative return, suggesting investors may be expecting book-value writedowns – especially since they are not punishing Earnings Yield to nearly the same degree. The negative return to Value may also reflect the high exposure of Energy to the factor, which we discuss in more detail below. Oil prices, and Energy stocks along with them have plummeted as expectations of a global slowdown have increased.
The return to Leverage has been negative almost every day since April 3 as investors anticipate higher inflation and higher interest rates.
Downside Risk has produced negative returns, in contrast to Residual Volatility, which has seen a very positive return. The third volatility-related variable, Market Sensitivity (our beta-like factor), has been up and down with the market, with an overall return that is just slightly negative. It looks as if investors are shunning the names with the biggest potential for loss, while still looking for more idiosyncratic volatility.
The following chart does not appear in the risk monitors but is available on request
Energy and Technology style exposures have changed
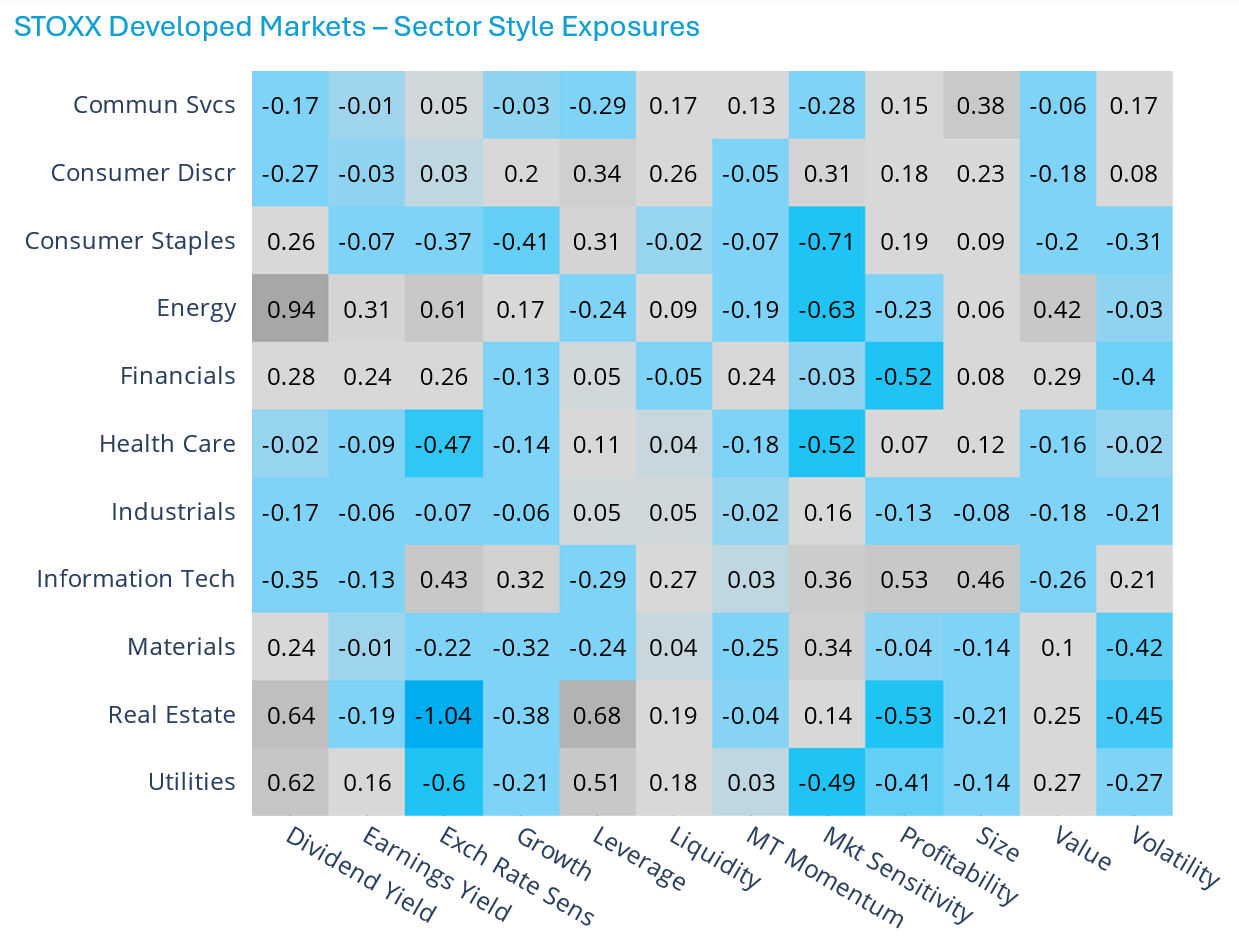
As noted above, one reason for Value’s weakness may be related to the decline in Energy stocks’ fortunes. More broadly, sector factor exposures – and how they are changing can help explain portfolio performance, especially for style-based portfolios.
As we have observed a shift in momentum recently, we have also seen a substantial change in sectors’ exposure to Medium-Term Momentum according to the Axioma Worldwide (WW4) model, with sectors drawn from the STOXX Global Developed Markets Index.
As some of the biggest Tech stocks have faltered, the sector’s exposure to Medium-Term Momentum fell from 0.35 at the end of 2024 to a barely-positive 0.03 currently, a much bigger decline than we have seen for any other sector. At the same time, the Momentum exposure for Health Care increased 0.31 to -0.18, far less negative than it was at the beginning of this year. Real Estate’s exposure increased a similar amount, to a roughly neutral exposure currently.
And as the US dollar has weakened this year there have also been some changes in sectors’ exposures to Exchange Rate Sensitivity. Most notable is again in Info Tech. While the exposure is still positive (meaning that Tech companies are very sensitive to changes in their home currency relative to a basket of currencies), that sensitivity fell substantially, which may be a positive given the renewed volatility of many developed market currencies.
Most other sector style exposure changes since year-end are small.
See graph from the STOXX Developed Markets Equity Risk Monitor as of April 17, 2025
The following chart does not appear in the risk monitors but is available on request
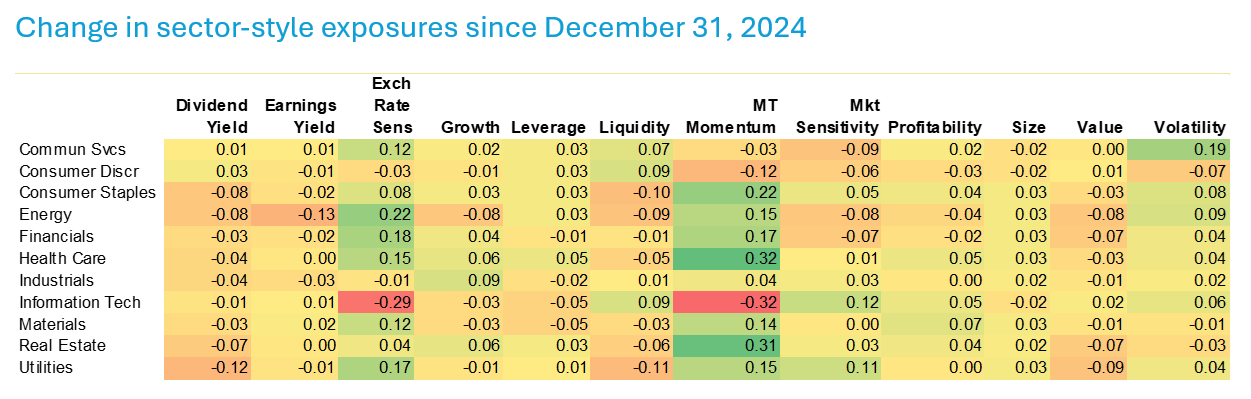
Source: Axioma WW4 model and STOXX Global Developed Markets Index
You may also like


