

EQUITY RISK MONITOR HIGHLIGHTS
WEEK ENDED JUNE 27, 2025
- US markets were strong last week, although not all hit new highs
- Factor Returns: Investors in US stocks strongly prefer higher risk and larger market cap…
- …and so large and high-beta Technology leads the way
US markets were strong last week, although not all hit new highs
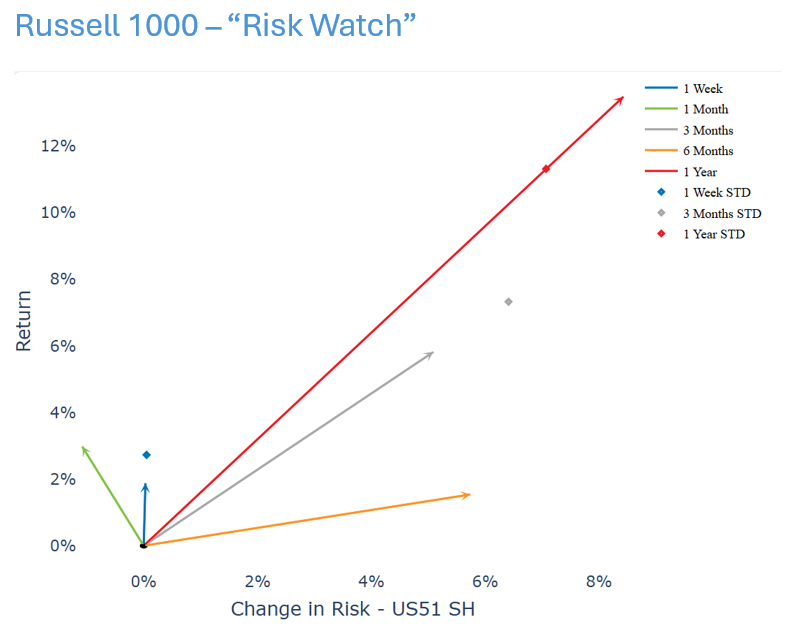
On June 27th, the S&P 500 closed at an all-time high of 6,173.07, eclipsing the index’s pre-Liberation Day peak back on February 19th. While the Russell 1000 benchmark we typically use alongside our US5.1 Risk Model has not quite returned to its previous level, that index similarly reflected last week’s positive investor sentiment with a 2.45% return and 33bp week over week decrease in predicted risk . The weekly return was strong, but the magnitude was still within the beginning of period expectation.
See chart from the Russell 1000 – US5 equity risk monitor of June 20, 2025
News seemingly drove markets last week—namely de-escalation between Iran and Israel, which in turn eased fears of elevated oil prices. Additionally, investors looked ahead to the Fed’s July meeting and priced in an increased chance of a cut after Fed governor Michelle Bowman became the second member of the 12 person committee to support looser monetary policy.
Factor Returns: Investors in US stocks strongly prefer higher risk and larger market cap
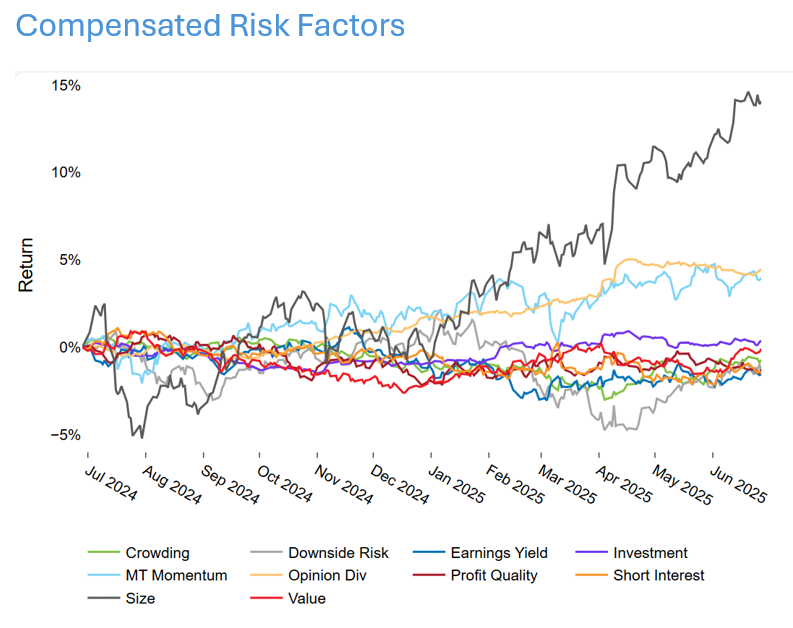
Since Liberation Day, markets have rallied, but what kinds of names are investors buying? Or, framed in risk model terms, what kinds of factors are getting bid up? The top three factors by return in our US5.1 model are Market Sensitivity, Size, and Residual Volatility.
See cumulative factor return charts from the Russell 1000 – US5 equity risk monitor of June 27, 2025
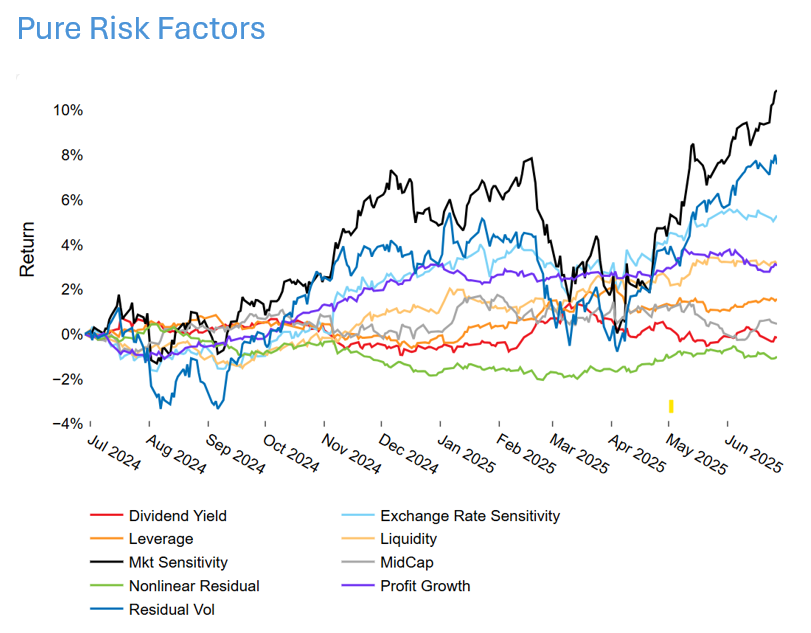
In order to interpret the factor returns, we have to remember how the factors are constructed: Market Sensitivity is long high-Beta names and short low-Beta names, and Size bets on high market value names and bets against low market value names. The Residual Volatility factor is somewhat complicated since it’s orthogonalized to both the Market Sensitivity and Downside Risk factors, but we generally think of this as “good” volatility and Downside Risk as “bad” volatility. As a result, the Residual Volatility cannot be observed in isolation, and we should consider both the “good” and “bad” volatility factors together. The combined factor return no longer looks quite as positive as Market Sensitivity and Size.
Over the long term, the return to Market Sensitivity is roughly zero, meaning there is no long-term risk premium associated with the factor. In contrast, long-term return to the Size factor is negative on average. As discussed above, the factor returns during our observed period were not only large, but they were much larger than expected, and the Size factor returns are strongly positive despite having a negative expectation. In fact, Market Sensitivity’s 3-month return is more than 2.5 standard deviations away from the short-horizon risk forecast at the beginning of the period. Likewise, the Size factor’s return is almost two standard deviations away from the forecast. These are among the highest volatility factors in the model, which we discuss below.
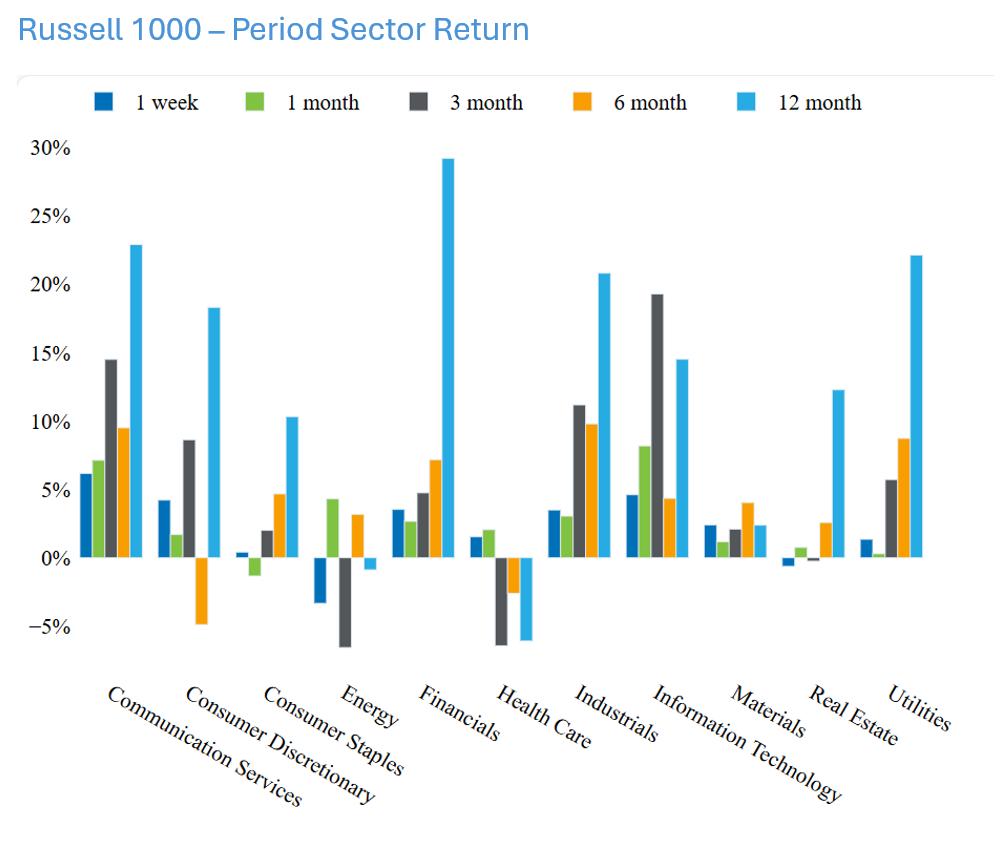
Large and high-Beta: Technology also leads the way in sector returns
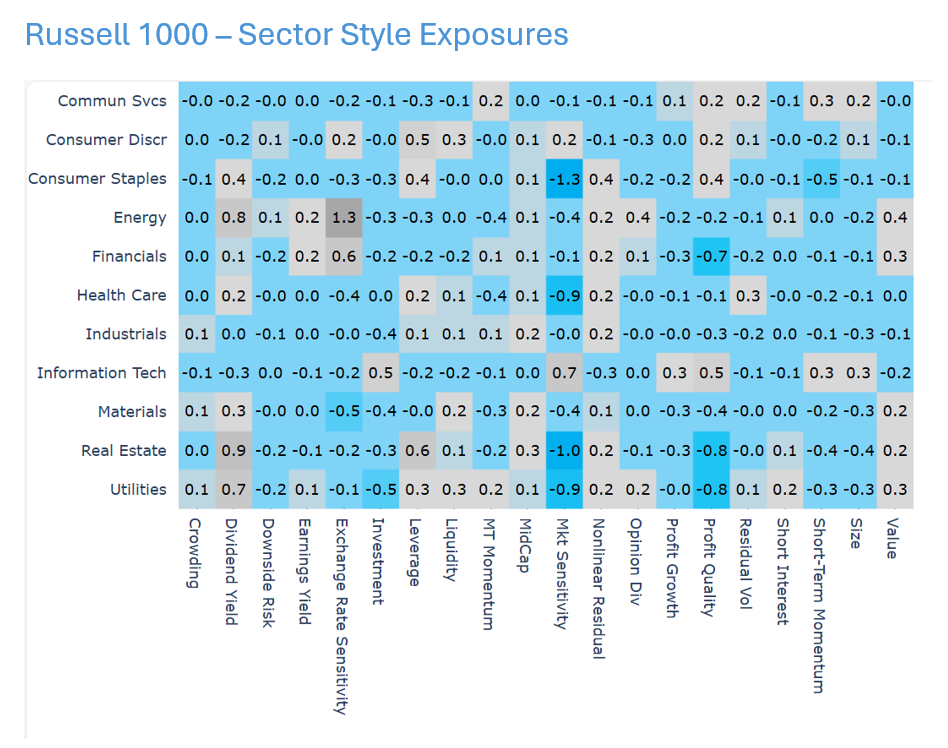
Taking a look at factor exposures by sector, we see that Information Tech has the greatest exposure to both Market Sensitivity and Size. This observation is unsurprising given investors’ interest in AI and “Mega Cap” Technology names. However, those factors also have a short side. The low-Beta sectors are Consumer Staples, Health Care, Real Estate, and Utilities. In contrast, the magnitudes of the Size factor exposures by sector are smaller overall, but the relatively small cap sectors are Industrials, Materials, Real Estate, and Utilities.
See chart from the Russell 1000 – US5 equity risk monitor of June 20, 2025
Factor returns are not necessarily the primary driver in sector level aggregate returns, but over the past month, we see an overlap with the Beta exposures. Information Technology is the top sector by Market Sensitivity and also the top performer overall, and our bottom two sectors by Market Sensitivity are also the bottom two sectors by performance. While this observation may be coincidental, it hopefully provides a useful lens to view the “Magnificent 7” and AI narratives seeking to explain year to date returns.
See chart from the Russell 1000 – US5 equity risk monitor of June 20, 2025
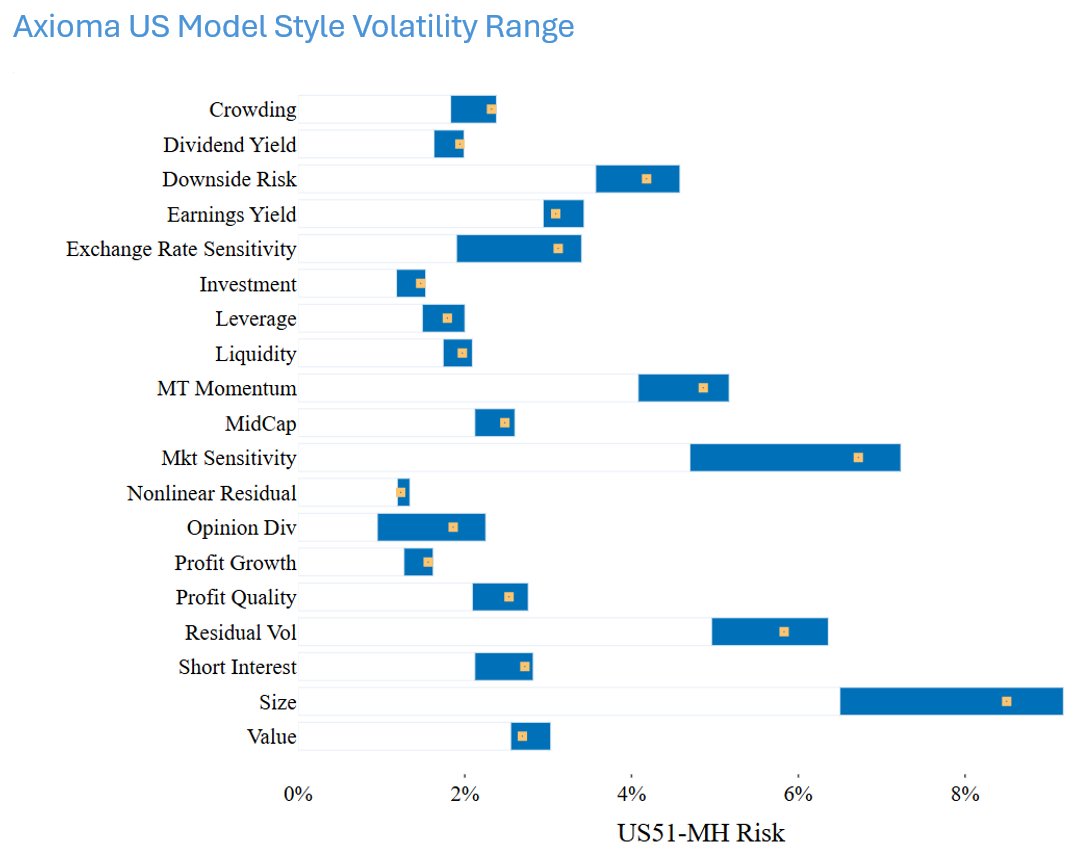
Will this trend continue? Over the last year, the two most volatile factors were Size and Market Sensitivity. Since Liberation Day, investors have been positively compensated for taking on the risk associated with these factors, but recent history shows us that there is significant Style risk associated with these factor returns. Managing the exposure to Market Sensitivity and Size will be key to reducing drawdown looking forward to the exogenous shock.
See chart from the Russell 1000 – US5 equity risk monitor of June 20, 2025
You may also like


