
Axioma ROOF™ Score Highlights
WEEK OF APRIL 15, 2024
Potential triggers for sentiment-driven market moves this week:*
- US: Manufacturing and Services PMI data, factory orders, and the Jobs report on Friday.
- Europe: Key inflation reports for the Eurozone, Germany, France, Italy, and Spain. Retail sales for the Eurozone, factory orders for Germany, and France’s industrial production data.
- APAC: PMI data for China. Japan’s Tankan report.
- Global: The focus will remain on geopolitical risk which has an uncomfortable habit of bobbing back to the surface, and occasionally breaking above it.
* If sentiment is bearish/bullish, a negative/positive surprise on these data releases could trigger an overreaction.
Insights from last week’s changes in investor sentiment:
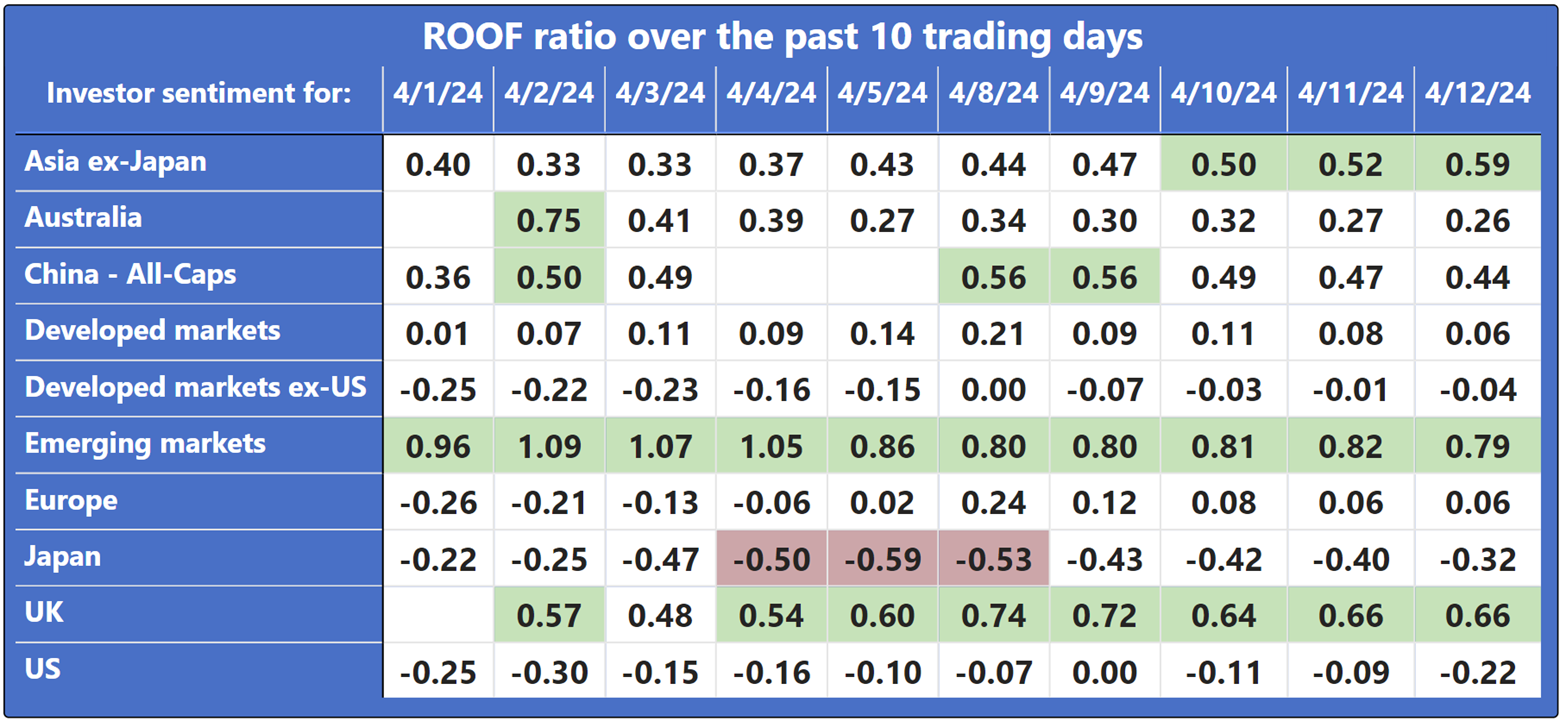
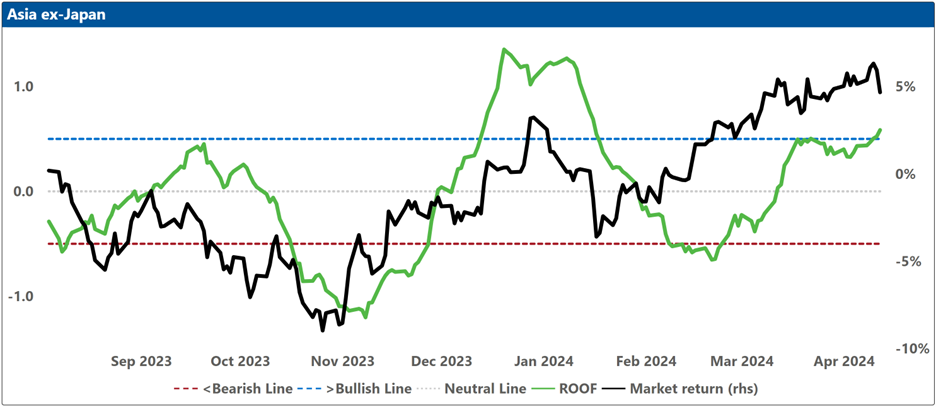
Investor sentiment ended last week unchanged across all the markets we follow except in Asia ex-Japan where sentiment turned bullish from positive the previous week.
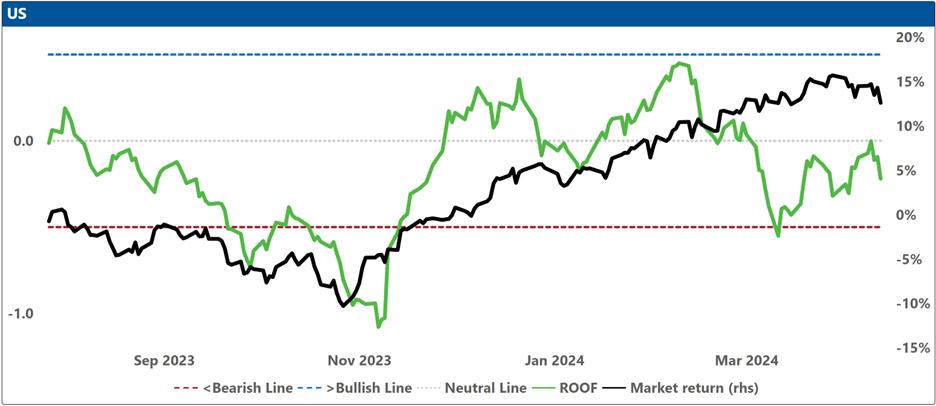
Sentiment was bullish in Global Emerging Markets and Australia, positive in the UK, China, and Asia ex-Japan, neutral in Japan, Global Developed, and Global Developed ex-US markets, and negative in Europe and the US.
The release of the US February personal spending data, which showed the largest increase since January 2023, coincided with a statement by Federal Reserve Chair Jerome Powell that the central bank was in no hurry to start cutting interest rates. Despite the low volatility at the beginning of the year, the decreasing ROOF scores since mid-February suggest that investors are cautiously preparing for the possibility of higher-for-longer interest rates by slowly moving to the more risk-averse segment of the market. Additionally, the “Magnificent-7” escalator that carried the US market to successive record highs this year seems to have jerked, then stopped.
Since the rallies began in late October of the previous year, the US and European markets have seen significant gains, with 28% and 20% returns, respectively. This leaves ample room for profit-taking should there be any disappointments in the timing or number of anticipated interest rate cuts. Investors are remembering that historically, bad decisions are made during good times, and have become suspicious of the current low volatility readings, which helps explain the divergence we see between market performance and investor sentiment in these markets since early March. For the coming week, sentiment should remain range bound as investors await the beginning of the first-quarter earnings reporting season later this month. Given that economic data for January and February did not match the “goldilocks” expectations of a slowing economy needing monetary policy assistance set at the year’s start, investors are likely to remain cautious ahead of the March inflation data to be released next week.
Changes to investor sentiment over the past 180 days for the markets we follow:
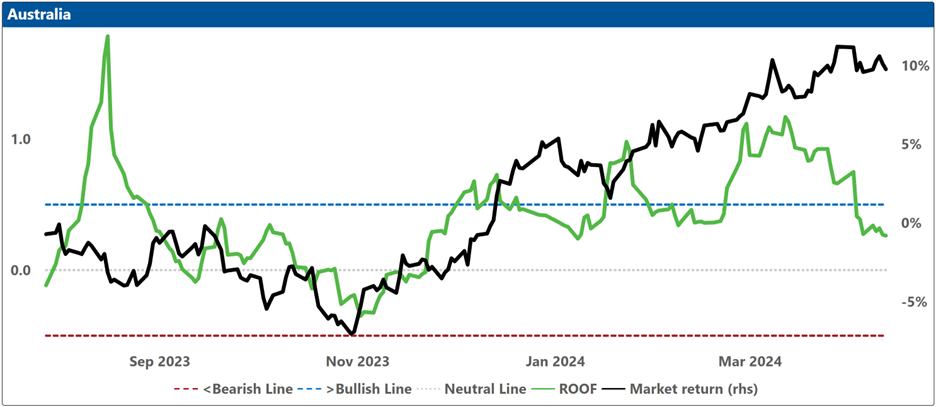
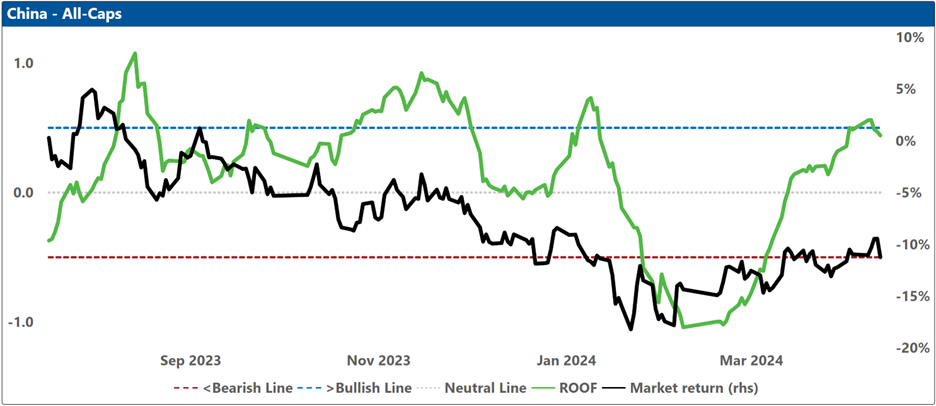
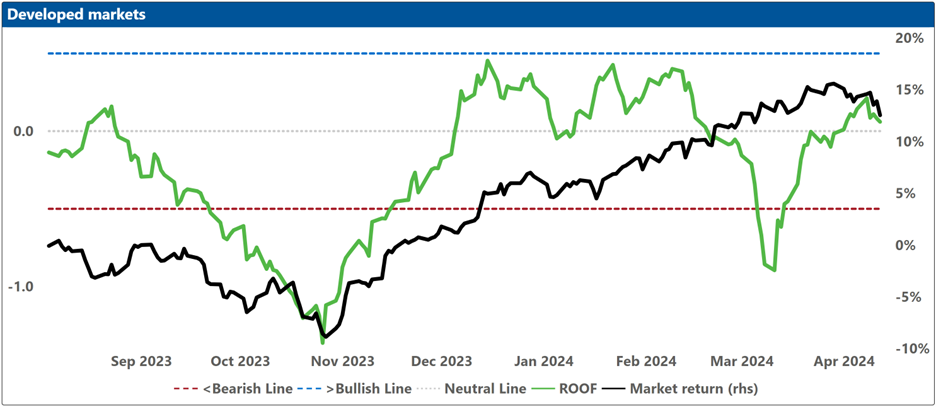
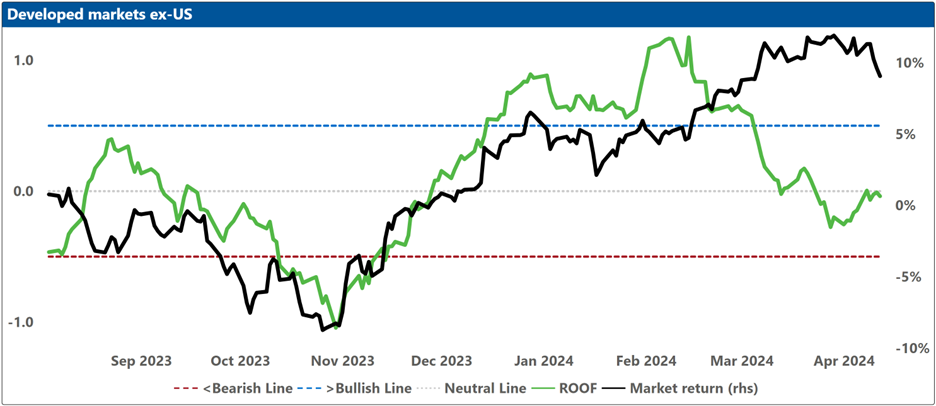
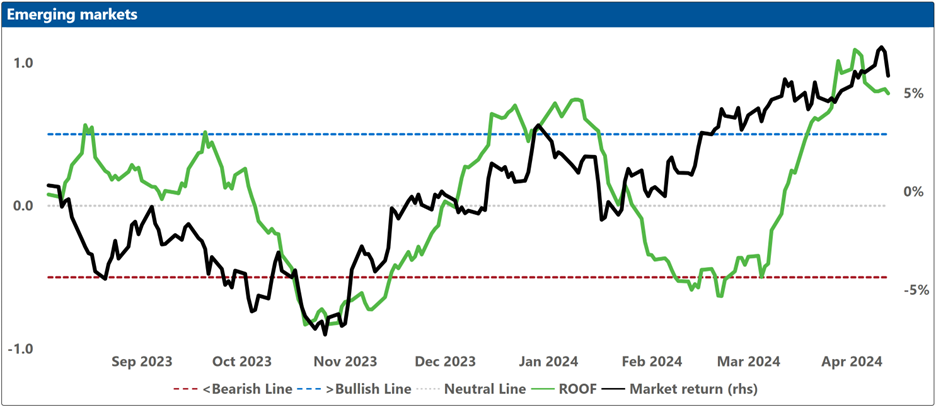
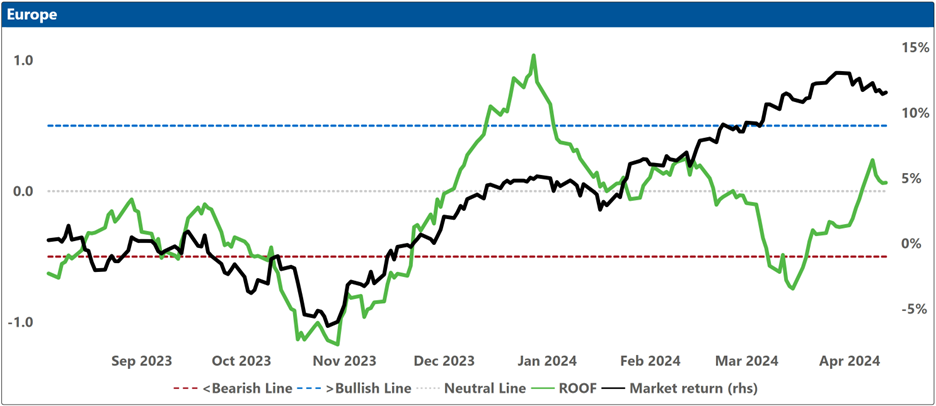
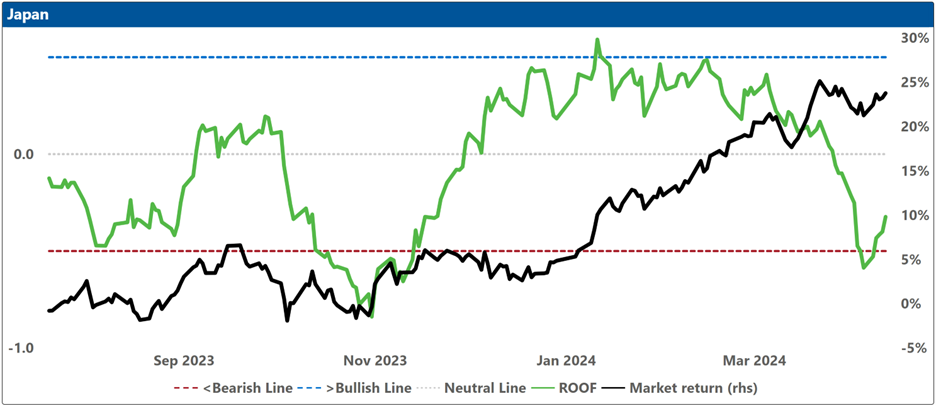
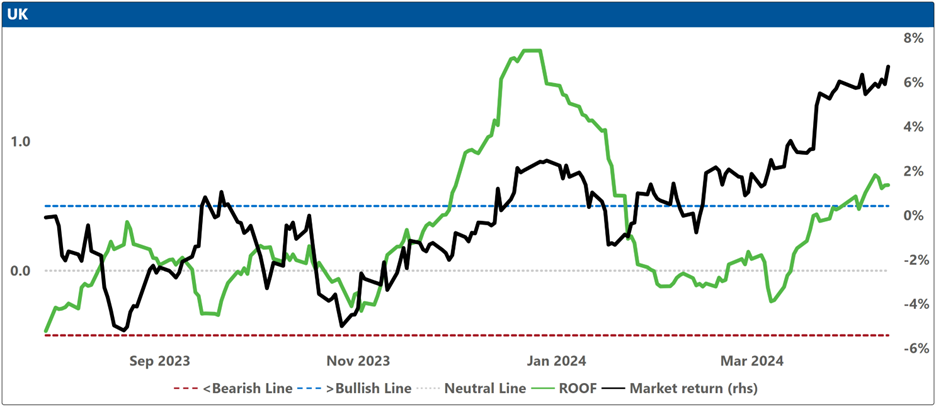
How to read these charts: The top charts show the ROOF ratio (investor sentiment) in green (left axis), against the cumulative returns of the underlying market in black (right axis). The horizontal red line at -0.5 (left axis) represents the frontier between a negative sentiment (-0.2 to -0.5) and a bearish one (<-0.5), and the horizontal blue line at +0.5 (left axis) represents the frontier between a positive sentiment (+0.2 to +0.5) and a bullish one (>+0.5). Around the horizontal grey line at 0.0 (left axis), sentiment can be considered neutral (-0.2 to +0.2).
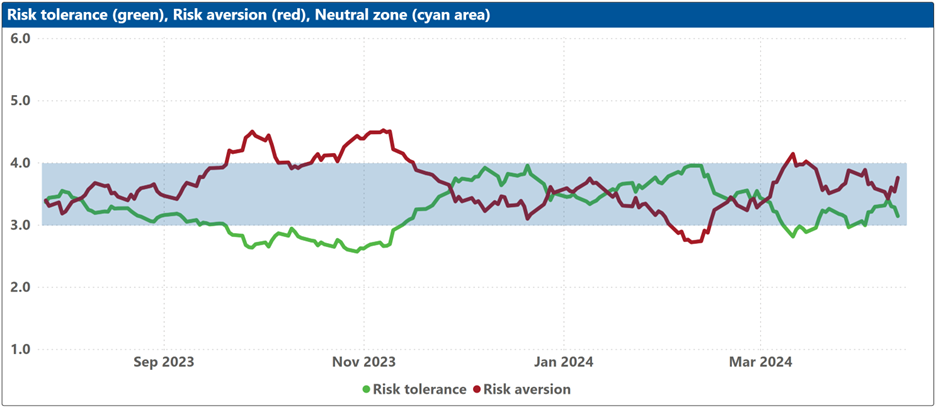
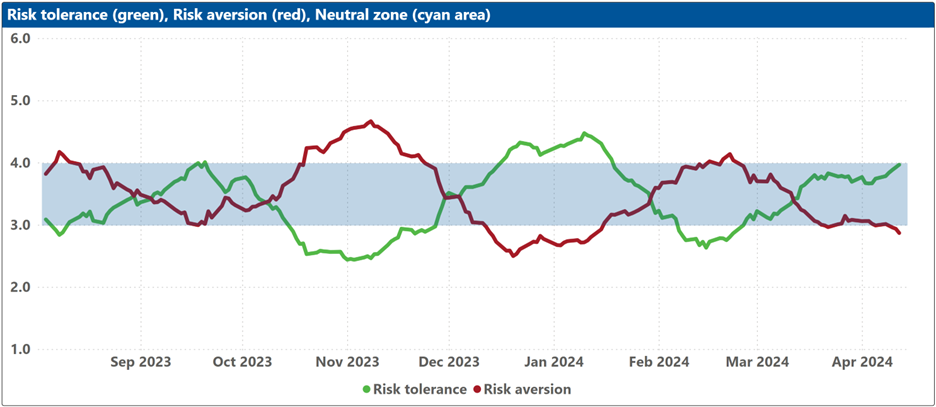
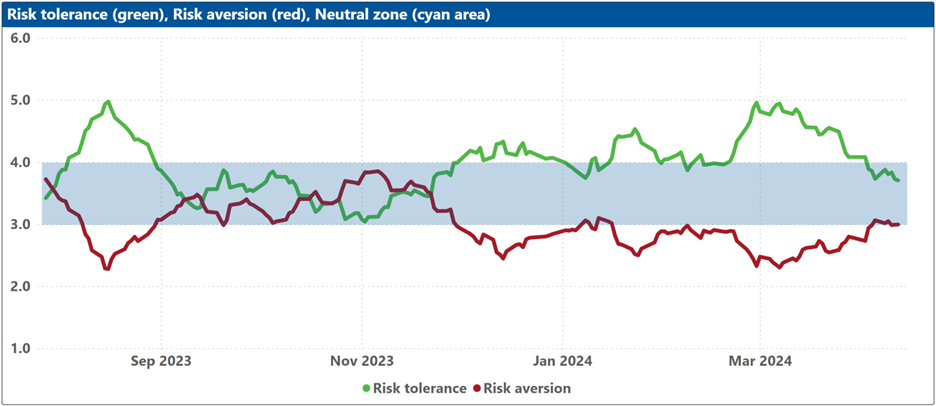
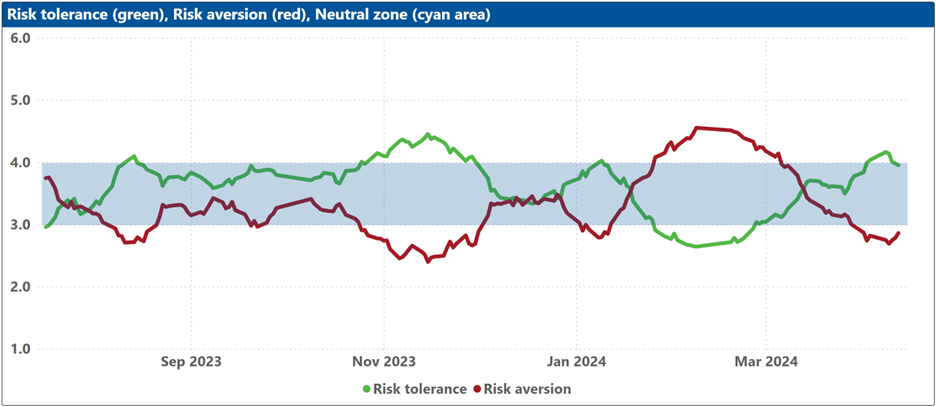
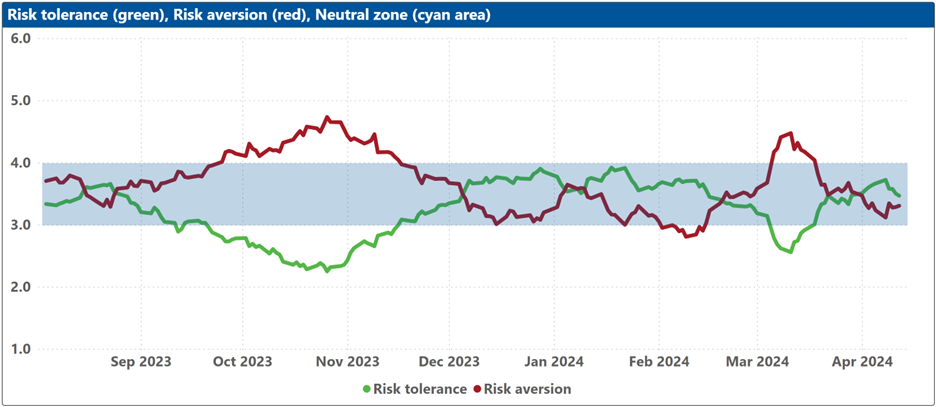
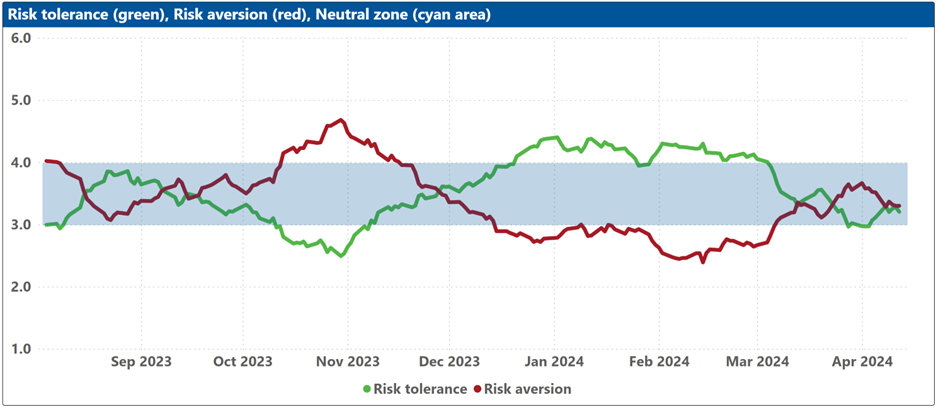
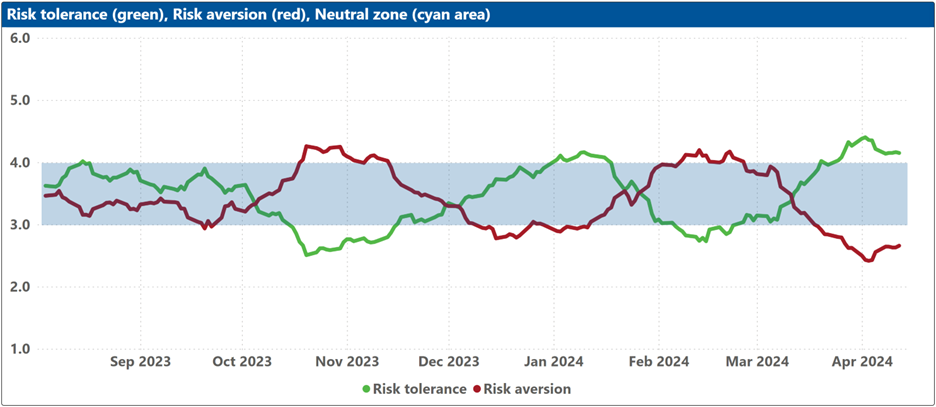
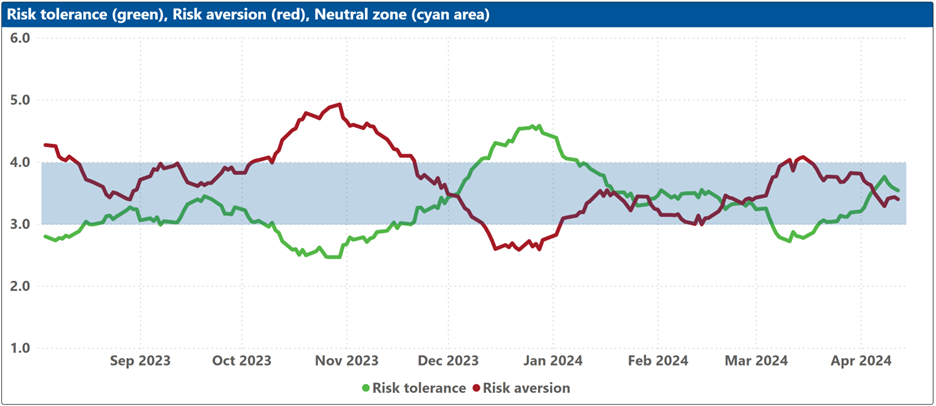
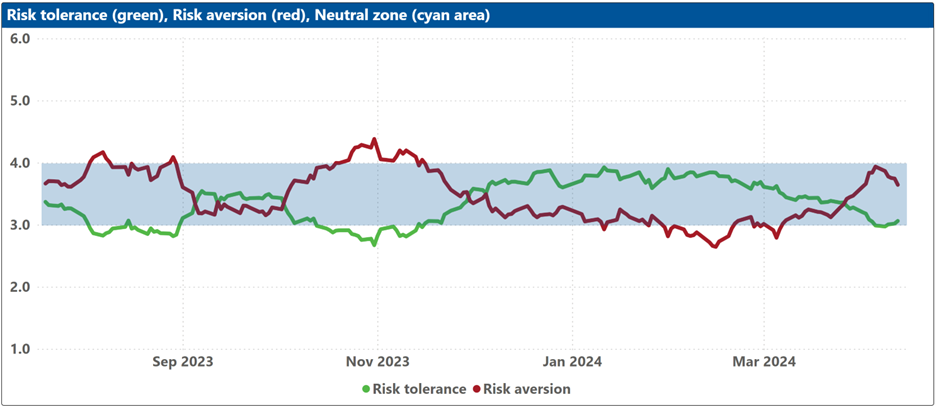
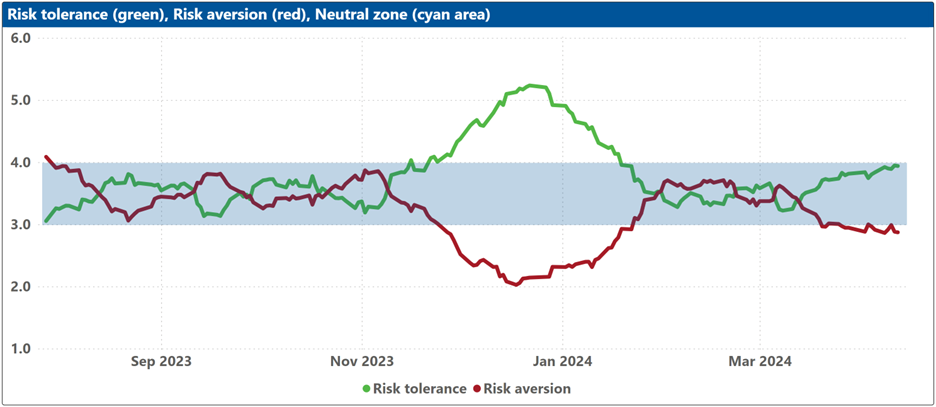
The bottom charts show the levels of both risk tolerance (green line) and risk aversion (red line) in the market. These represent investors’ demand and supply for risk. When risk tolerance (green line) is higher than risk aversion (red line), there are more investors looking to buy risk assets then investors willing to sell them (at the current price), forcing risk-tolerant investors to offer a premium to entice more risk-averse counterparts to take the other side of their trade, which drives markets up. The reverse is true when risk aversion (red line) is higher than risk tolerance (green line). The net balance between risk tolerance and risk aversion levels is used to compute the ROOF ratio in the top charts, representing the sentiment of the average investor in the market.
The blue shaded zone between levels 3-4 for both indicators represents a reasonable balance between the supply and demand for risk in the market. Conversely, when both lines are outside of this blue zone, the large imbalance in the demand and supply for risk can lead to an overreaction to unexpected news or risk events.
Asia ex-Japan
Australia
China
Developed markets
Developed markets ex-US
Emerging markets
Europe
Japan
UK
US