EQUITY RISK MONITOR HIGHLIGHTS
WEEK ENDED APRIL 19, 2024
- Despite market’s decline, contribution of big Tech meant fundamental risk remained steady and statistical risk fell
- Value’s strong performance builds on three positive years
- European Real Estate sector differs widely from the sector in other developed markets
Despite market’s decline, contribution of big Tech meant fundamental risk remained steady and statistical risk fell
By most measures April 2024 has been a tough month for equities so far. The STOXX® US Index is down almost 5.5%, the worst month of returns since December 2022. The market fell in 11 of the 15 days of the month to date, and that 73% of down days compares quite unfavorably with the average of 45% of days in a month with negative returns since at least 2018. Also the run of six down days in a row through last Friday is the longest streak since October 2022.
Results for Developed Markets ex-US, as measured by the STOXX® International Developed Markets Index are similar: With a return of -4.5%, it has been the worst month since September 2022, the market was down in 10 of the 15 days (versus 47% of the days seeing negative returns on average), and the last succession of six or more down days (as the index experienced from the 10th through the 17th) was in August 2023.
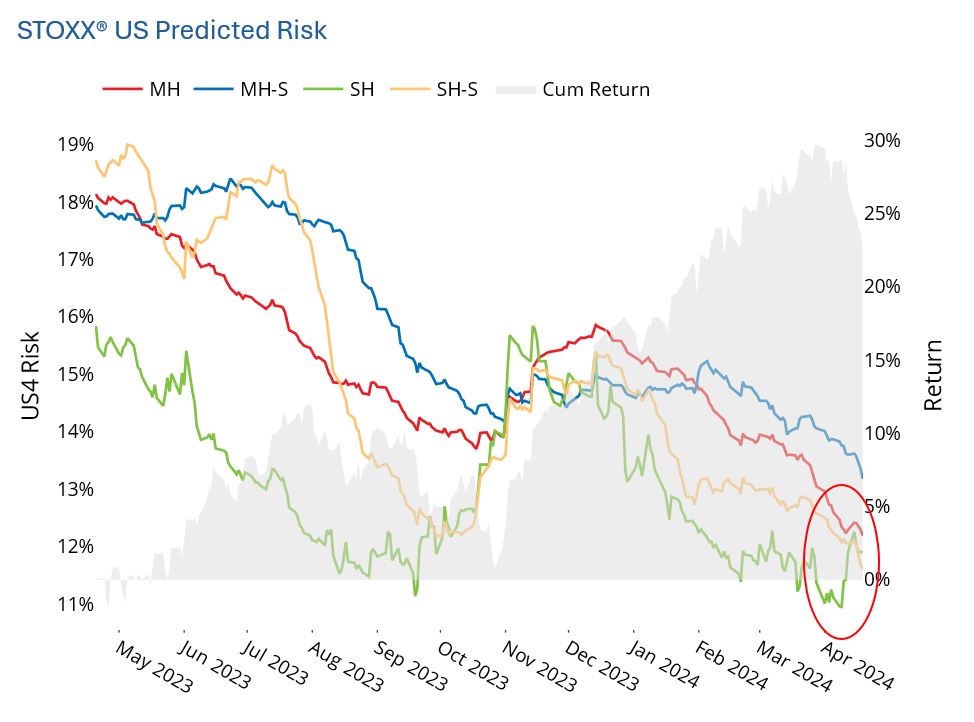
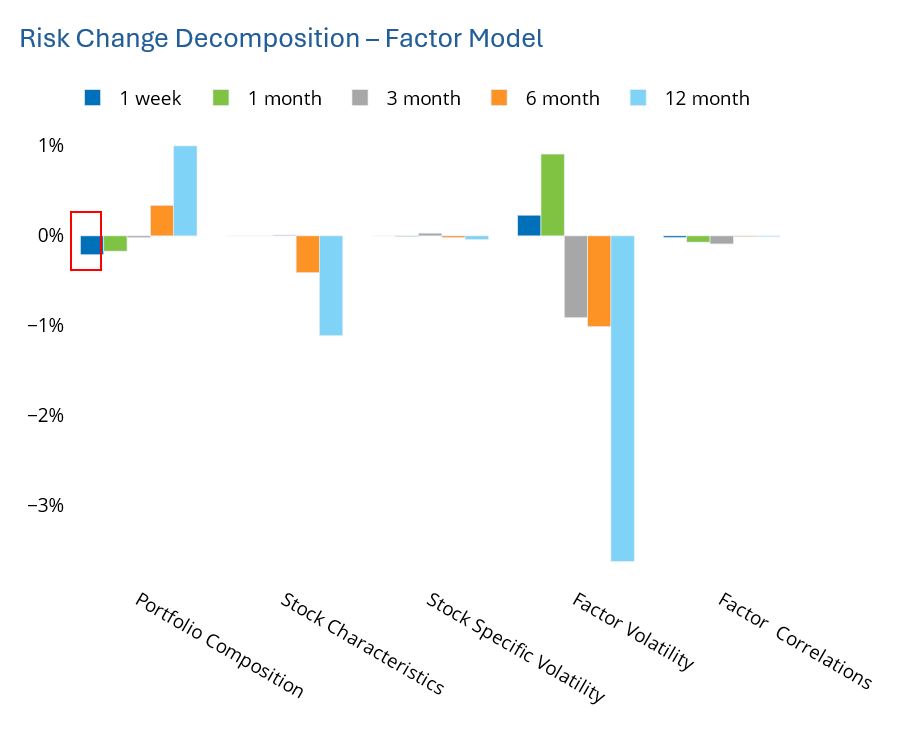
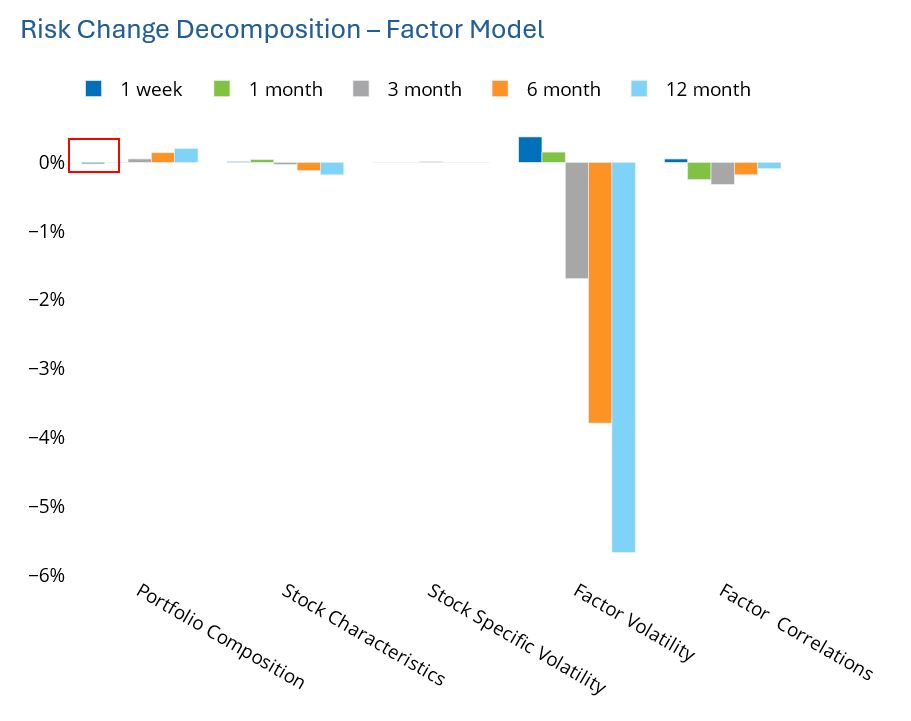
In last week’s Equity Highlights we noted the uptick in short-horizon predicted risk in the US. This week US risk flattened out, and the decomposition of the change in risk for the week shows something interesting — the portfolio composition component of the change in risk offset the increase in factor volatility. Many of the biggest, most volatile names were among the week’s biggest contributors to the price drop (most notably NVIDIA and Tesla). Declines in prices drove substantial changes in weight (NVDA lost more than 50 basis points). This, in turn, meant the composition of the index actually became less risky!
We also see that predicted risk according to the short-horizon statistical model in the US fell, likely also as a result of these weight shifts. In the past we have written about why these names drove statistical risk higher than fundamental, and we may be seeing that in reverse now.
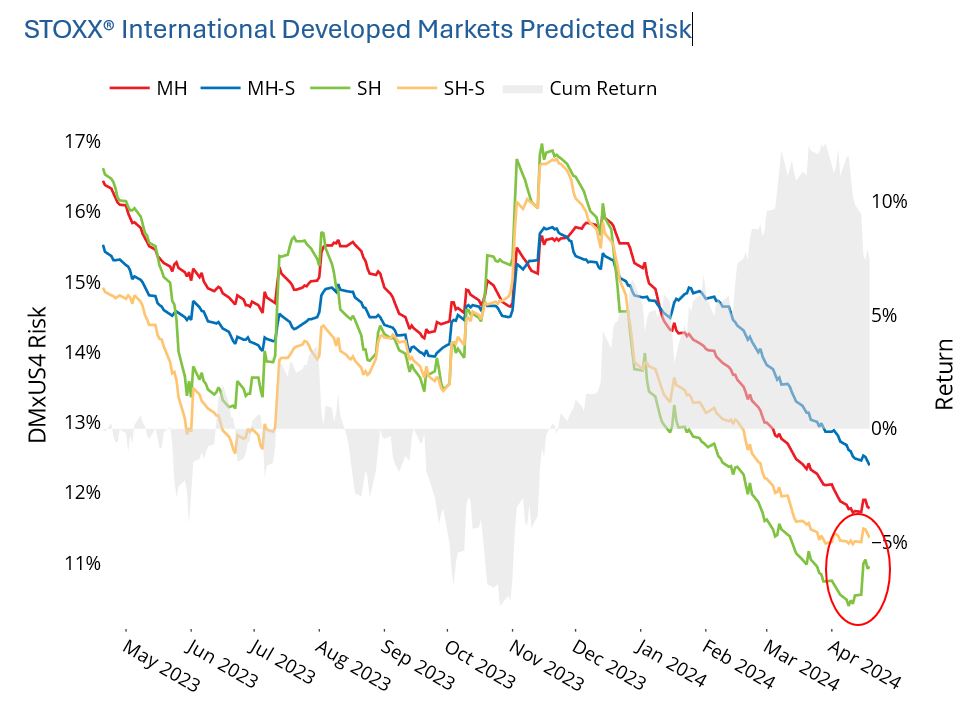
We do not see the same phenomenon of lower risk owing to portfolio composition offsetting the higher volatility outside the US , where short-horizon fundamental risk increased almost 4% proportionally last week and its statistical counterpart was largely unchanged.
See graphs from the STOXX US Equity Risk Monitor as of 19 April 2024:
See graphs from the STOXX International Developed Markets Equity Risk Monitor as of 19 April 2024:
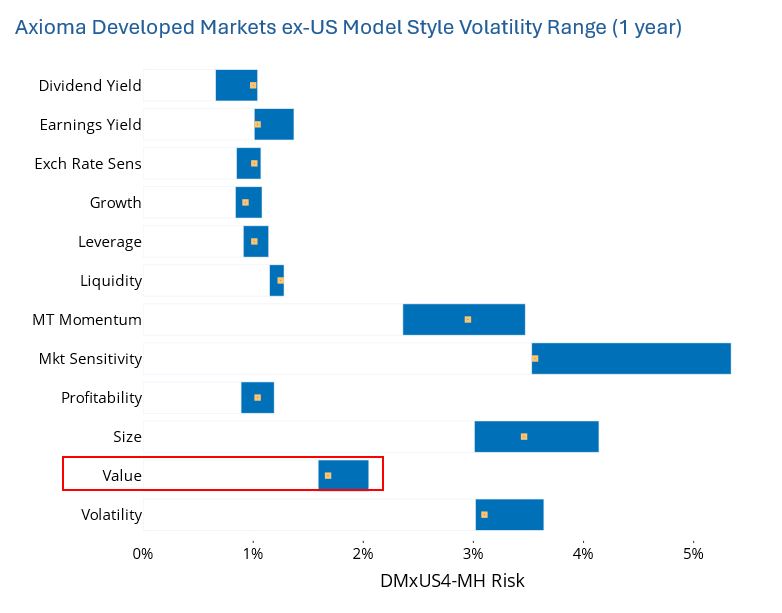
Value’s strong performance builds on three positive years
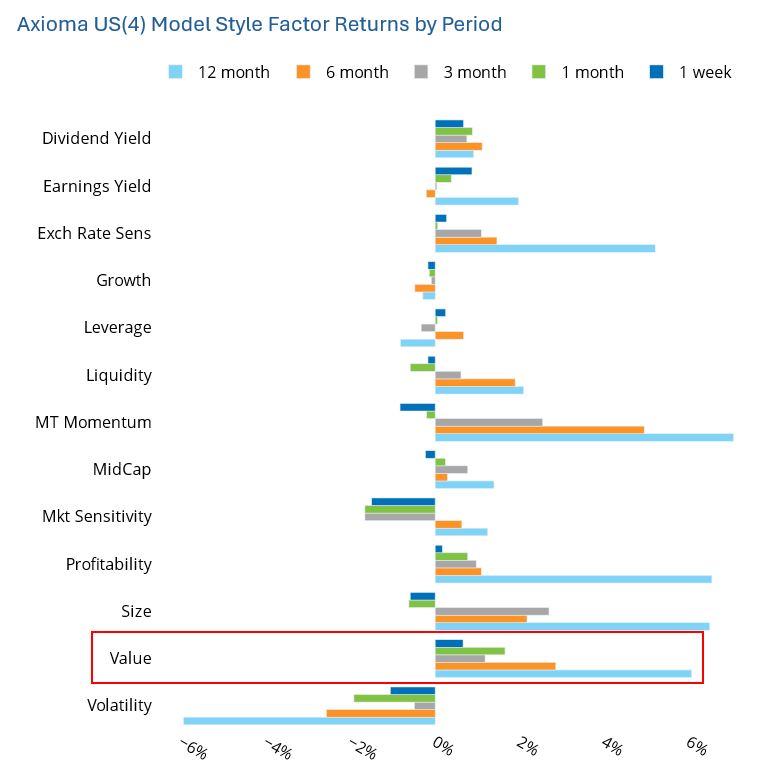
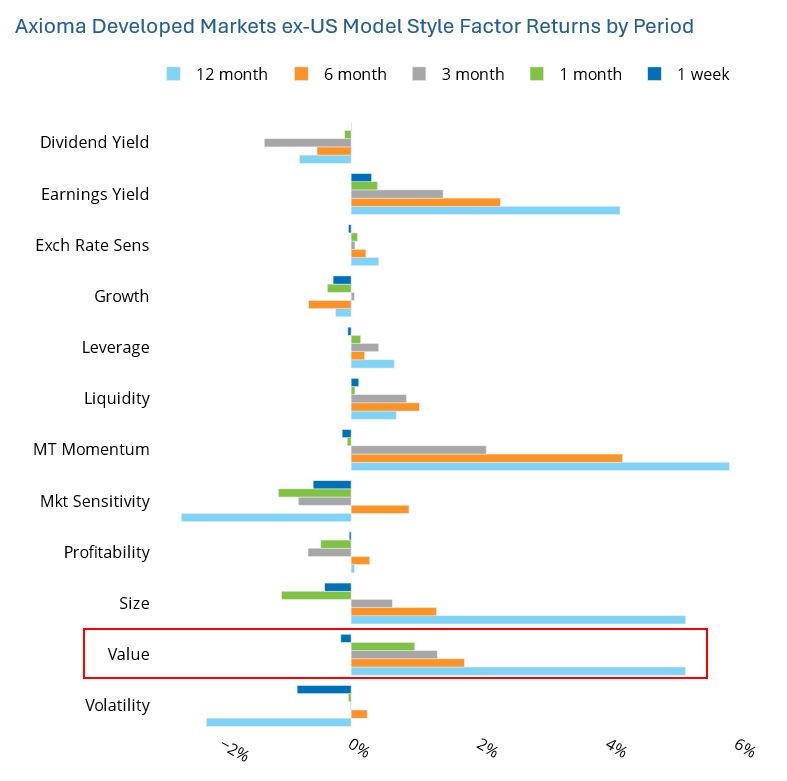
The performance of the Value factor (defined in the Axioma models as book/price) continued to be strong across most regions, with risk-adjusted monthly returns of more than 2.0 in the US (both all-cap and small-cap, in Axioma’s version 4 models) as well as in developed markets ex-US. Risk here is defined as the expected volatility at the beginning of the period. Value’s return in other regional models did not quite cross this threshold, but were positive, with the exception of Asia ex-Japan and Emerging Markets. The Value factor has now produced positive returns for about 3 ¼ years in the US and Developed ex-US models, suggesting reports of the factor’s demise were greatly exaggerated. The factor’s return has been only slightly higher outside the US compared with in the US.
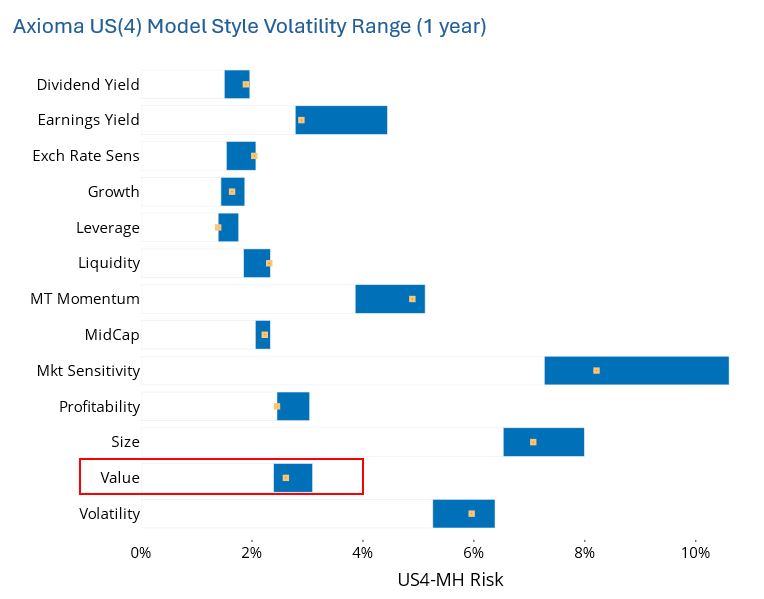
At the same time, the volatility of the factor remains near the low end of its 12-month range. Compared with longer-term history, however, the current volatility of US Value is relatively high, in the 72nd percentile. Outside the US the predicted volatility of Value is just about its long-term average.
See graphs from the STOXX US Equity Risk Monitor as of 19 April 2024:
See graphs from the STOXX International Developed Markets Equity Risk Monitor as of 19 April 2024:
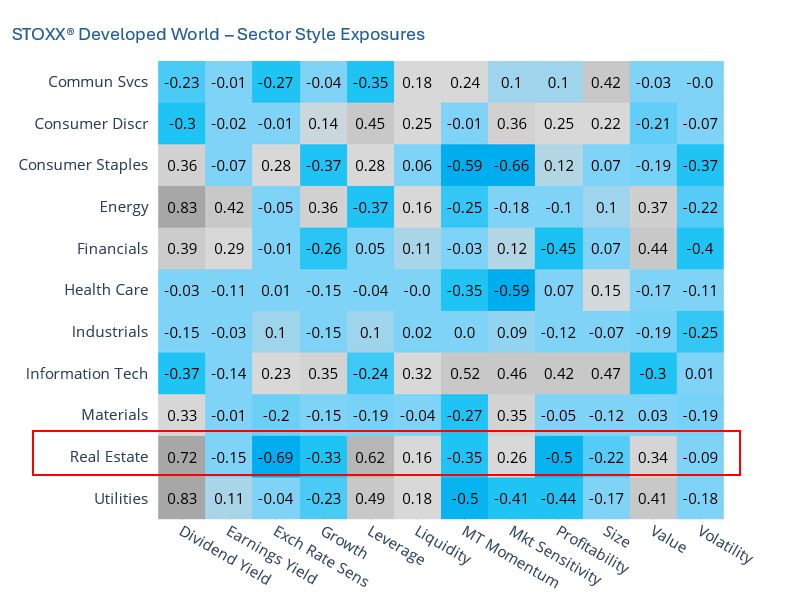
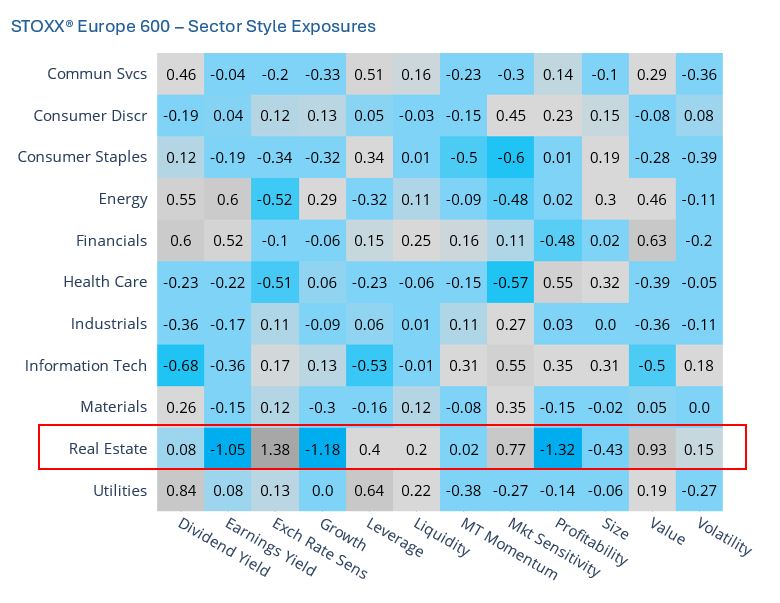
European Real Estate sector differs widely from the sector in other developed markets
European Real Estate shows substantial style factor exposures, and many of these exposures are much higher in magnitude from what we see in global developed markets or in other European sectors.
The exposure to the Profitability factor is highly negative, much more so than any other European sector and suggesting that Real Estate companies are far less profitable than their counterparts. While the exposure of the sector in Global Developed Markets is also negative it is far less so, and other sectors such as Financials and Utilities have similar exposures.
In contrast to its Profitability exposure, the European Real Estate sector stands out with a highly positive exposure to Value (book/price) but a negative exposure to Earnings Yield. In both cases the magnitude is substantially higher than in other European sectors as well as compared with Global Real Estate. This may suggest that book values for these companies are (artificially) high whereas earnings are low or negative, as might be expected in a shaky property environment.
Finally, the sector has much higher exposure to the Exchange Rate Sensitivity (ERS) factor than any other sector. The highly positive exposure, which is a time series-based regression of asset returns in local currency versus a basket of currencies, suggests that the sector will fare well when the euro is strong (of course results are likely to vary by country), or at least that has been the case over the past few years. Globally, the sector’s exposure to ERS is negative, meaning that stocks in that sector should do better when their home country currency is weaker.
See graph from the STOXX Europe 600 Risk Monitor as of 19 April 2024:
See graph from the STOXX Developed World Risk Monitor as of 19 April 2024: