EQUITY RISK MONITOR HIGHLIGHTS
WEEK ENDED MAY 17, 2024
- Meme stocks hit US Momentum return
- European Financials’ weight has increased substantially, while its contribution to risk has fallen
- Developed Markets loss in trading volume may be Emerging Markets’ gain
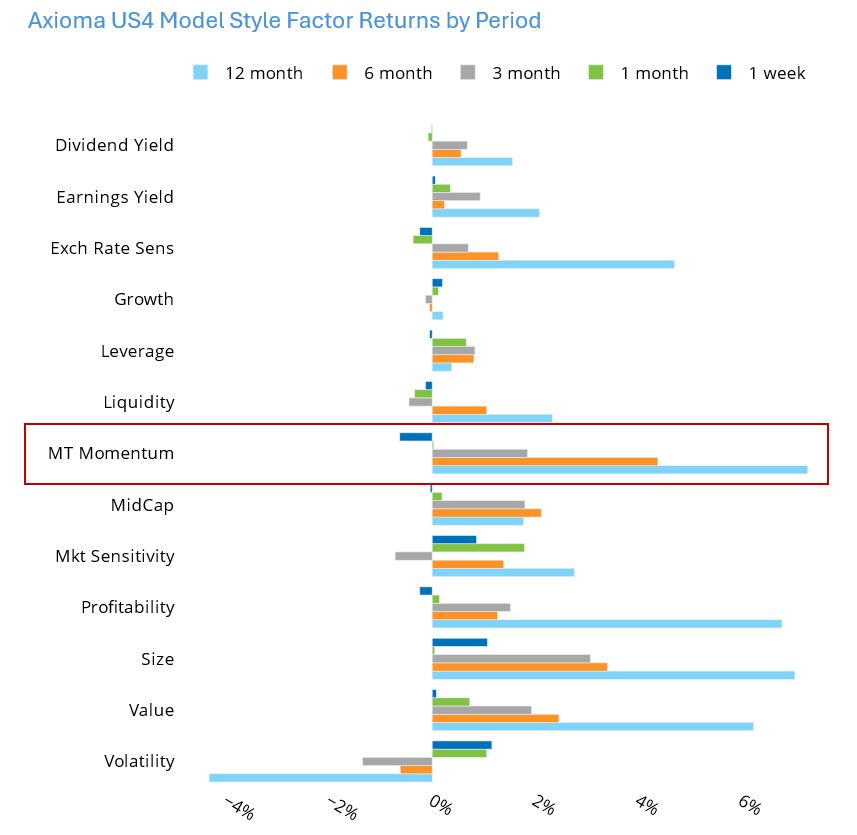
Meme stocks hit US Momentum return
Medium-Term Momentum in the US (according to the Axioma US4 medium-horizon fundamental model) has had a good run this year, but turned in disappointing performance in the last week. The drawdown, in part, could be traced to the recent uptick in “meme” stocks. They have tended to be on the short side of the Momentum factor-mimicking portfolio and although their weights are generally small their substantial returns caused a drag on the overall factor return. In fact, the five-day factor return ending Friday, May 17 was in the bottom decile of five-day returns since the inception of the model.
Still, Momentum has seen the highest return (both most positive and highest in magnitude) across all US4 model factors over the past 12 months. Momentum’s one-year return in other regional and global models has also been among the highest of all factors, and it did not stumble as much last week.
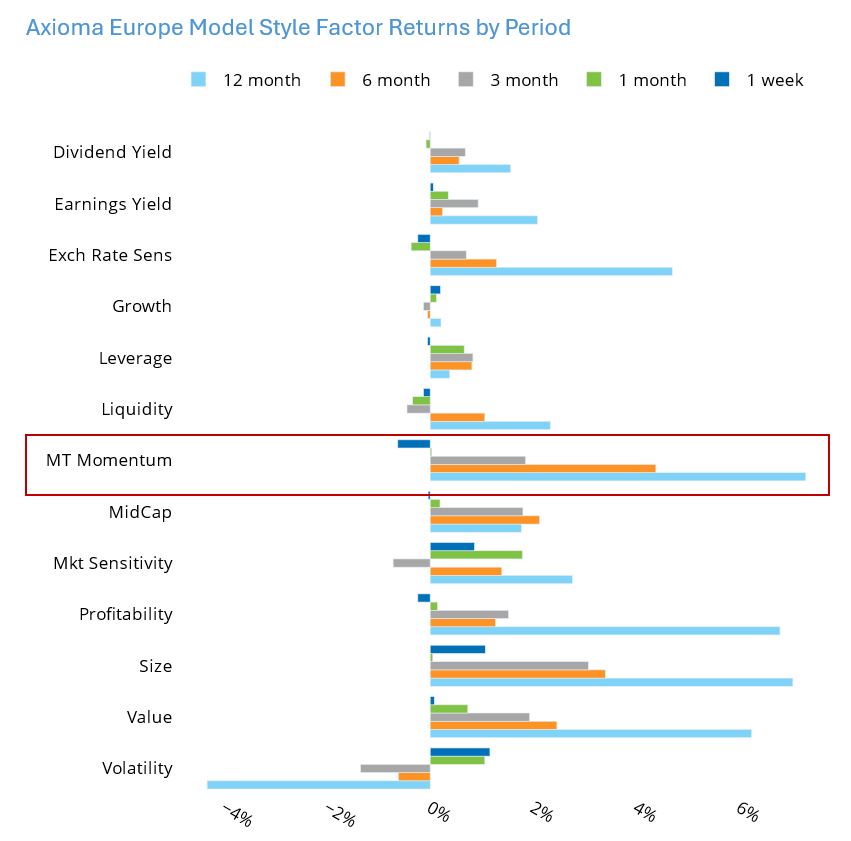
Europe has experienced an even bigger drawdown in Momentum performance, with the most negative return to the factor in the last month across our models, as well as of all factors in the European model. Longer-term results for the factor in Europe remain strong, however.
See graphs from the US and European Equity Risk Monitors of May 17, 2024:
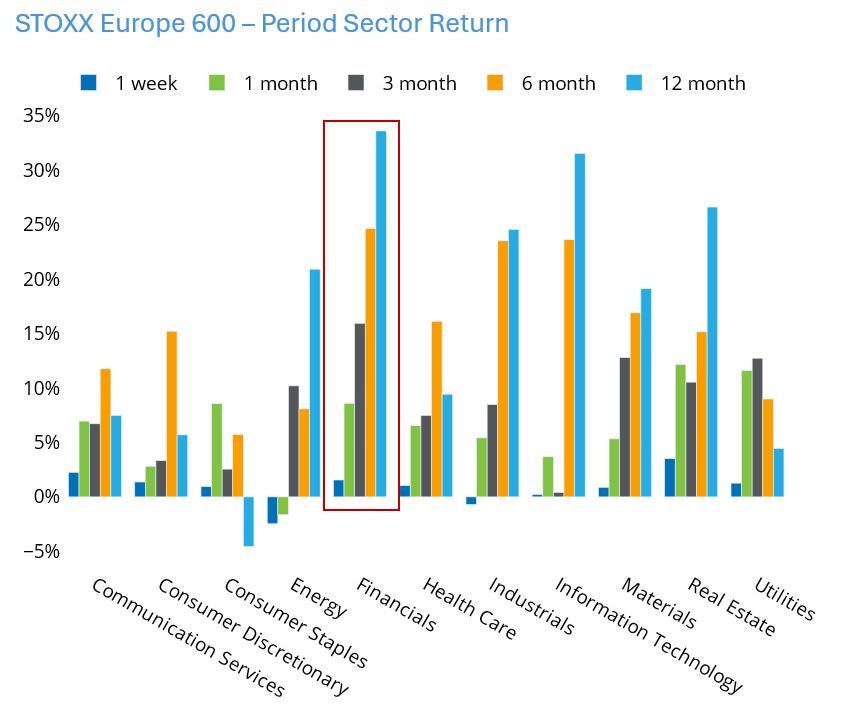
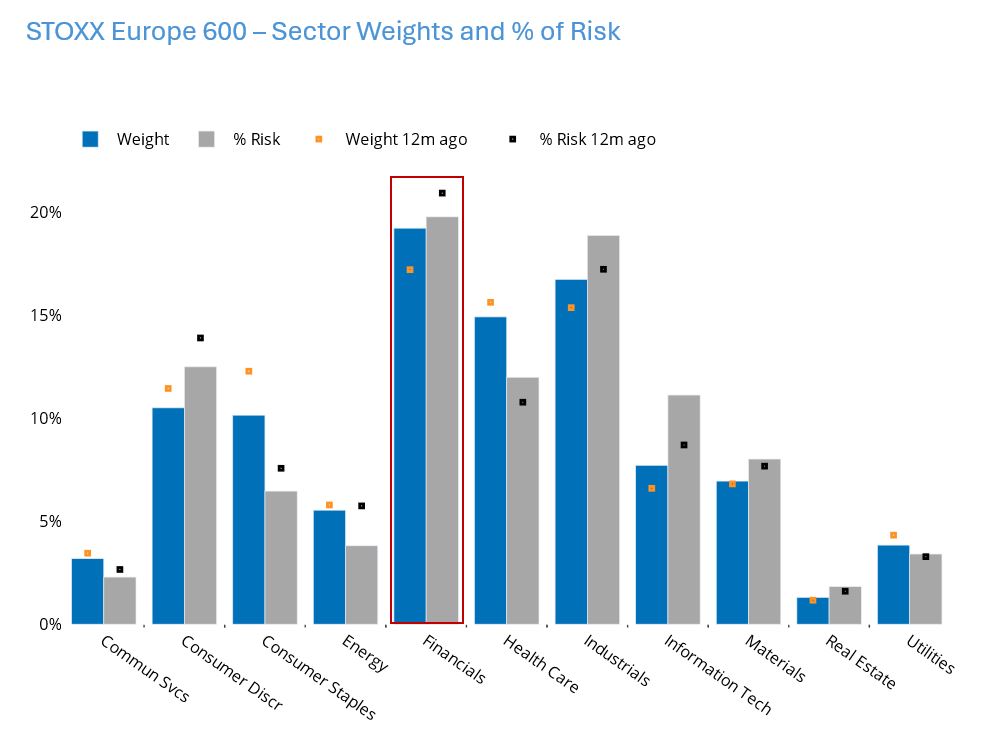
European Financials’ weight has increased substantially, while its contribution to risk has fallen
The European Financials sector has seen the highest returns of all sectors in the STOXX® Europe 600 Index over the past three, six and 12 months. This performance has substantially boosted the sector’s weight, from 17.2% a year ago to more than 19% currently. At the same time, Financials’ contribution to risk fell by about a percentage point, to a point where the risk contribution is almost on par with the weight (as compared with a gap of almost 4% in May 2023).
Of the regions we track closely, only Developed Asia-Pacific ex-Japan and Emerging Markets have a higher weight in Financials, although in both regions weight and contribution to risk have risen over the past year while contribution remains below the weight.
As compared with the US, sector weights in Europe are much more evenly distributed, meaning there is much less concentration risk. This may also be one reason that the overall risk level for the STOXX Europe 600 remains substantially below that of the STOXX US Index. (Another may be the benefit of country and currency diversification.)
See graphs from European Equity Risk Monitor of May 17, 2024:
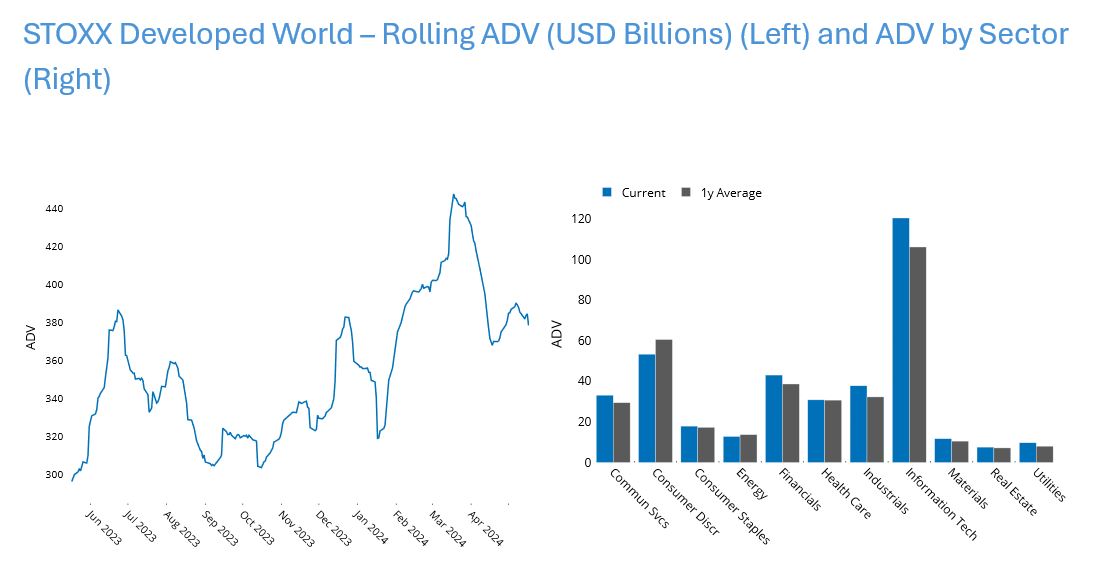
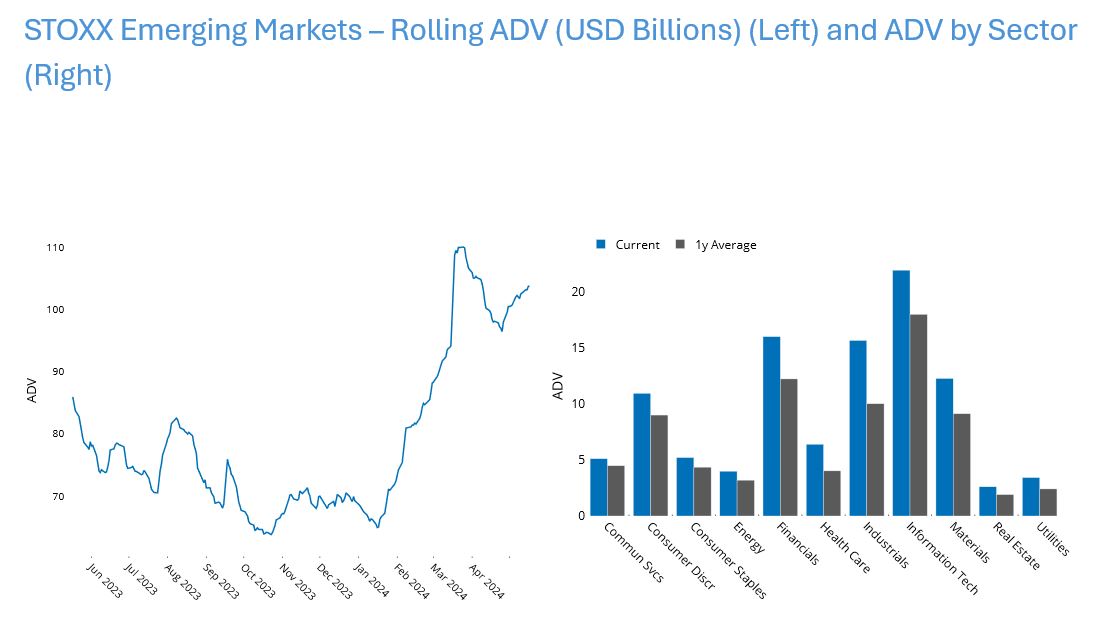
Developed Markets loss in trading volume may be Emerging Markets’ gain
There is a stark contrast between average daily trading volume (ADV) in developed vs. emerging markets. Volume for the STOXX® Developed World Index peaked in April and has declined since then, although it remains substantially higher than it was a year ago. Information Technology stands out as the sector with the highest volume, but, interestingly, Utilities’ recent volume, although lower than any sector except Real Estate, is the highest percentage above its average for the past year. In aggregate, the most recent reading for the index is about 6% higher than the average for the year and 28% higher than the level of a year ago.
The STOXX® Emerging Markets Index has not experienced that same magnitude of decline from the recent peak, and in fact has risen back to a near peak level. While the current volume is “only” about 21% more than it was a year ago, it is more than 30% higher than the average over the period. In addition, whereas current ADV is lower than average for some sectors in developed markets, it is substantially higher than average across all sectors in emerging markets. It is not clear whether the increased interest in emerging markets is a trend yet, but it is an observation that bears following.
See graphs from the STOXX Developed World and STOXX Emerging Markets Equity Risk Monitors of May 17, 2024: