

EQUITY RISK MONITOR HIGHLIGHTS
WEEK ENDED JUNE 4, 2024
Utilities: Really?
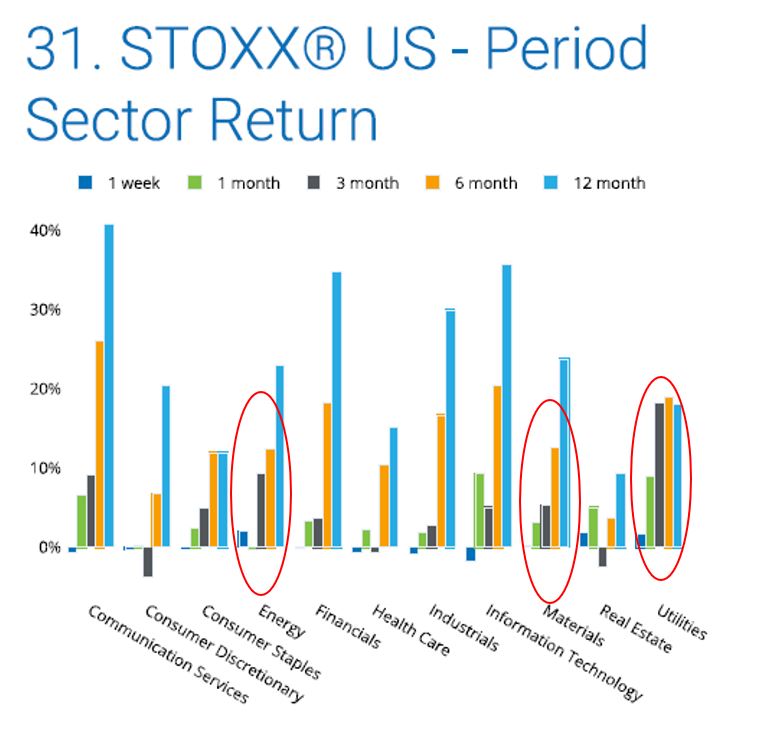
There has been a great deal of buzz around the broadening of the gains outside of Information Technology and Communication Services, both in the United States and around the world. It is not lost on us that Utilities, Materials and Energy have done exceptionally well on a standalone basis over the last 3 months in particular, but we question how much this actually affects active managers in a positive way, even if they are overweight these sectors.
Utilities in the STOXX US index are up a whopping 18.2% through the 3 months ended May 31. The Index’s Energy constituents are up 9.4%, and Materials are up 5.3%.
See graphs from the STOXX US Equity Risk Monitor of May 31, 2024:
However, sector return contributions over the same 3- month period show the following:
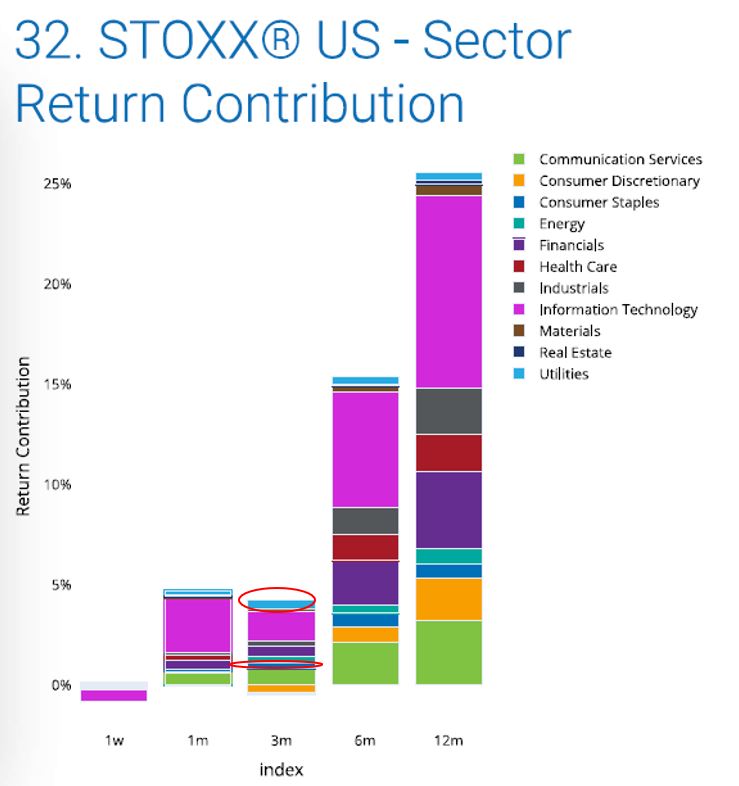
Despite the rip-roaring returns to Utilities, they contributed just 39 bps to the index over the last 3 months while IT contributed 150 bps and Communication Services 83 bps. The difference, of course, is in the index allocation to the sectors:- Utilities was just 2.1% of the index on Feb 29, and IT was 30.3%. As of May 31st, Utilities are up to 2.4%, but IT is also up to 30.99%. A smaller total return led to a bigger allocation increase for IT.
We ran a quick thought experiment- with perfect hindsight we can derive the active weights in IT and Utilities that would have been required for 25 bps outperformance from Feb 29th to May 31st. It turns out that if a manager had been underweight IT by 2% and overweight Utilities by 2% on Feb 29th, she would have outperformed by 25 bps, all else equal. A February 29 optimization with a minimum tracking error objective and forced into +2% overweight Utilities and -2% underweight IT with all non-IT/non-Utilities GICS industries forced to be equal to the benchmark yields a forecast tracking error of 31 bps. If we annualize the 3-month active return of 25 bps, this would seem like a great risk/return tradeoff- but one would have to have a great deal of confidence that the Utilities sector really stands to benefit from the AI phenomenon in the immediate future.
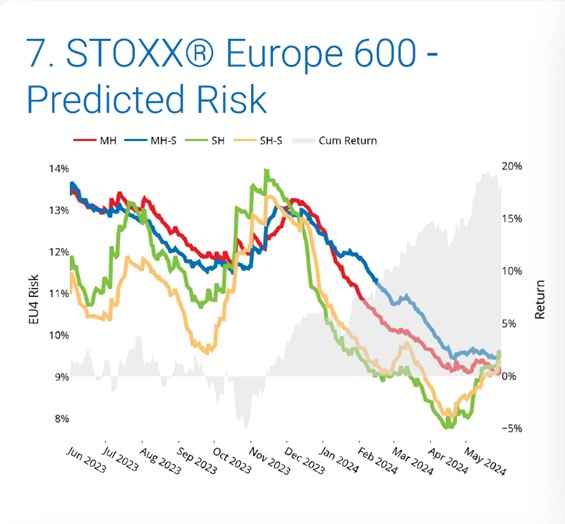
Europe Risk Very Low
Clients have commented to us that equity index risk in Continental Europe appears exceptionally low. All four Axioma Europe Equity model variants (Short/Medium Statistical, Short/Medium Fundamental) have converged at forecast risk of between 9-9.5% for the STOXX 600 index.
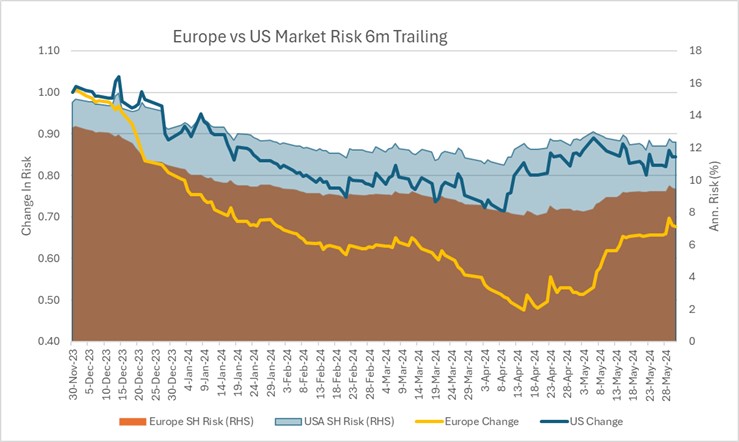
Risk levels in Europe have been lower than in the US for quite some time, but it is also the rate of change in risk that has become starkly different in the 1st half of 2024. The below chart plots both the levels and the change in risk for the STOXX US index and the STOXX Europe 600 index, as measured by the US and European Short-Horizon Fundamental models, respectively:
The following chart is not published with the Equity Risk Monitors but is available upon request:
Europe, like the US, has had strong Momentum Returns YTD, or over the past 6 months. The sectors that have Positive Momentum exposure in the two markets are quite opposite one another however.:
See graph from the STOXX Europe 600 Equity Risk Monitor of May 31, 2024:
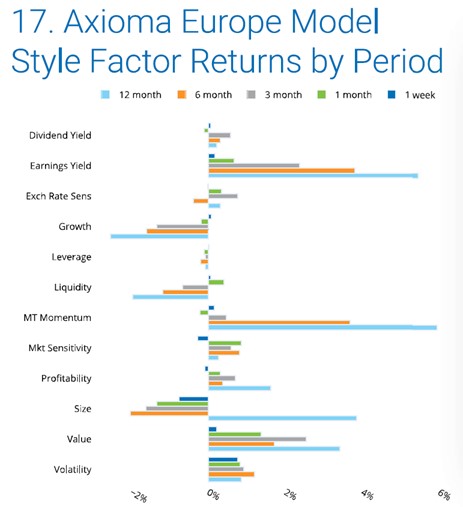
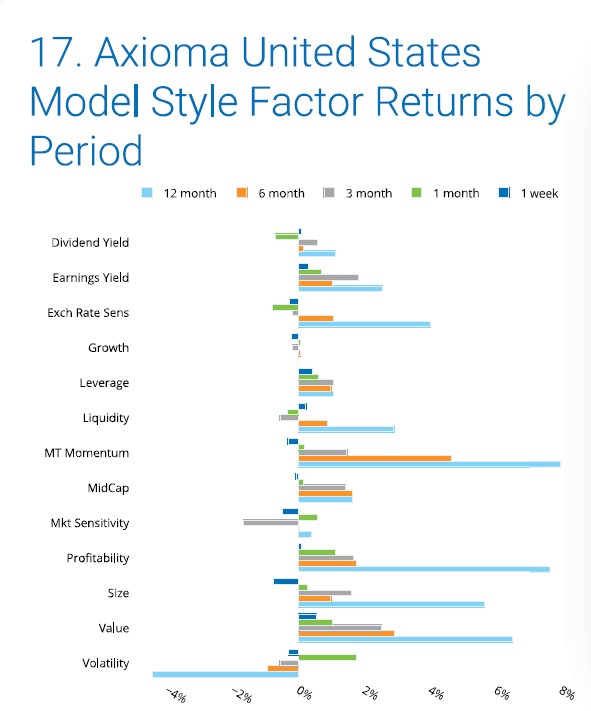
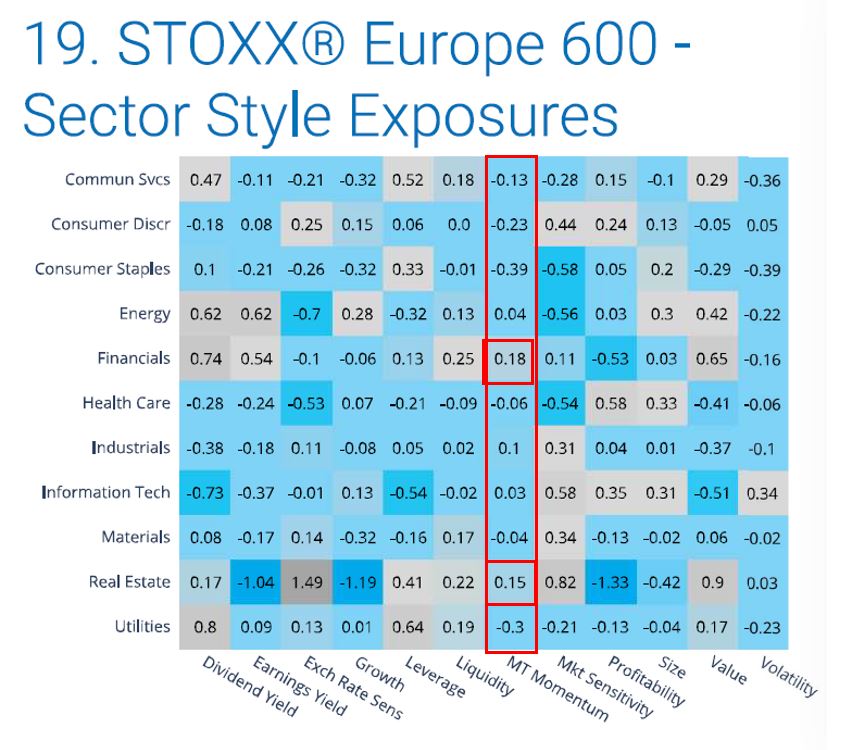
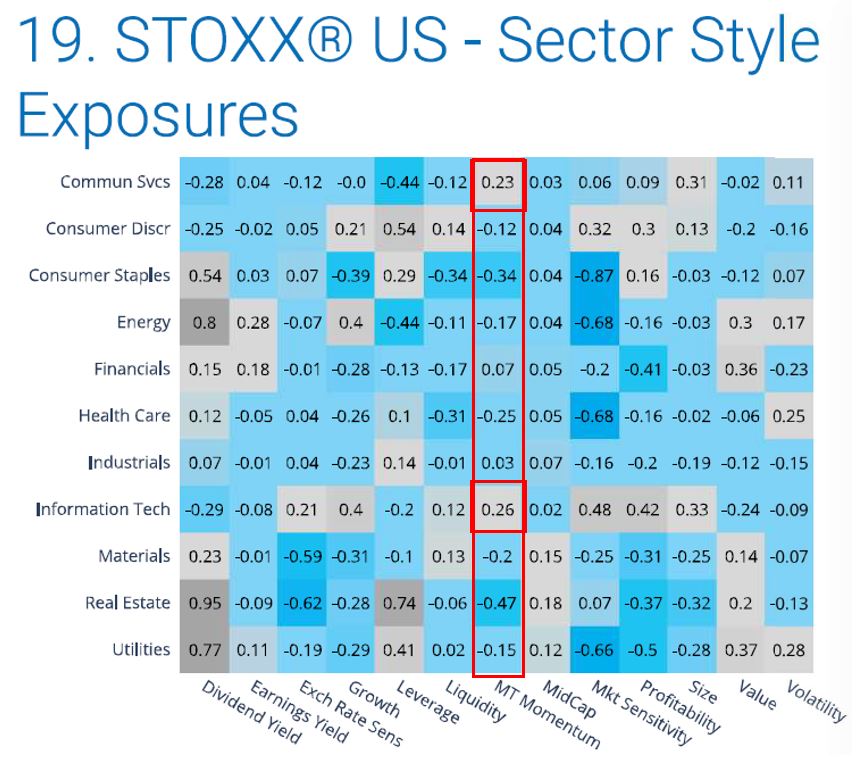
In Europe, it is Financials and Real Estate sectors that have positive Momentum exposure. In the US, Financials are Momentum-neutral and Real Estate is by far the most negative Momentum sector. In Europe, Communication Services is Momentum-neutral and Information Technology has negative Momentum exposure. In the US, those two sectors are the only ones with meaningful positive exposure.
The STOXX Europe 600 is a more diversified index than the STOXX US. We can see this by comparing the sector concentration where both indices have allocations across the 11 GICS sectors, yet the STOXX Europe 600 effectively has 8 sectors while the US has 6.3 (Effective # of sectors = 1/sum of squared sector weights), but we can also see it in the “diversification ratio” which compares the weighted sum of all index constituents’ variances to the index variance:
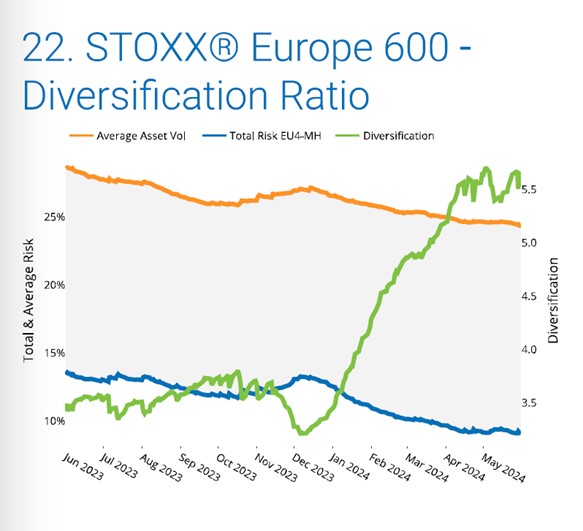
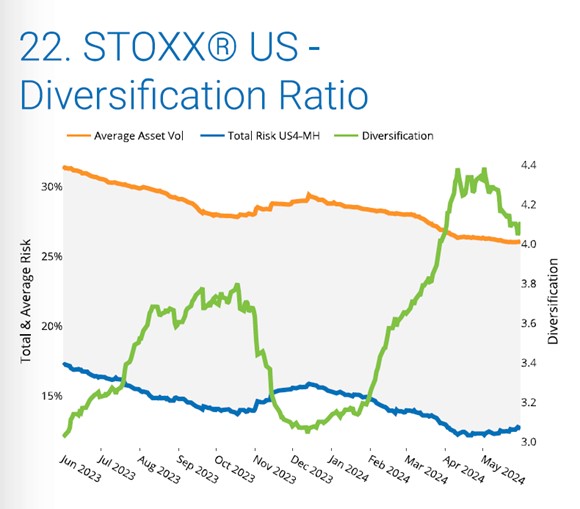
There is simply more diversification embedded in the European market than in the US market at this time.