
EQUITY RISK MONITOR HIGHLIGHTS
WEEK ENDED JULY 19, 2024
Axioma Risk Monitor: US large-caps tumble as small-caps keep their cool; European tech stocks see largest decline; Asset dispersion widens in the US
US large-caps tumble as small-caps keep their cool
Following a volatile week, US large-cap shares ended in negative territory while US small caps still recorded a small win. Investors have been digesting large swaths of information recently: higher probabilities of a Trump presidency, the Fed chairman’s reluctance to announce the date of an interest rate cut, resilient retail sales, mixed earnings reports and a cyber outage that disrupted businesses globally, to name a few.
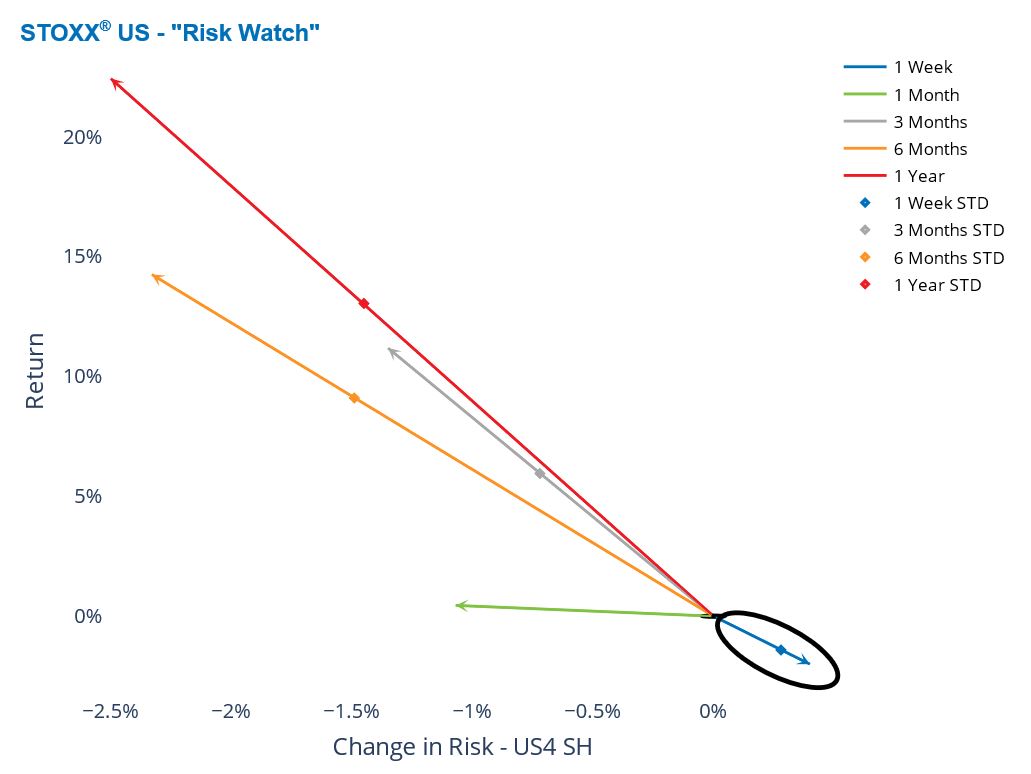
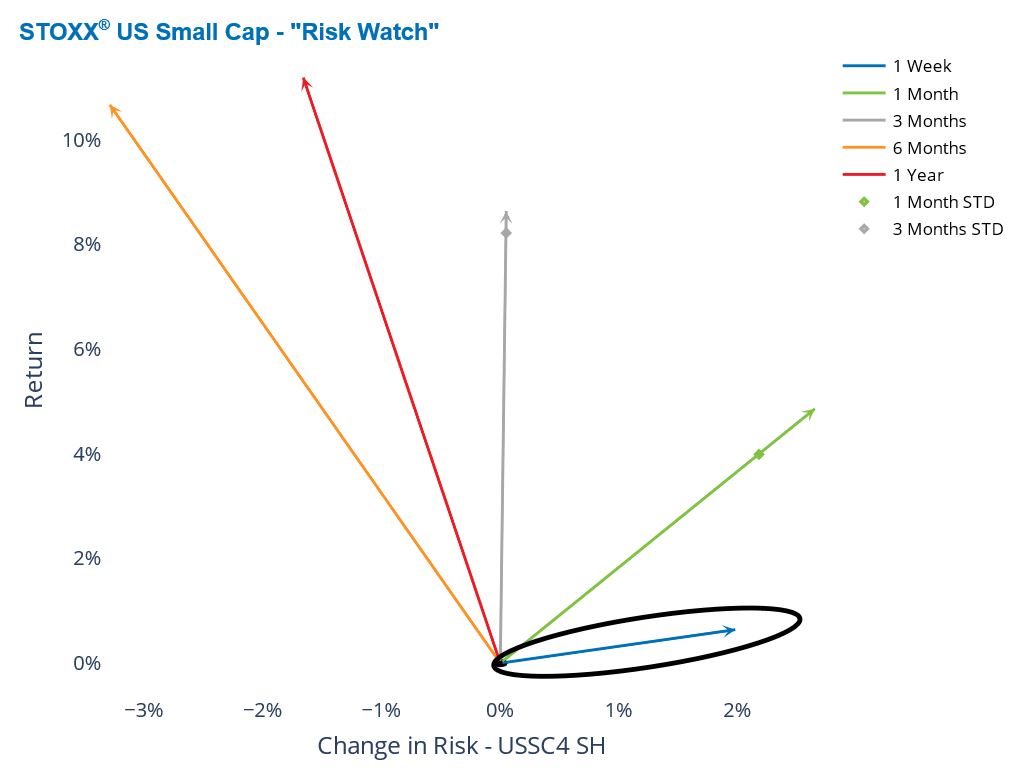
US large caps marched upward to new records on Monday and Tuesday, but after a selloff in the second part of the week, the STOXX® US index was down 2% over the past five business days. This loss was larger than one standard deviation of the expectation at the beginning of the week. While small-cap stocks followed a similar path, soaring in the beginning of the week and falling afterwards, the STOXX® US Small Cap index was still able to eke out nearly a 1% weekly gain.
At the same time, the risk of the STOXX® US Small Cap index rose a substantial 200 basis points while that of the STOXX® US index only 40 basis points last week, as measured by Axioma US Small Cap and All Cap fundamental short-horizon models, respectively. The Small Cap index was more than 50% riskier than its larger-cap counterpart as of last Friday. Yet, despite the recent increases in risk for both indices, the current risk levels remain well below those observed at the end of 2023.
See graph from the STOXX US Equity Risk Monitor as of July 19, 2024:
See graph from the STOXX US Small Cap Equity Risk Monitor as of July 19, 2024:
European tech stocks see largest decline
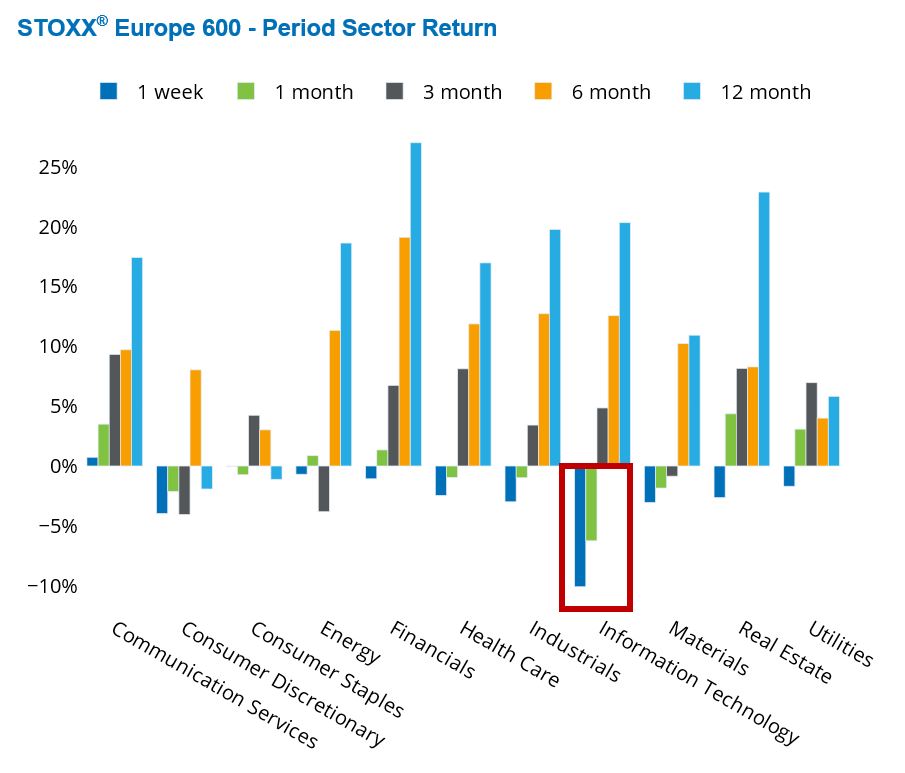
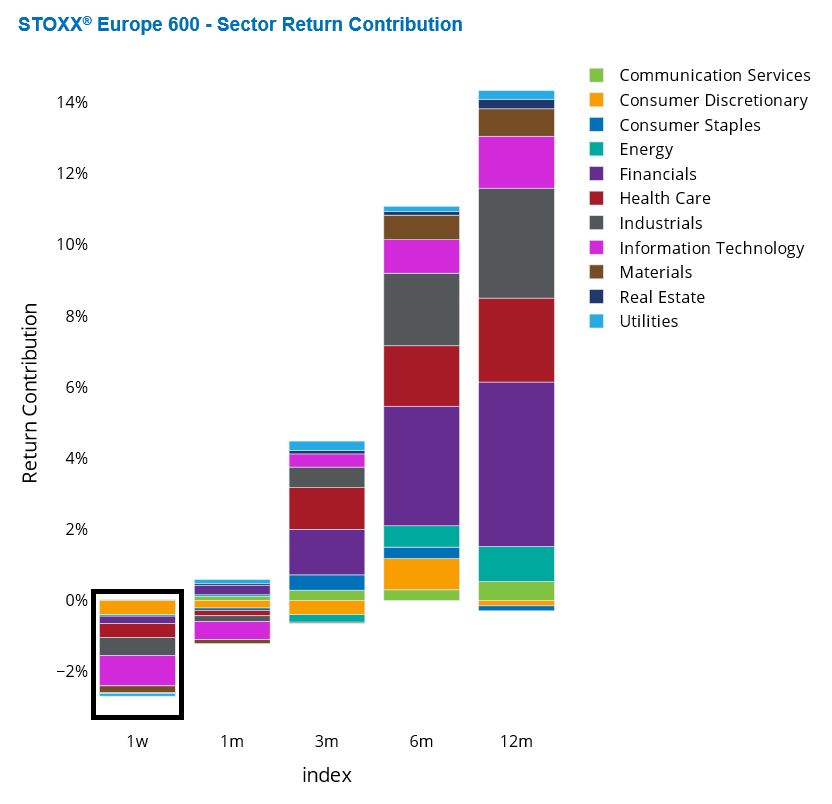
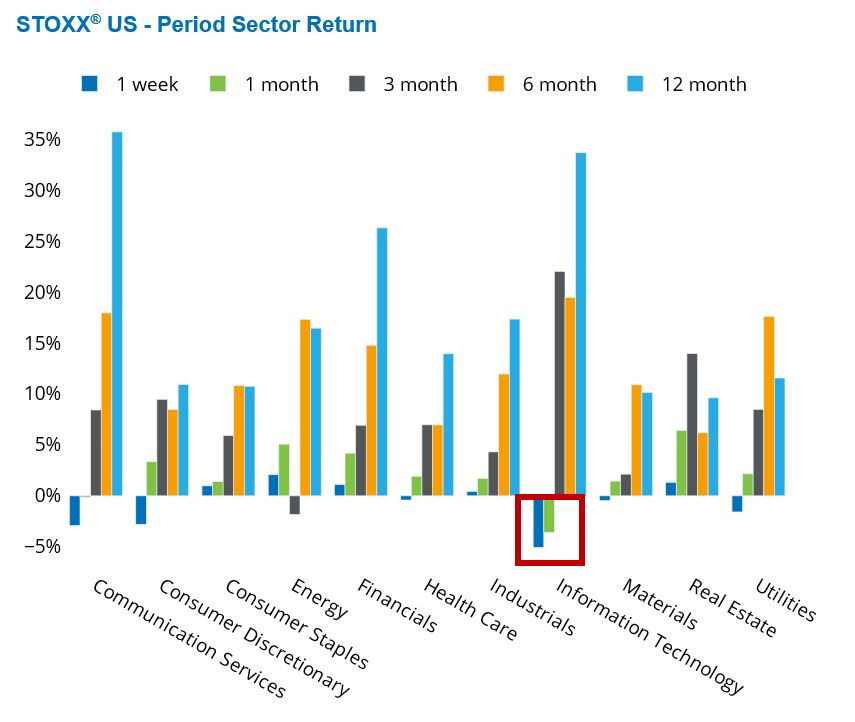
After a stellar run in the first half of the year, tech companies took a beating worldwide last week. While all eyes have been on the decline of the US Magnificent Seven, Europe witnessed the largest decline—over 10%—of the Information Technology sector last week. All European sectors fell last week, except Communication Services, with Info Tech being responsible for more than a third of the 2.65% decline in the STOXX® Europe 600 index, where tech stocks represent about 8% of the index.
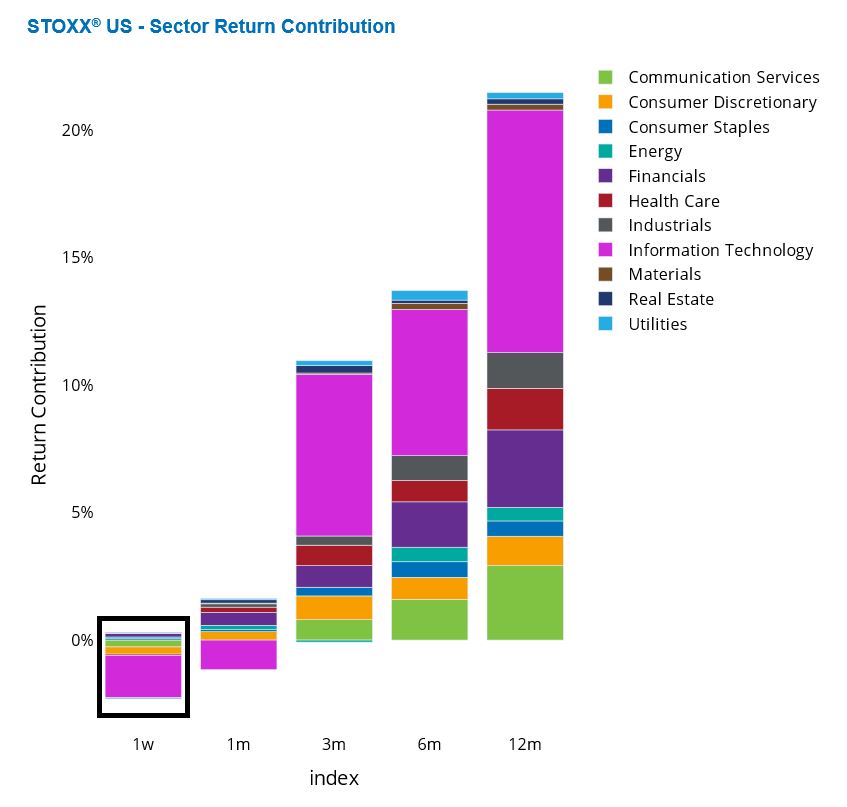
US Info Tech was down 5% for the past five business days, and was responsible for over 80% of the weekly decline in the US index due to its dominance of the index (32% weight). Note that in the US, only half of the sectors were down for the week: Communication Services, Consumer Discretionary, Health Care, Info Tech, Materials and Utilities.
See graphs from the STOXX Europe 600 Equity Risk Monitor as of July 19, 2024:
See graphs from the STOXX US Equity Risk Monitor as of July 19, 2024:
Asset dispersion widens in the US
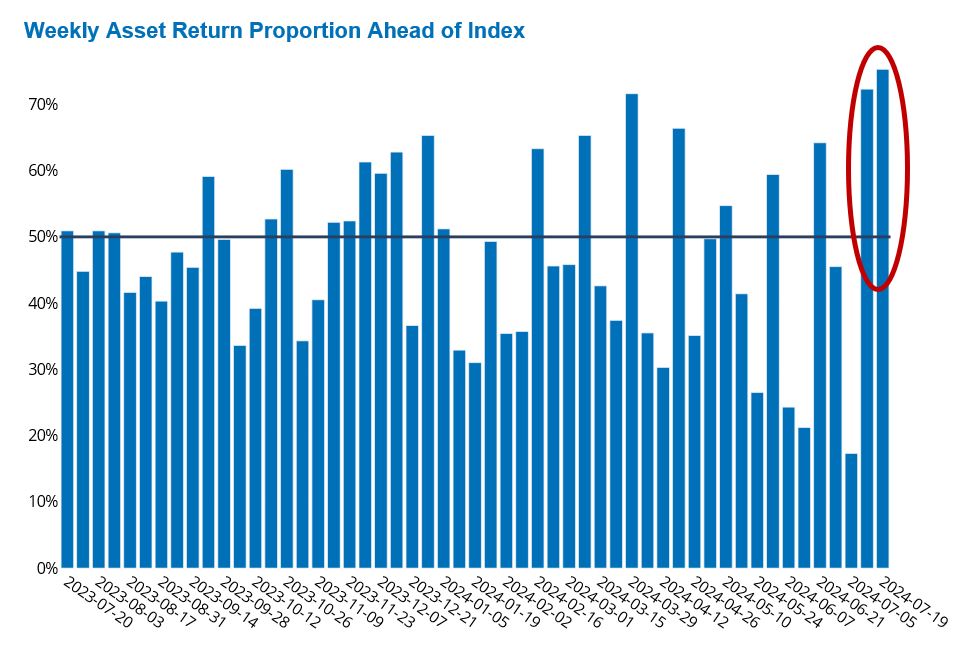
While the STOXX® US index was driven down mainly by tech shares last week, 75% of the stocks in the US index still outpaced the index’s performance, suggesting it was a decline of larger stocks that heavily impacted the US market.
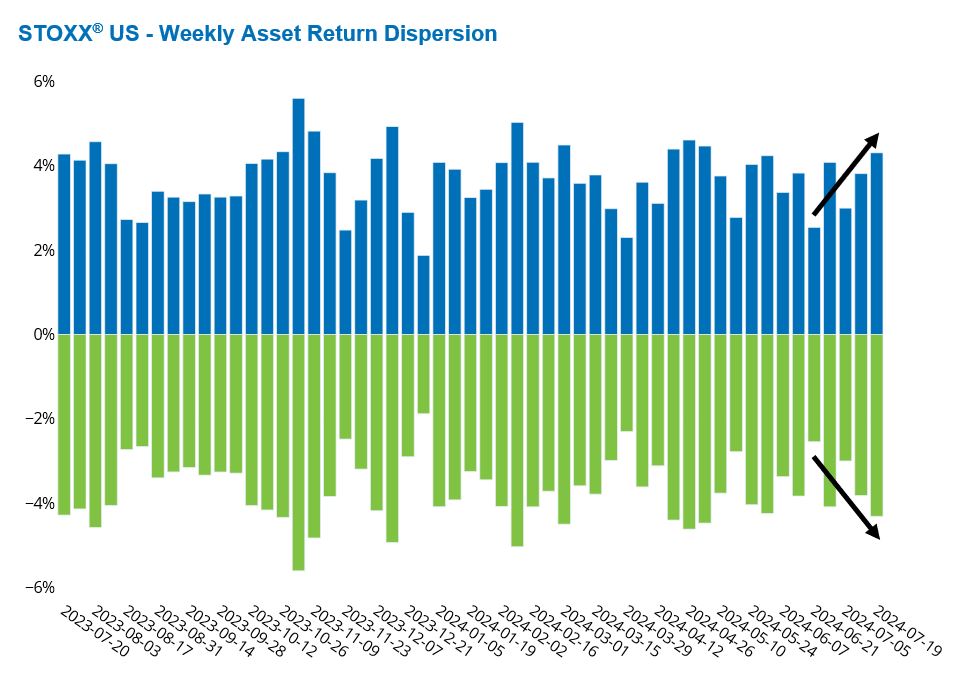
As the US market declined, the spread between the winners and losers widened. Asset return dispersion—the cross-sectional standard deviation of five-day returns—has risen over the past three weeks.
These two statistics reflect the divergence in returns across sectors and types of stocks, and suggest—as many active managers hope—that it was possible to outperform the declining market.
See graphs from the STOXX US Equity Risk Monitor as of July 19, 2024:
