
EQUITY RISK MONITOR HIGHLIGHTS
WEEK ENDED AUGUST 2, 2024
Markets fell on economic concerns……driving risk way up……and leading to outsized factor returns
Markets fell on economic concerns…
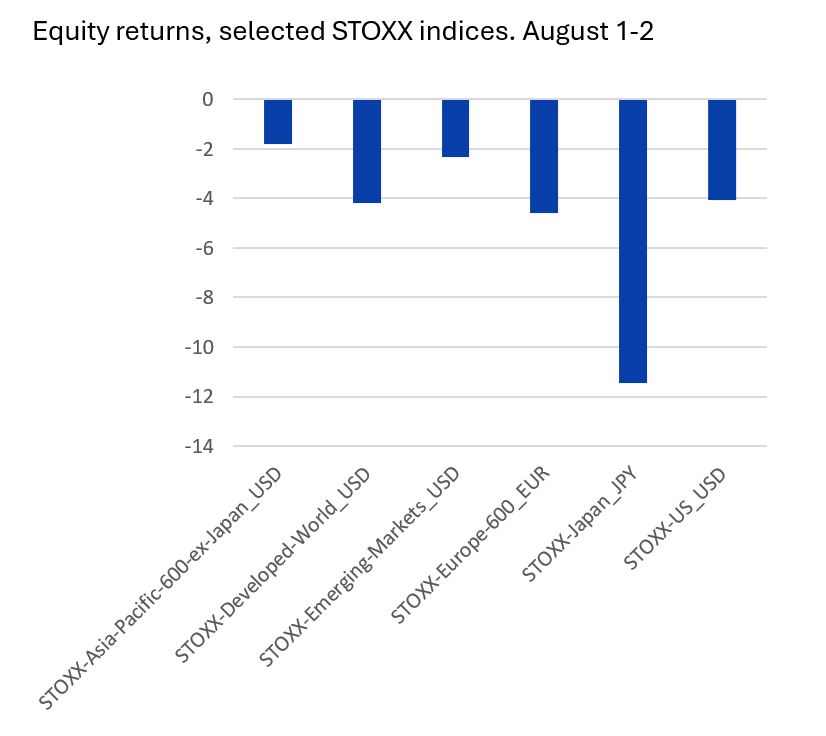
The jobs report on Friday, August 2 offered bad news to investors, with the triggering of the “Sahm rule1" that suddenly increased the prospect that the US has entered a recession. Second-quarter earnings reports were already causing concerns about the sustainability of the current economic environment and the ability of AI-related companies to maintain their economic strength. As a result, the two-day return for Thursday and Friday of last week was worse than about 98% of two-day periods since 1982. And that was just in the US. Most, if not all markets followed the US down. Japan suffered the most of major markets, declining more than 11%, its worst performance in many, many years.
In our weekly ROOF highlights we pointed out that investor sentiment took a tumble last week across most markets and is now in negative territory for a few. As we often point out in our discussions of market sentiment, bad news tends to be punished to a higher degree while good news is ignored when sentiment is negative. Adding to that is the typical summer decline in trading volume (which, to be fair, has not seen as big a drop as usual), which also implies the reaction to news (good or bad) is likely to be exaggerated. Valuations were lofty, especially in the Technology sector, suggesting there was farther to fall when the “sell” signal got triggered. For all those reasons (and likely many more) we have seen, and continue to see as of this writing, a major sell-off in stocks.
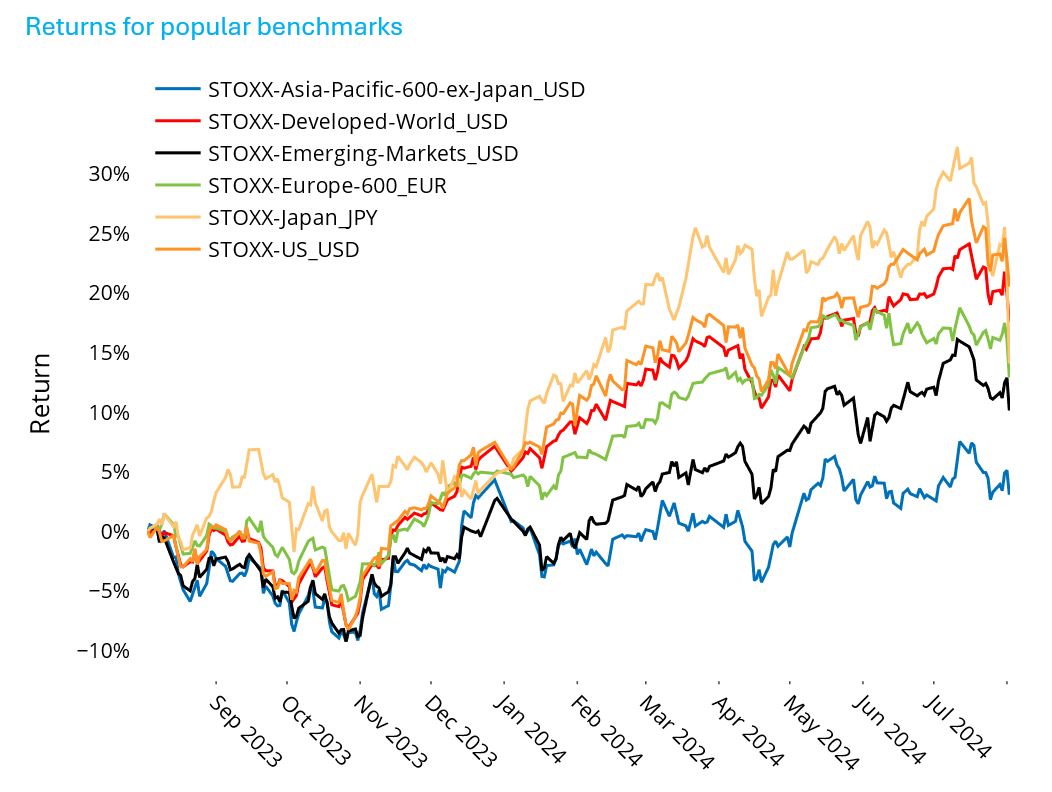
See graph from the Global Developed Markets Equity Risk Monitor of August 2, 2024
The following chart is not in the equity risk monitors but is available on request
…driving risk way up…
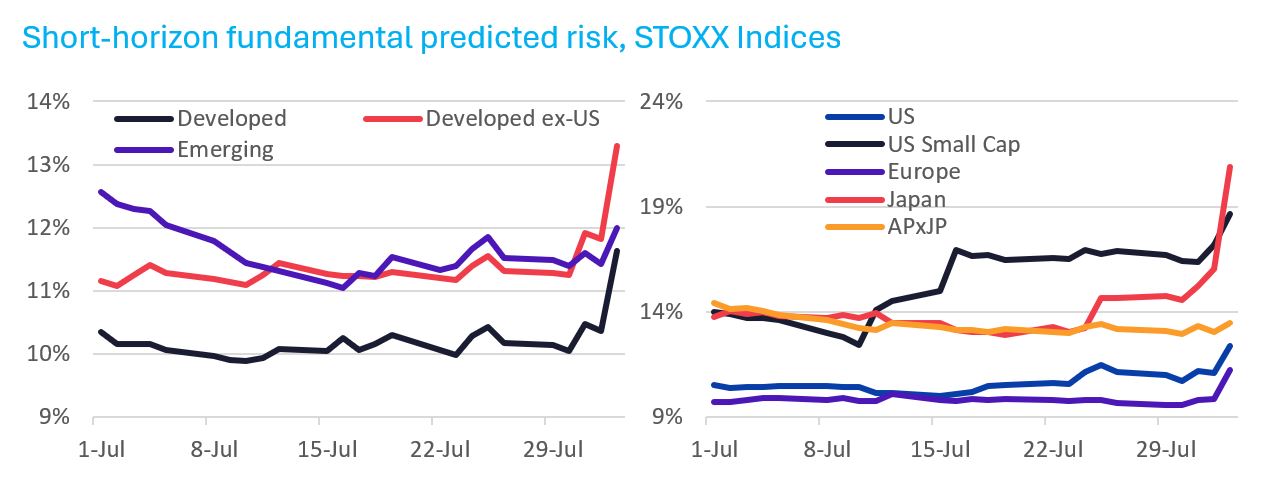
Not surprisingly, the sharp market downturns were accompanied by substantial increases in predicted volatlity. Looking across major markets, we see that short-horizon predicted volatility had remained steady throughout July, with the possible exception of in the STOXX© US Small Cap Index. It had even declined in the STOXX Emerging Markets Index.
That came to an end last week. Predicted risk for the STOXX© Japan index has risen 50% since the end of June, the most of any of the major indices. US core risk is up 16%, while US Small Cap’s has risen 32%. Big increases in a short period.
The following charts are not in the equity risk monitors but are available on request
…and leading to outsized factor returns
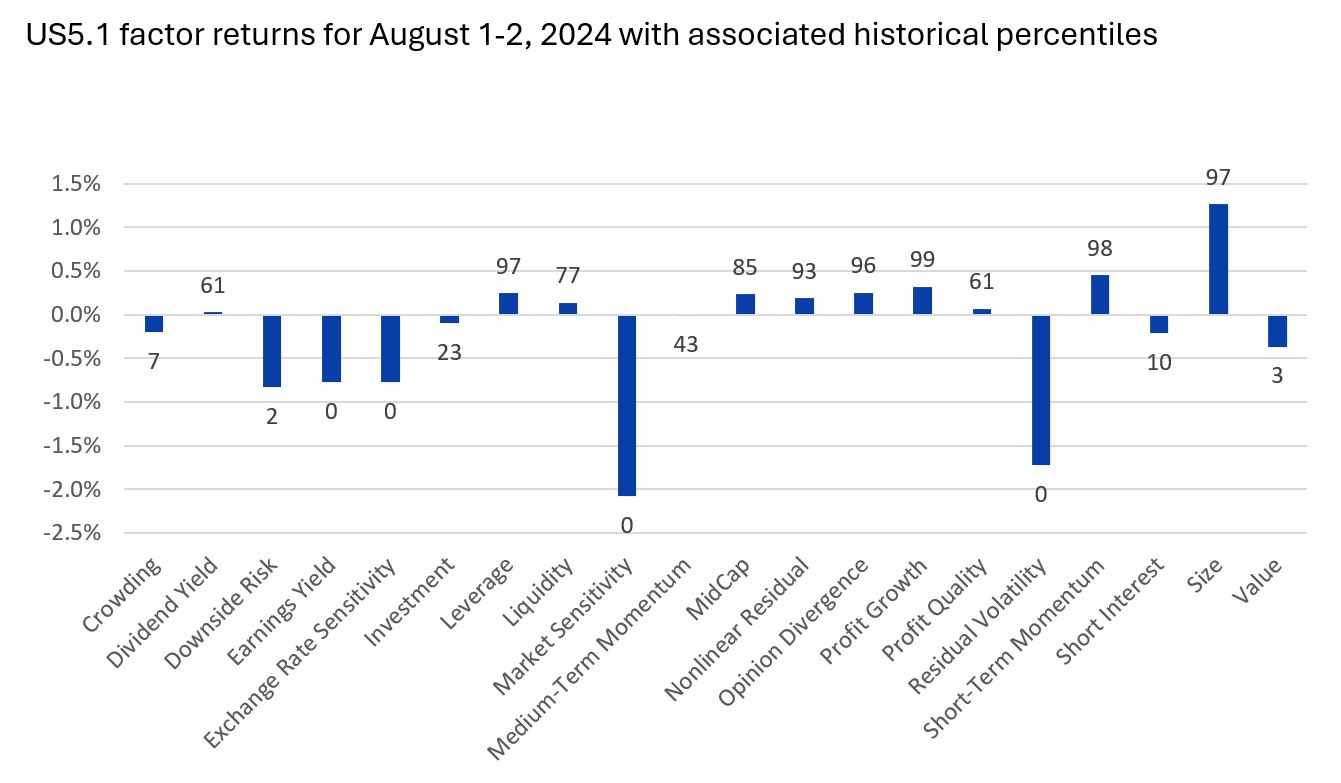
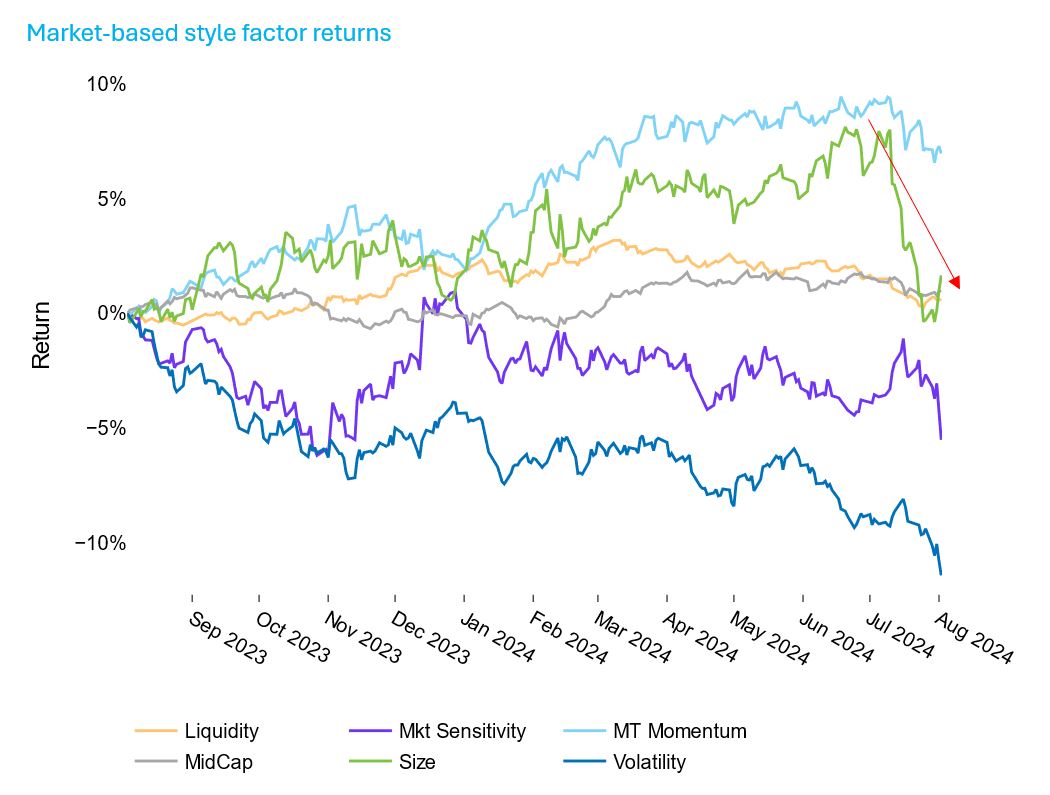
The market rout has not spared factors, most of which experienced large-magnitude returns in the past two days. The chart below shows style factor returns from the US5.1 model for Thursday and Friday; the number above or below the bar is the associated percentile comparing last week to all two-day periods since the model’s inception.
The flight to quality is evident in the record negative returns to Market Sensitivity (meaning low beta far outpaced high beta) and residual volatility. High Downside risk also fared poorly, but its return has been worse on occasion.
It is interesting to note that the return to Medium-Term Momentum wasn’t too bad, as these types of downturns tend to also come from a sharp rotation in favored sectors. It seems that the decline in Momentum had already started, with a factor return of -1.5% in July, a sixth-percentile performance versus the full US5 model history.
Also of note are the highly negative returns to Earnings Yield and Value, as maybe what had been thought of as “cheap” no longer looked that way. Investors were also exiting the crowded names, as the return to the Crowding factor was also quite negative.
The following chart is not in the equity risk monitors but is available on request
See graph from the STOXX© US Equity Risk Monitor of August 2, 2024 (using the US4 equity model)
Footnote
1 According to the FRED Economic Data site, “The Sahm rule identifies signals related to the start of a recession when the three-month moving average of the national unemployment rate (U3) rises by 0.50 percentage points or more relative to its low during the previous 12 months.”
