
EQUITY RISK MONITOR HIGHLIGHTS
WEEK ENDED AUGUST 9, 2024
This week’s highlights will focus on the Japanese market, which saw bigger increases in volatility, more pronounced risk-adjusted returns and many other big moves in risk-related variables last week as compared with other country, regional and global Axioma risk models
- Short-horizon risk ended last week more than double the level of two weeks ago
- Japan’s currency risk vs. the US dollar is now the highest among developed-market currencies
- As top-down concerns overtook company-by-company characteristics, correlations soared and diversification plummeted
- Style factor returns: large magnitude and substantial reversals
- Volatility at or near high end of recent range for several factors
Short-horizon risk ended last week more than double the level of two weeks ago
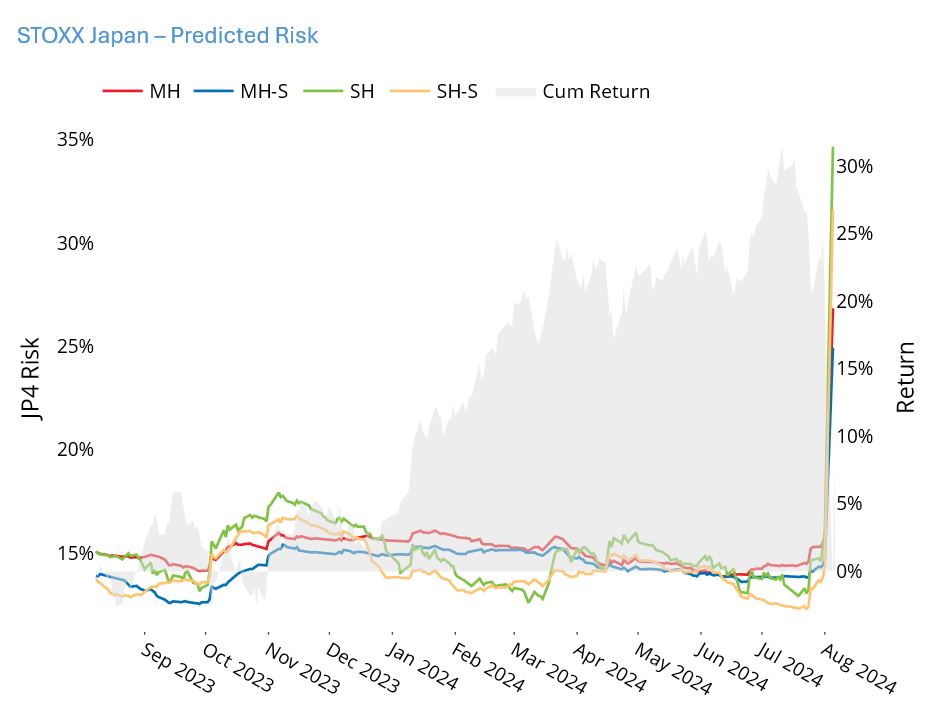
After the turmoil of early last week triggered by the jobs report and then the Bank of Japan announcement that it would raise its target rate by 15 basis points, after a 10 basis point rate hike a month earlier, leading to a vast unwinding of the carry trade involving the yen, things seemed to settle down by the end of the week. Even before that day risk had started to climb: The Axioma Japan model short-horizon fundamental risk forecast for the STOXX© Japan Index was up more than 60%, from a low of 12.9% on July 19 to 20.9% on August 2. It then rose again by 66% on August 5 to 34.7% before settling down a bit the next day and ending the week at 30.5%. Of course those invested in carry trades saw losses, but this sharp increase in volatility made maintaining steady risk in an equity portfolio that much more difficult as well.
See chart from the STOXX Japan Equity Risk Monitor as of August 9, 2024
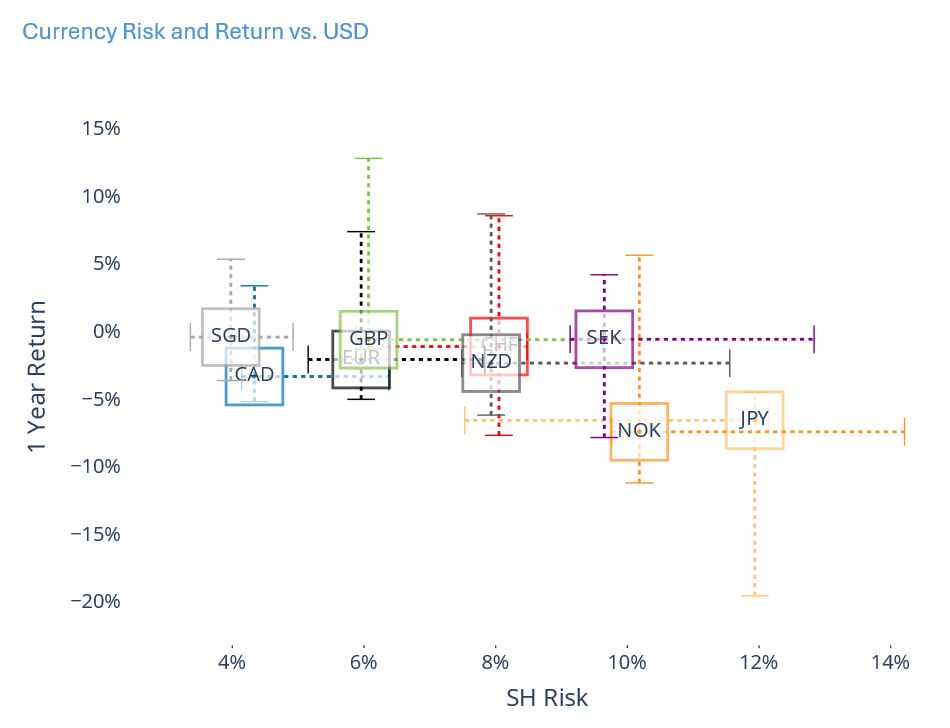
Japan’s currency risk vs. the US dollar is now the highest among developed-market currencies
JPY risk ended last week in the middle of its 12-month range and at the high end of its 12-month return range (both versus USD). Although volatility has been higher in the last year, JPY is now the riskiest of the developed-market currencies, whereas it has been much closer to the middle of the nine currencies over the past year and was one of the lowest volatility currencies at the end of 2021.
See chart from all of the Equity Risk Monitors as of August 9, 2024
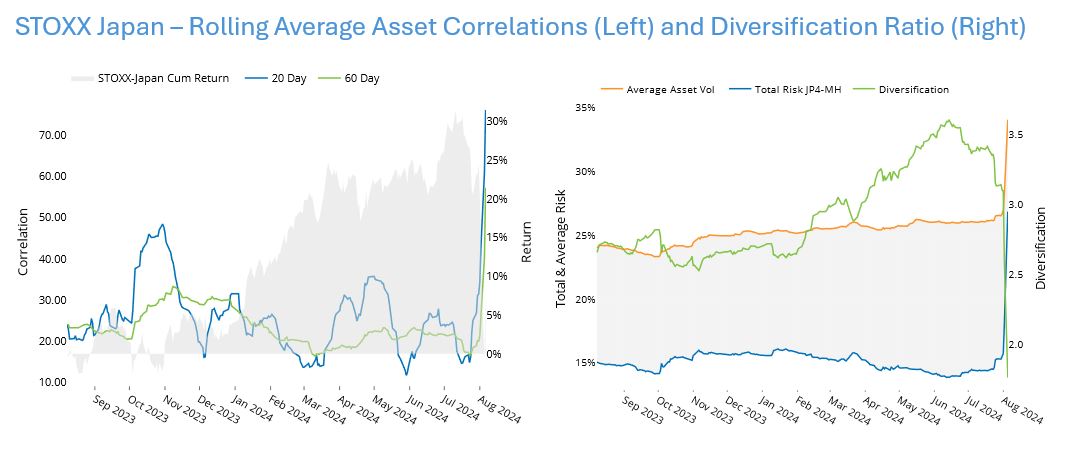
As top-down concerns overtook company-by-company characteristics, correlations soared and diversification plummeted
The median rolling 20-day correlation of stocks in the STOXX Japan index rose from about 0.15 at the end of July to about 0.80 at the end of last week. The shift to “all stocks moving together” suggests that investors do not currently care to distinguish between the more and less attractive stocks, they punished all stocks at the same time. The Diversification Ratio is the difference between the weighted average variance of stocks in the index and the overall index variance – in other words, it measures the impact of correlation. Therefore, the huge increase in correlation was accompanied by a plummeting Diversification Ratio. We have already noted the increase in index volatility; the average asset volatility also shows a similar hockey-stick pattern rising suddenly and sharply.
See charts from the STOXX Japan Equity Risk Monitor as of August 9, 2024
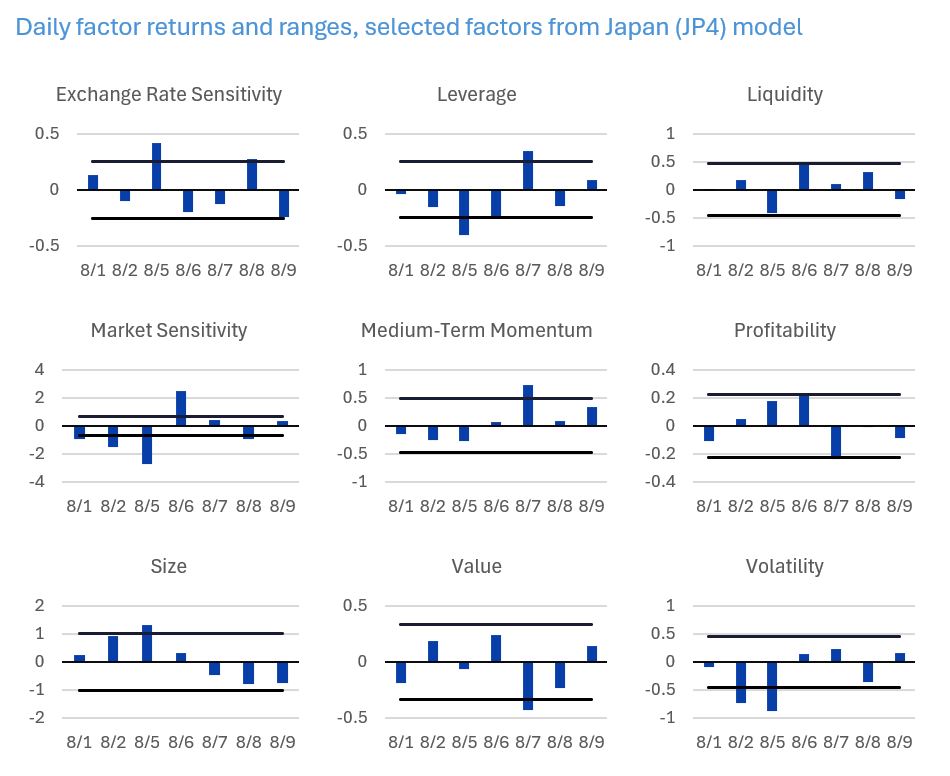
Style factor returns: large magnitude and substantial reversals
Japan experienced a larger-than-expected magnitude of return in several style factors over the last week, with several factors seeing daily returns either well above or well below expectations and reversing from one day to the next. These high-magnitude and whipsawing days also resulted in increased volatility for most factors, which will have added to active risk in style and other portfolios. The back-and-forth may have resulted in factor returns that ended up looking reasonable for longer periods, but the daily navigation was likely to have been tough.
Below are a few examples. The solid lines represent a two standard deviation range around the daily returns using the long-term standard deviation. These charts do not appear in the risk monitors but are available on request.
Volatility at or near high end of recent range for several factors
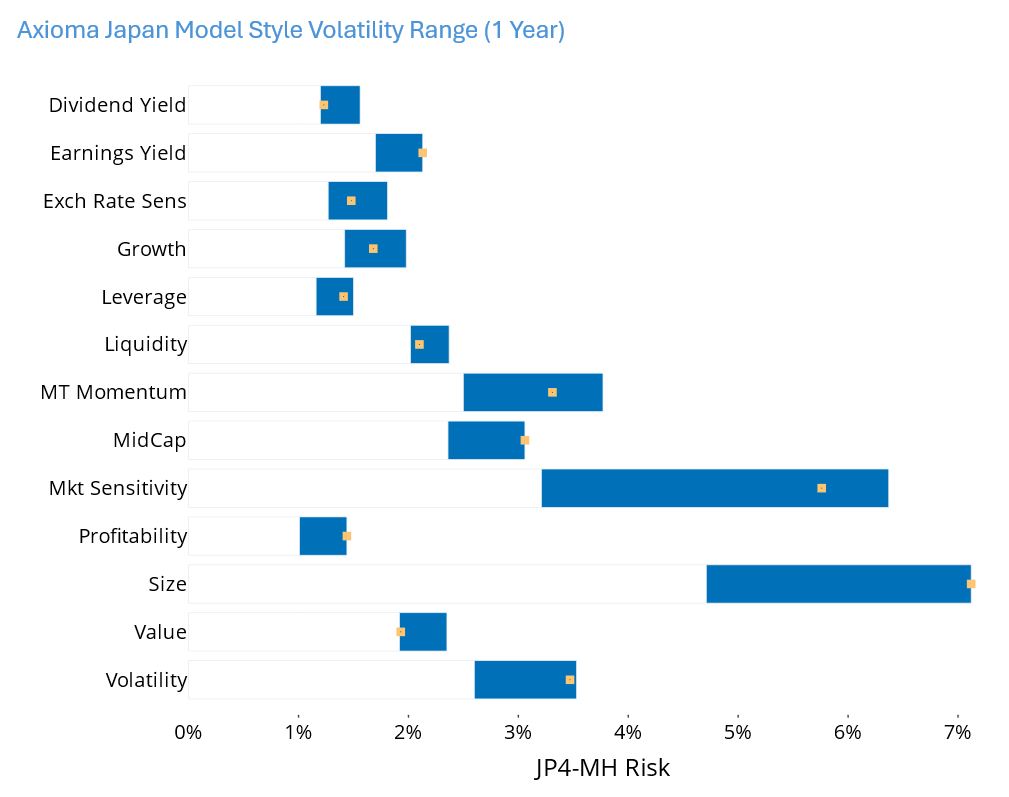
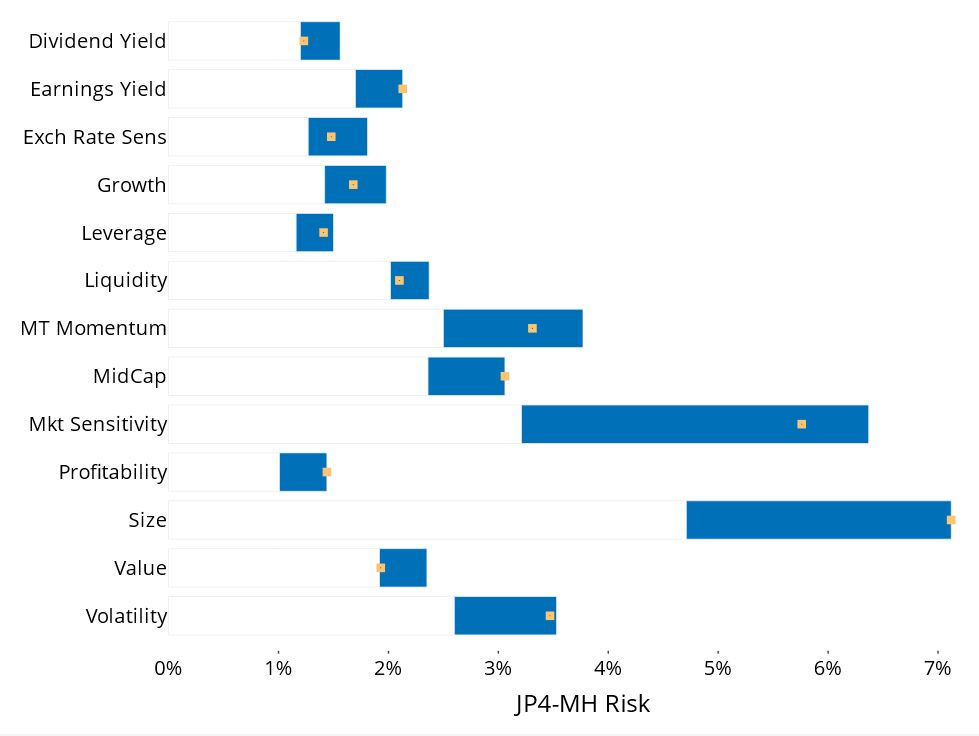
Finally, as noted, the daily volatility noted above also resulted in higher predicted volatility for several factors. Earnings Yield, Profitability, Size and Volatility are at the high end of their 12-month ranges, while Market Sensitivity and Medium-Term Momentum are closer to the high than to the low. Interestingly, Dividend Yield and Value remain at the low end of their respective volatility ranges. These gyrations may have led to higher active risk for some Japanese portfolios.
See chart from the STOXX Japan Equity Risk Monitor as of August 9, 2024
