
EQUITY RISK MONITOR HIGHLIGHTS
WEEK ENDED SEPTEMBER 27, 2024
Note: given the impact of the stimulus announcement by the People’s Bank of China and the subsequent Chinese market “melt-up”, we are devoting this week’s Equity Highlights to risk in the Chinese market.
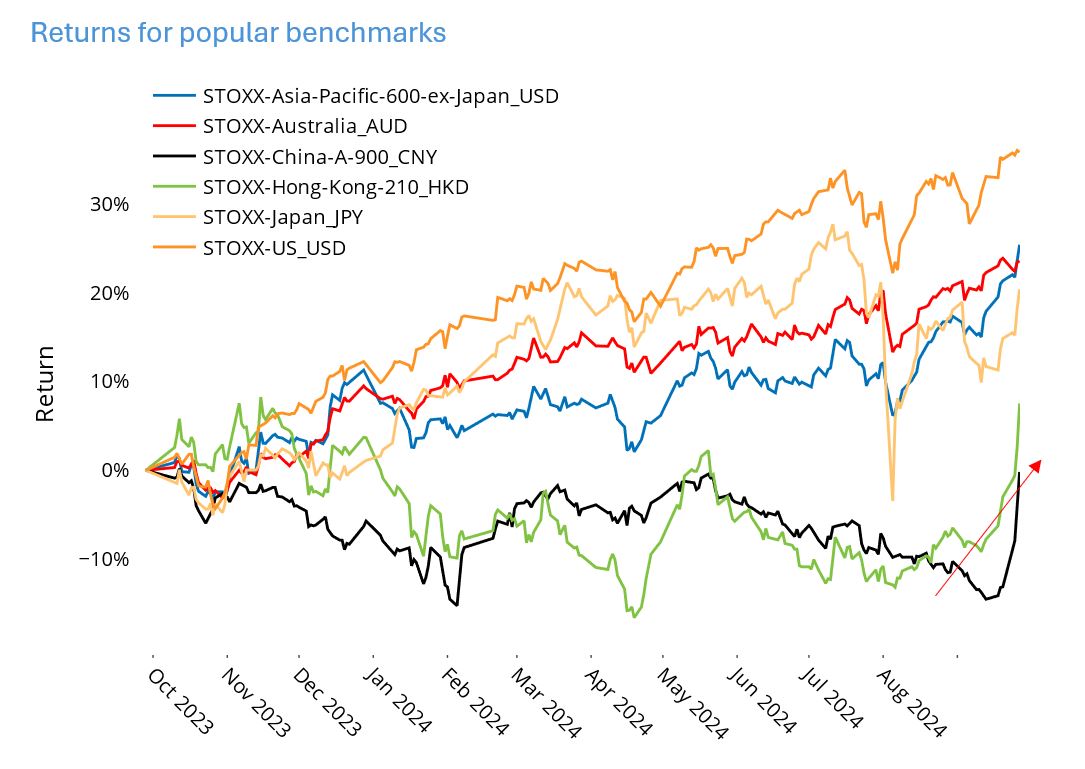
- Chinese, Hong Kong and other Asian Indices saw huge gains last week…
- …driving predicted risk far higher
- Many style factor returns were higher than expected
- And most measures of risk saw big changes
Chinese, Hong Kong and other Asian Indices saw huge gains last week…
The week ending September 27, 2024 was a good one for markets, although one market stood out – China. On the heels of a $114 billion stimulus announcement - though controversial in whether it is broad enough or large enough to actually boost the local economy – the STOXX© China A 900 index rose about 15%, and its year-to-date return became positive, after being down almost 10% since June. The Hong Kong market similarly moved into the black. Other Asian markets rose as well, although not as much as China’s.
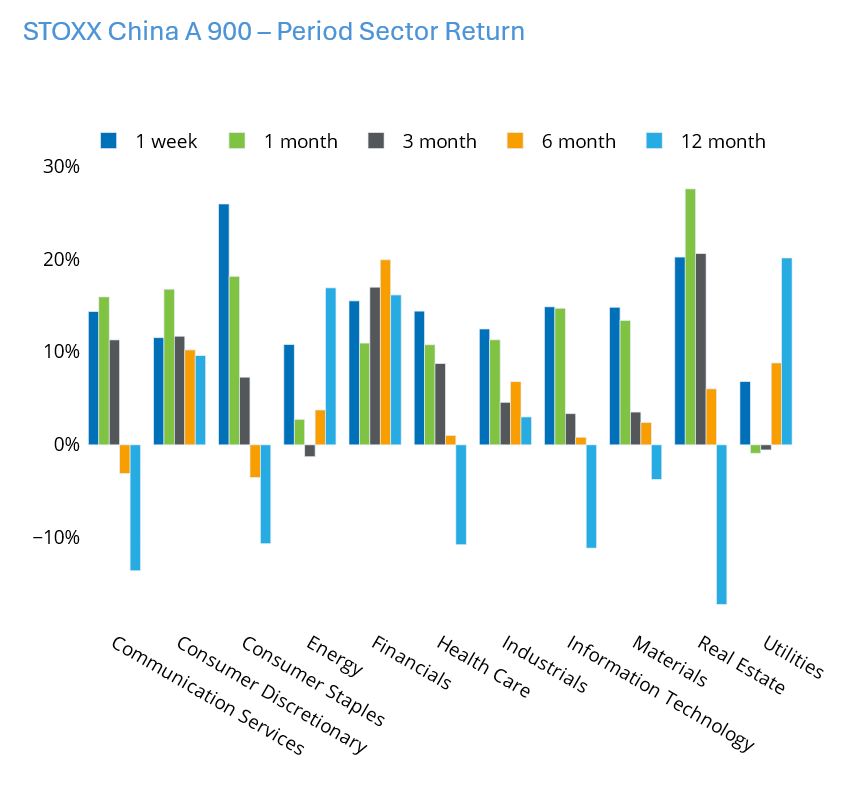
Every sector in the Chinese market participated in the gains. In fact, the differences in return across sectors was relatively small. Consumer Staples rose the most, while Utilities — which has the biggest gain for the last 12 months — lagged the other sectors. Interestingly, Financials had the largest trading increase in trading volume compared with the sector’s average for the year.
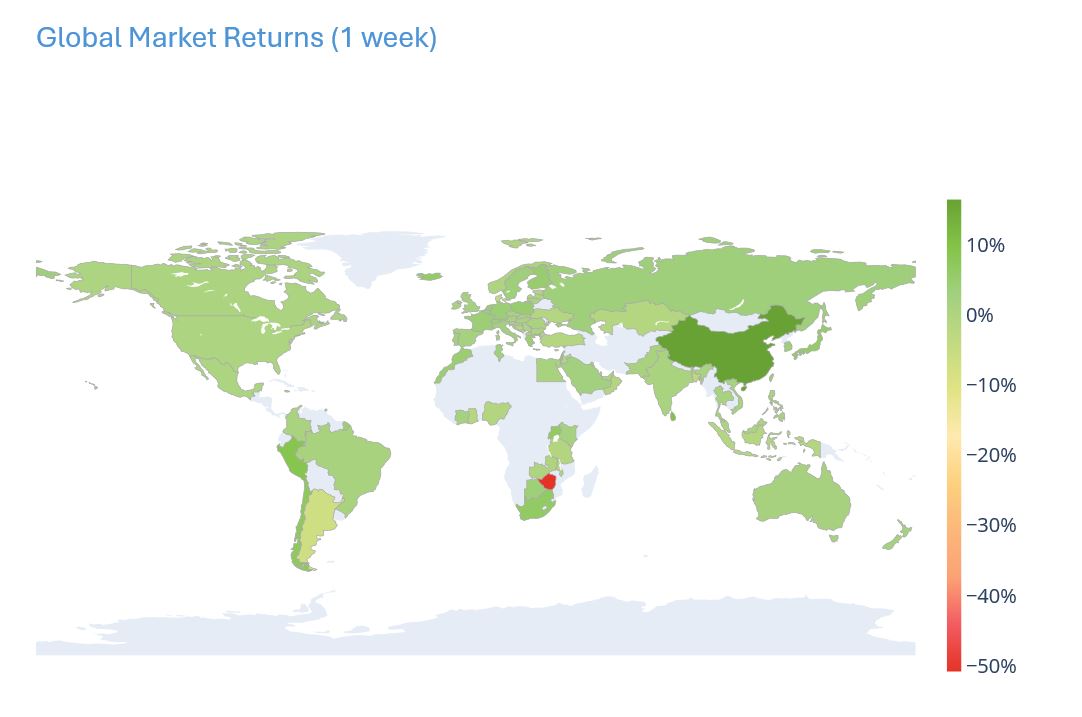
Finally, China also outpaced every other world market last week, as we can see in the world heat map.
See graphs from the STOXX China A 900 Equity Risk Monitor dated September 27, 2024:
…driving predicted risk far higher
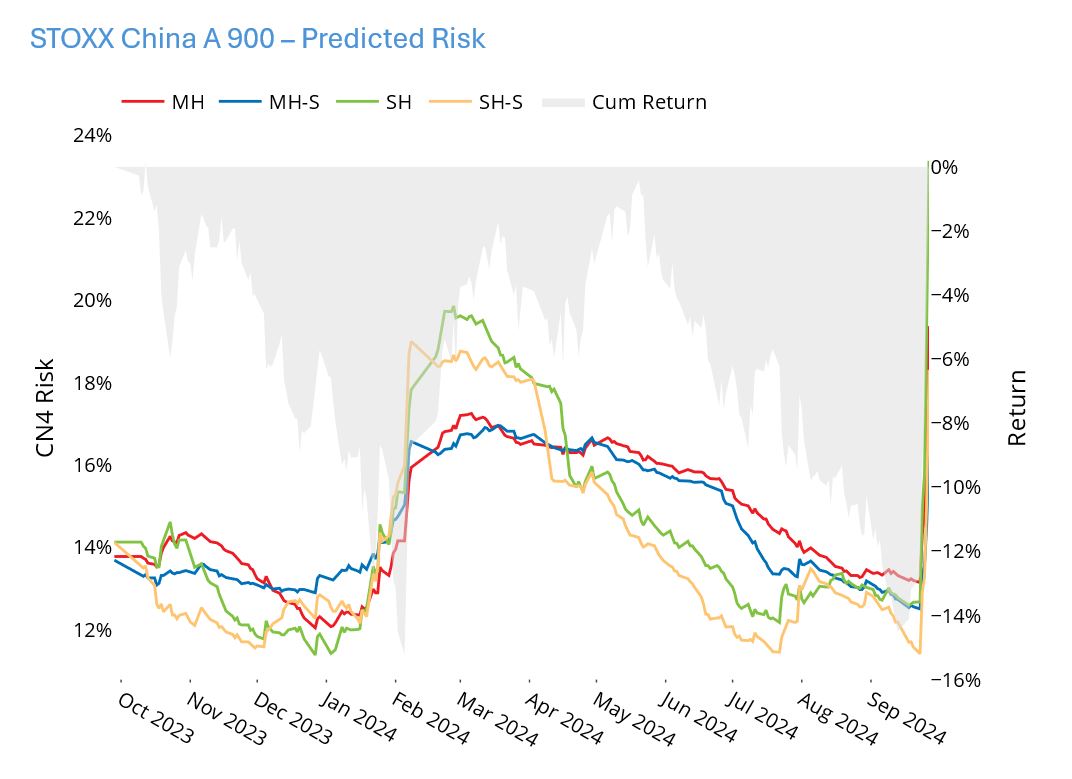
It is far more common to see markets drop suddenly but ratchet up slowly, which means that jumps in risk are far more common as a result of market declines than they are in market “melt-ups.” However, the Chinese market has experienced the opposite, it had a steady drip down over the past few months and then last week’s swift recovery, which was accompanied by a substantial increase in risk. We can see the increase from many different angles and will highlight a few here.
Of the four Axioma China model variants short-horizon fundamental risk rose the most, 10.7 percentage points (from 12.7% a week ago to 23.4% at the end of last week), or about 85%, although all were up substantially. Even if you believe the stimulus will boost equity investor fortunes beyond the gains already achieved and plan to invest now, that potential return now comes with a lot more risk.
See graphs from the STOXX China A 900 Equity Risk Monitor dated September 27, 2024
Many style factor returns were higher than expected
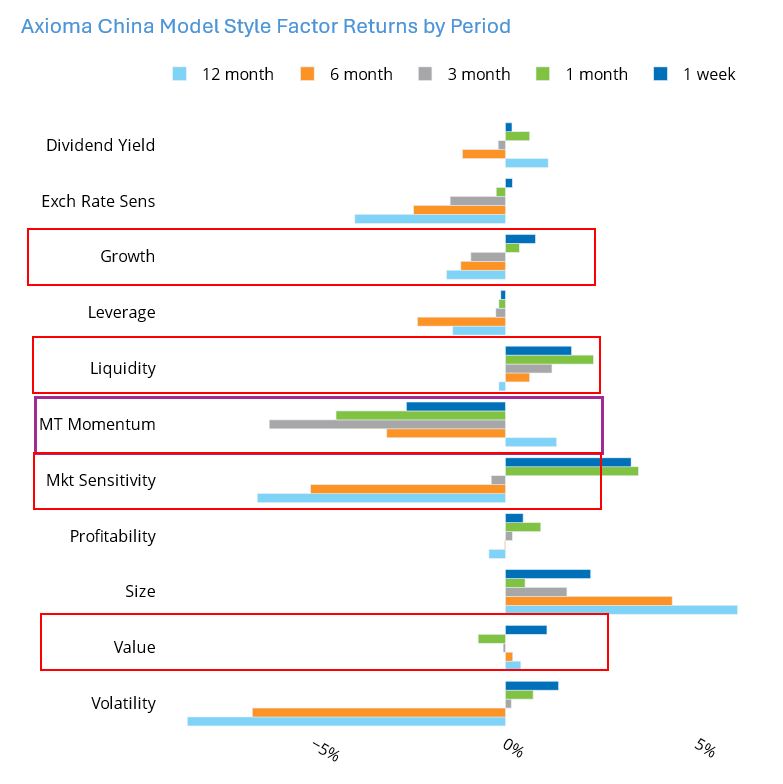
Five of the 12 style factors in the Axioma China fundamental medium-horizon model saw weekly returns of 2-4 standard deviations, where the standard deviation was the expected weekly risk at the beginning of the week. Growth, Liquidity, Market Sensitivity and Value all saw highly positive returns, while Medium-Term Momentum experienced a sharp decline, with a return of more than three standard deviations. The reversal in Momentum is not particularly surprising, as the stimulus was likely to impact the stocks that had been doing the worst.
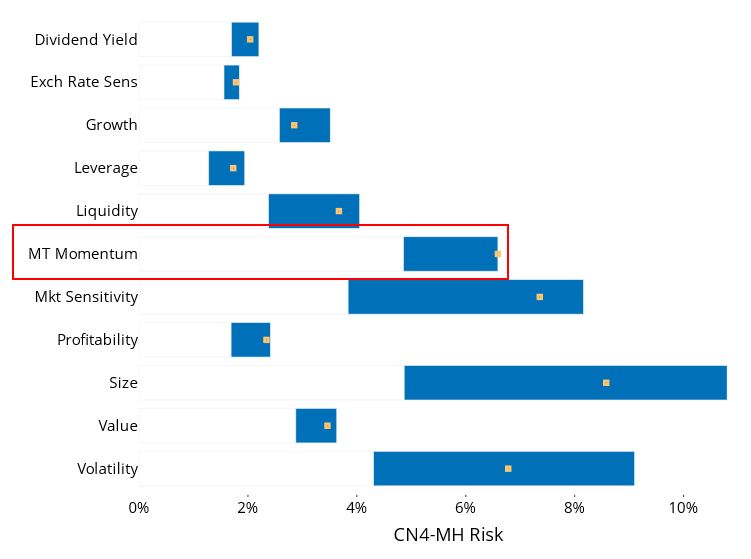
Overall, style factor risk climbed last week, but had been down prior to that, so the increase only brought it back to where it had been over the summer. Most individual style factor volatilities remain within the range they were over the past year, only Momentum’s has reached the high end of its range. Still, it is only the third-highest risk of all the style factors.
See graph from the STOXX China A 900 Equity Risk Monitor dated September 27, 2024:
And most measures of risk saw big changes
Almost every aspect of risk we highlight in the Equity Risk Monitors has changed substantially and it is beyond the scope of this note to include all the charts. You can find them all in the STOXX China A 900 Equity Risk Monitor.
Notably, risk was mainly the result of higher factor volatility, which was in turn driven by both higher stock volatility and higher asset-asset correlations. (See charts 9 and 10)
Risk rose substantially in every sector over the past week. The biggest increase (79%) was seen in Financials which nonetheless remains the least-risky sector. Utilities, the second-least-risky saw the smallest increase, about 25%. (See chart 30)
The Diversification Ratio (which shows the impact of correlations on risk and is a proxy for how well a manager can diversify) for the STOXX China A 900 Index plummeted from 5.5 to 3.5, meaning it is now more difficult to achieve adequate diversification than it was a week ago. However, China’s ratio is now on par with that of other single-country markets such as the US, UK and Australia, and is much higher than Japan’s. (See chart 22)
Dispersion (the cross-sectional standard deviation of five-day returns) shot up as well, to the highest level in at least a year. This means the spread between the best- and worst performing stocks was quite high, and means that those invested in the “right” names stood to gain far more than the overall index return (although those in the “wrong names” may be saying “what market surge?”) (See chart 23)
Finally. trading volume jumped, although remained well below the peak from last spring. As already noted, most of the volume gain came from the financial stocks, while Information Technology had the highest level of volume. (See chart 27)
You may like these
