

EQUITY RISK MONITOR HIGHLIGHTS
WEEK ENDED DECEMBER 13, 2024
US Correlations are very low - what is it telling us?
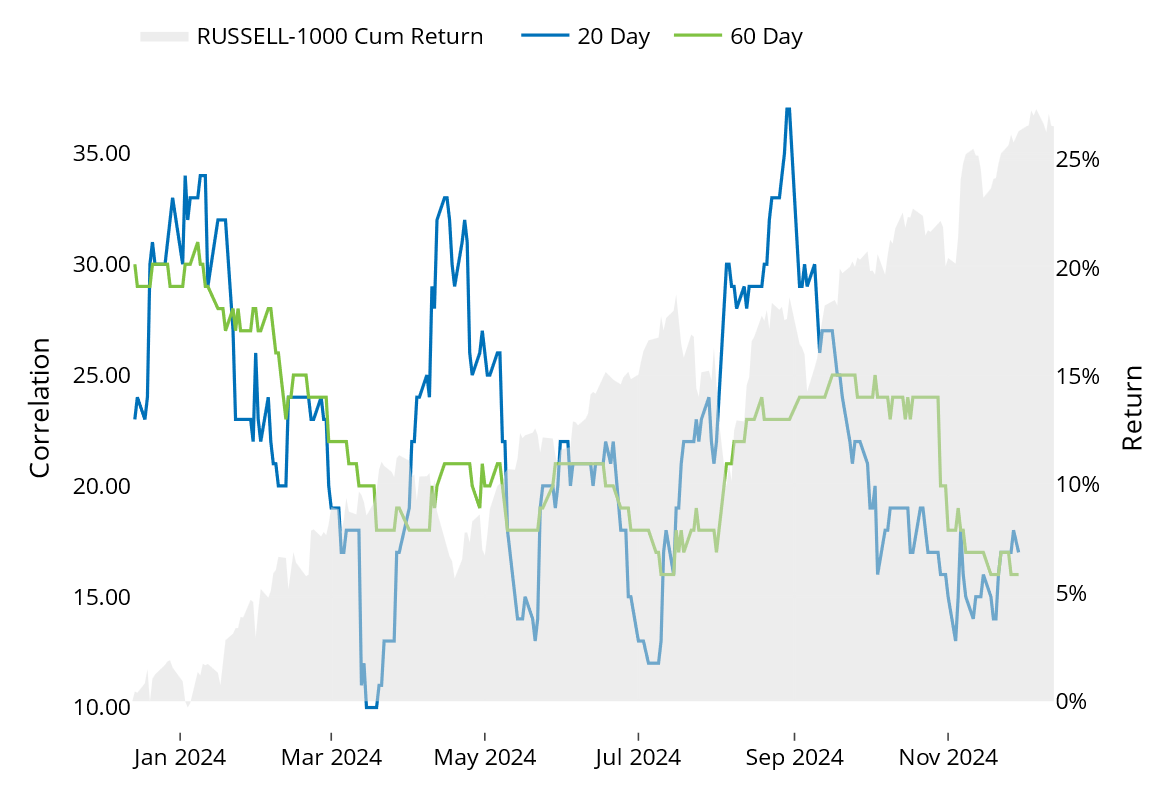
Rolling 60-day average asset correlation inside the Russell 1000 index is as at a YTD low of 0.16. At the same time, the Specific Risk contribution to the index total risk is at the YTD high. This makes sense – as stock returns are based more on individual company characteristics and less on a top-down driver then correlations fall and specific risk should increase.
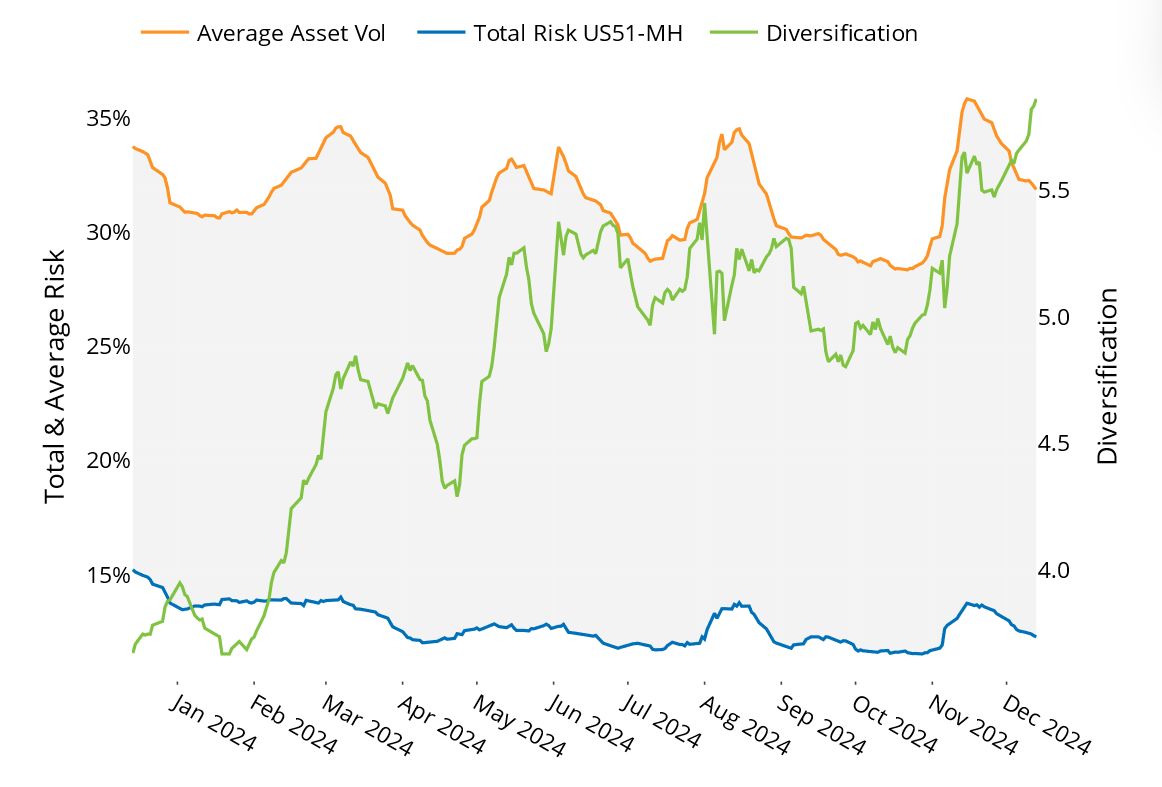
In the risk monitors, we track the overall level of the different components of the index risk forecasts, but not their proportions. The chart below is Chart 8 from the US 5.1 Russell 1000 Equity Risk Monitor as of December 13, 2024:
See Chart 8, Russell 1000 - Components of Risk US 5.1 Risk Monitor, December 13, 2024:
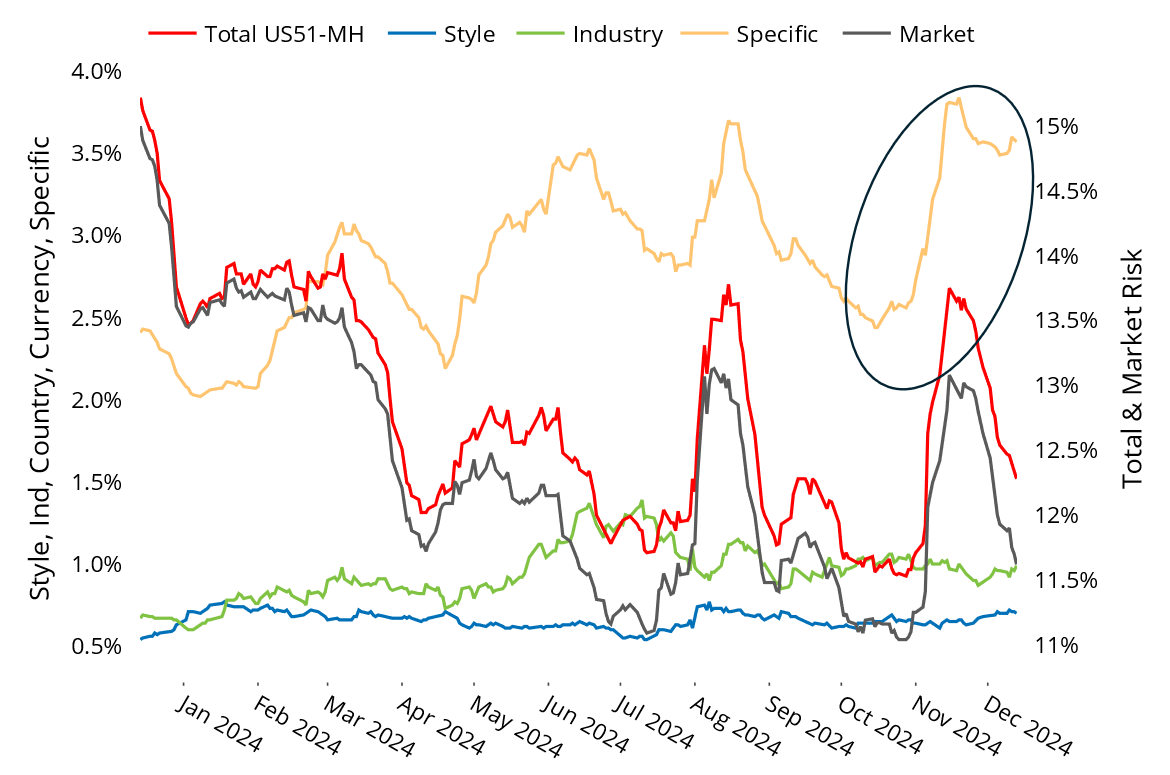
The chart clearly shows the level of specific risk near its YTD high. As the overall risk forecast has come down to about 12.3% from just under 15% a year ago while the level of specific risk has risen, it follows that the proportion of specific risk will have risen as well:
The following chart is not published in Equity Risk Monitors, but is available upon request:
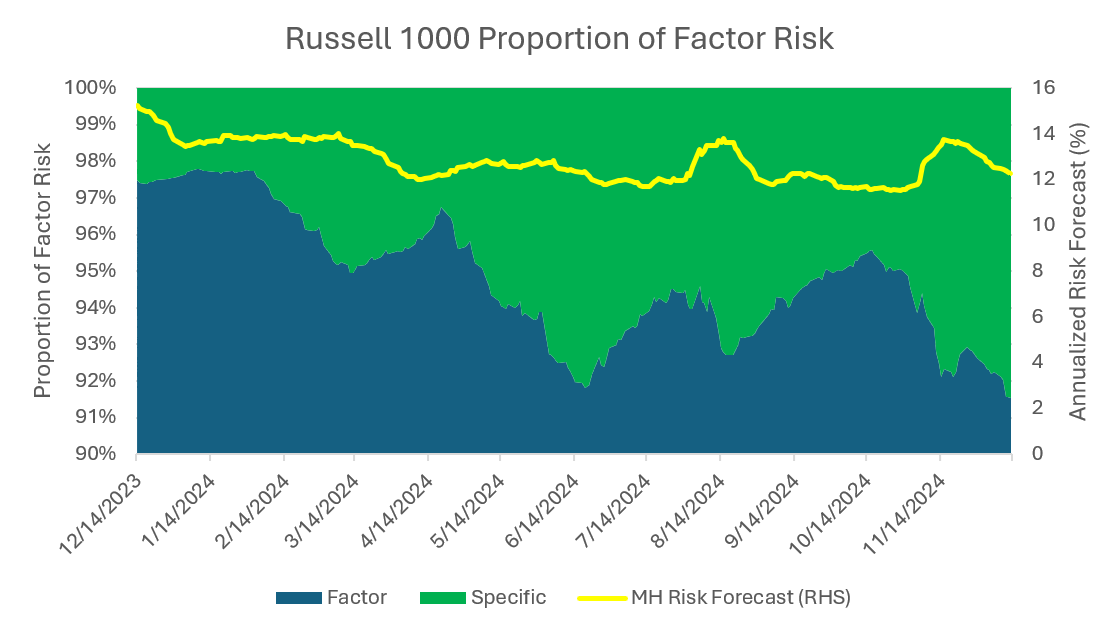
The proportion of specific risk has increased to nearly 8.5% of the total from 2.5% one year ago. The increase in specific risk has been particularly notable in the 4th quarter. This level of specific risk at the benchmark level is unusually high. Active managers may have observed a similar phenomenon in their portfolios, and factor-based investors may want to pay special attention, as they may be getting less factor risk than they expect.
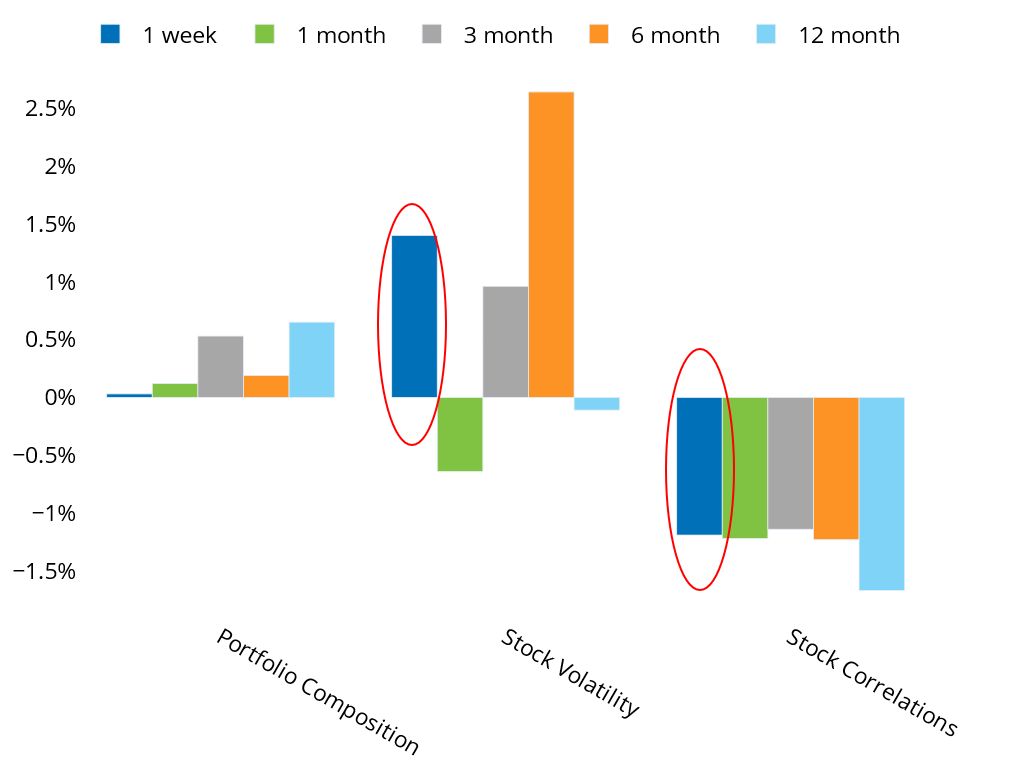
When we look at the one-week change in index risk forecast using the “dense matrix” approach which converts the factor covariance matrix into an asset-by-asset covariance matrix, we see that even though the overall risk forecast increases by 24 bps, mainly driven by the uptick in stock volatility of 140 bps, it is almost completely offset by the contribution from stock correlations of -119 bps.
See Chart 10, US 5.1 Risk Change Decomposition - Dense Matrix, December 13, 2024
It is not often that risk increases in a market while correlations are dropping, but it can be a welcome environment for stock pickers if the risk is in fact idiosyncratic in nature. Larger active positions can be taken because the undiversifiable systematic risk appears to be lower as a proportion of the total, increasing the diversification available amongst large active positions. This also leads to greater diversification benefit in the market as a whole, demonstrated by the highest Index Diversification ratio we have seen in the US not only over the last year, but in fact since early 2018:
See Chart 22, US 5.1 Risk Monitor - Russell 1000 Diversification Ratio - December 13, 2024
Lastly, when we look at the Predicted Risk Charts for the US4 models, we see that the Stat-Fundamental spreads are quite wide, particularly at the short horizon, suggesting there may in fact be a factor or factors not incorporated in the fundamental models that is driving risk currently, maybe a change-of-administration factor, or a market-concentration factor:
See Chart 7, US4 Risk Monitor - Predicted Risk December 13, 2024:
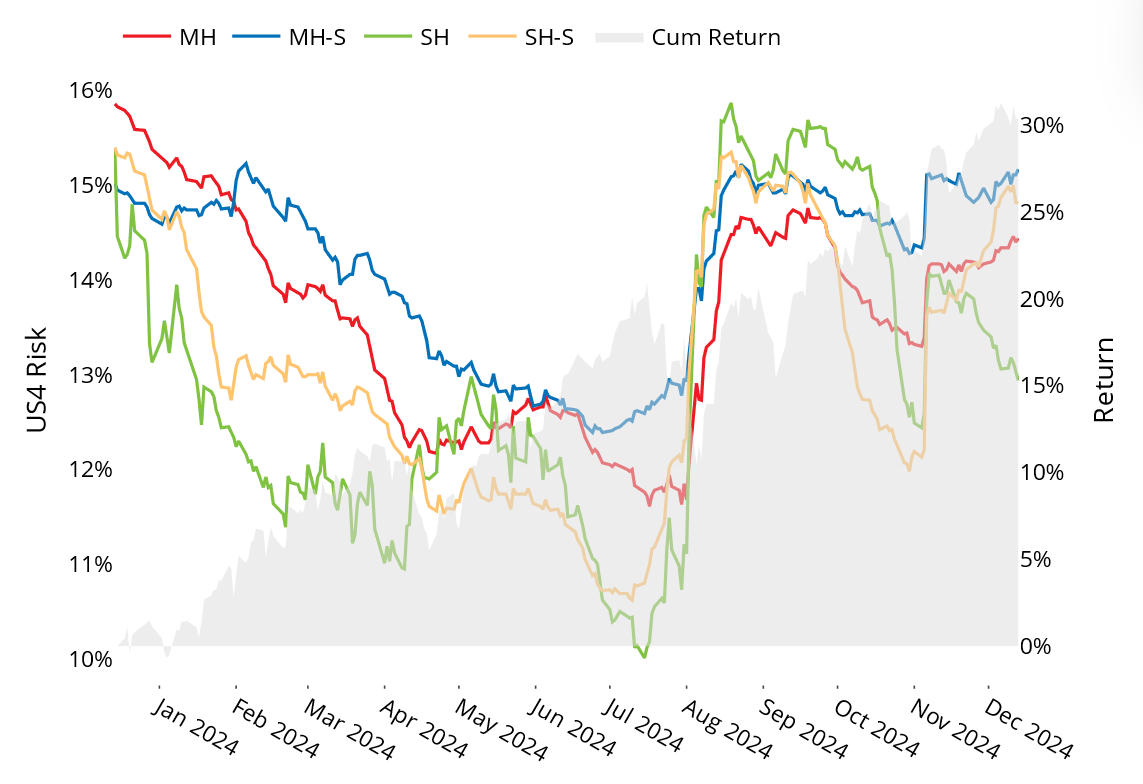
While we don’t show the proportion of factor to specific risk here, if the statistical models show a higher proportion of factor risk and a higher level of risk, that would be indicative of transitory systematic risk that the fundamental models may be missing.
You may also like


