
EQUITY RISK MONITOR HIGHLIGHTS
WEEK ENDED MAY 23, 2025
- Nosediving Correlations- Crisis Over or a clearer picture of winners and losers?
- Despite renewed macroeconomic threats risk has fallen
- Exchange Rate Sensitivity: the US Dollar and the Market
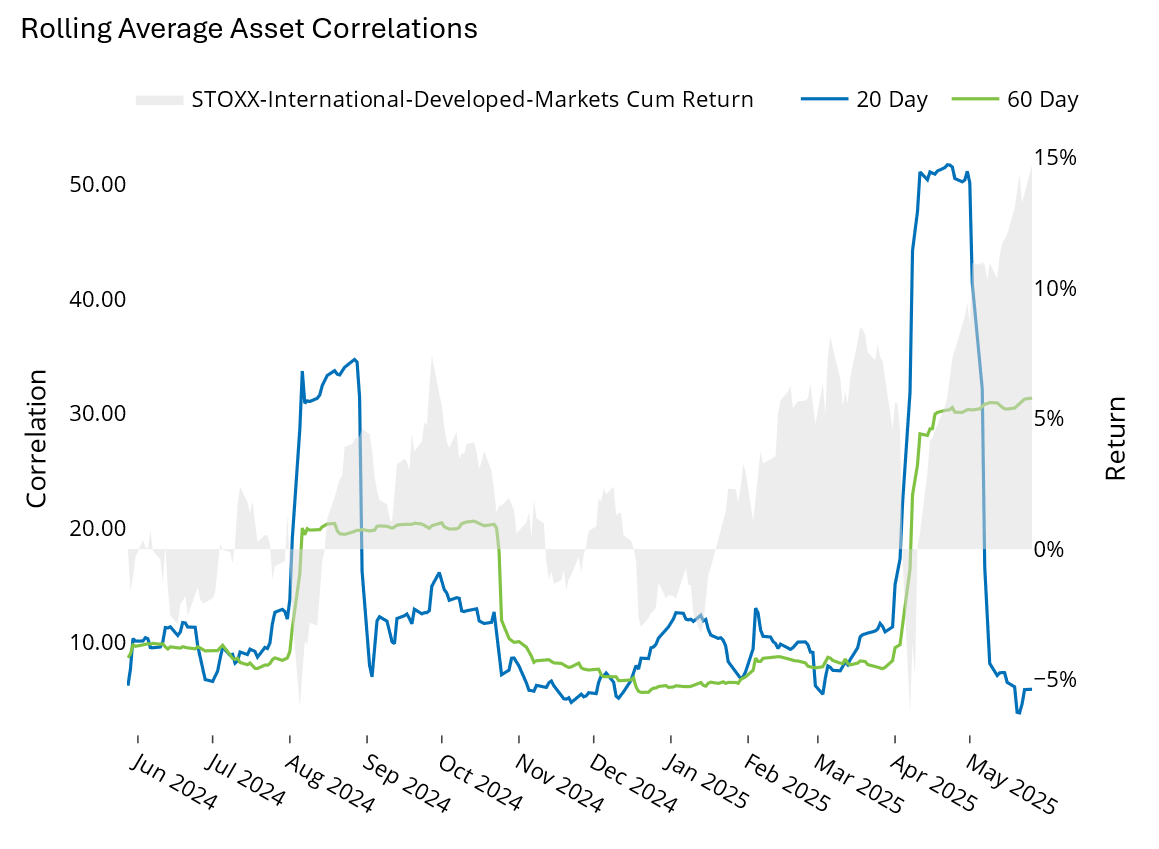
Correlations have fallen to 12-month lows
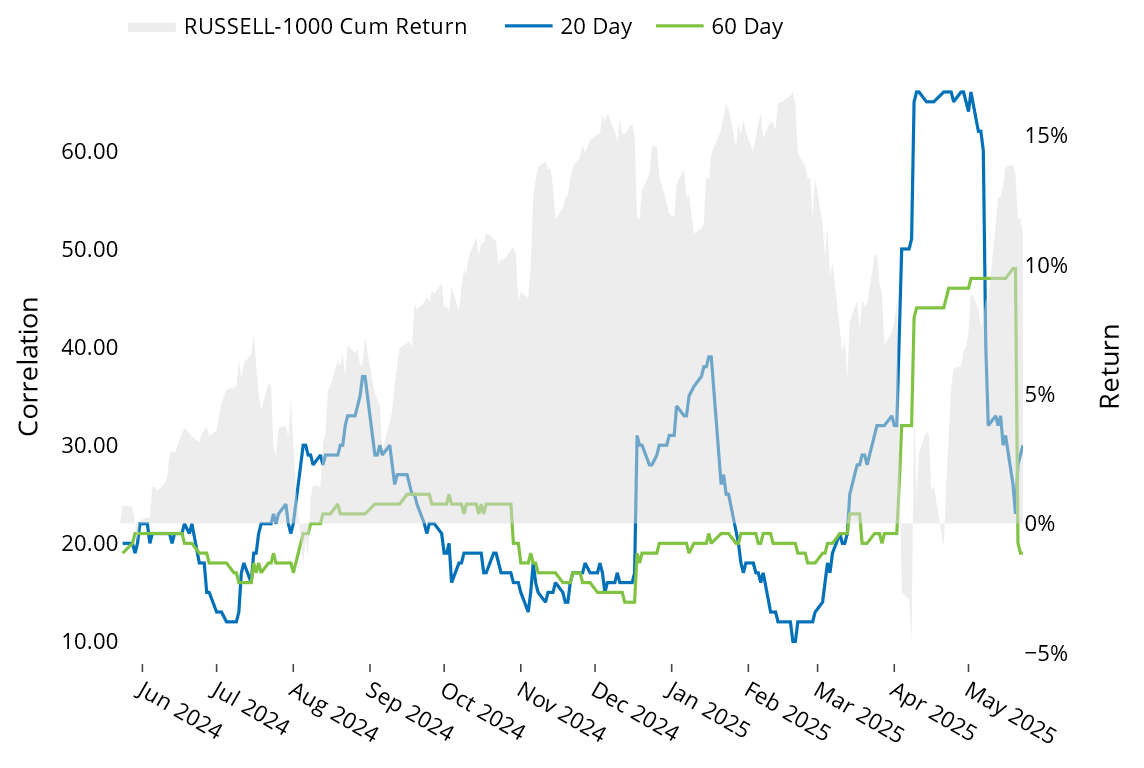
As predicted and realized risk rose in markets across the world rose throughout April and the beginning of May, the typical “risk-off” signal of rising 20-day rolling pairwise correlations got as high as 0.52 in the STOXX International Developed Markets ex-US, and as high as 0.66 in the Russell 1000 index. As of May 23rd, those average levels have dropped precipitously, down to just 0.06 in DMxUS index and 0.30 in the US.
See charts from the STOXX International Developed Markets and Russell 1000 Equity Risk Monitors of May 26, 2025:
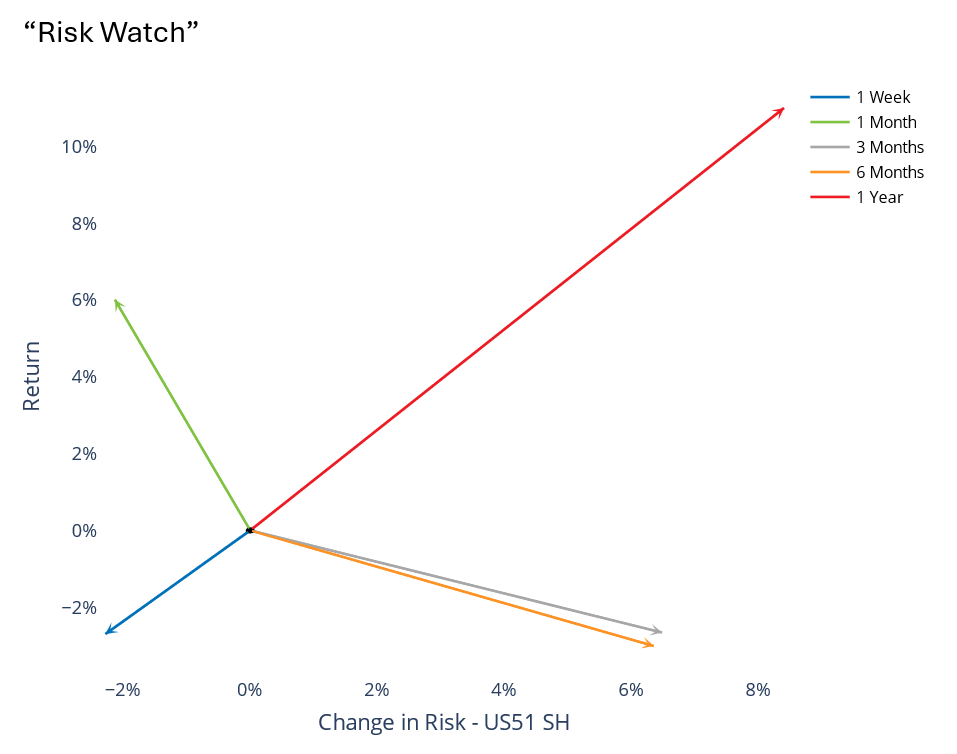
Despite renewed macroeconomic threats, risk has fallen
In general, even as renewed tariff threats and a credit downgrade hit the markets last week, investors seemed to take it mostly in stride, with US markets down less than 3% and the DMxUS index up about 1.4%. Even with the negative weekly return, predicted risk continued its rapid descent in the US.
See chart from the Russell 1000 Equity Risk Monitor of May 23, 2025:
Exchange Rate Sensitivity- the US Dollar and the Market
The US Exchange Rate Sensitivity factor has had an exceptionally strong return over the last 12 months. This factor measures the time-series sensitivity of a stock’s return to the return of the US Dollar vs. a basket of foreign currencies net of the market effect. This runs counter to expectations; with a weakening dollar we would expect stocks most exposed would fare poorly. But there seems to be another factor at play here. While the dollar has been volatile as we enter a new global trade regime, Exchange Rate Sensitivity has become highly correlated with the Market Sensitivity factor (comparable to beta), which in turn has become highly correlated with the DXY dollar index:
The following charts are not included in the risk monitors but are available on request.
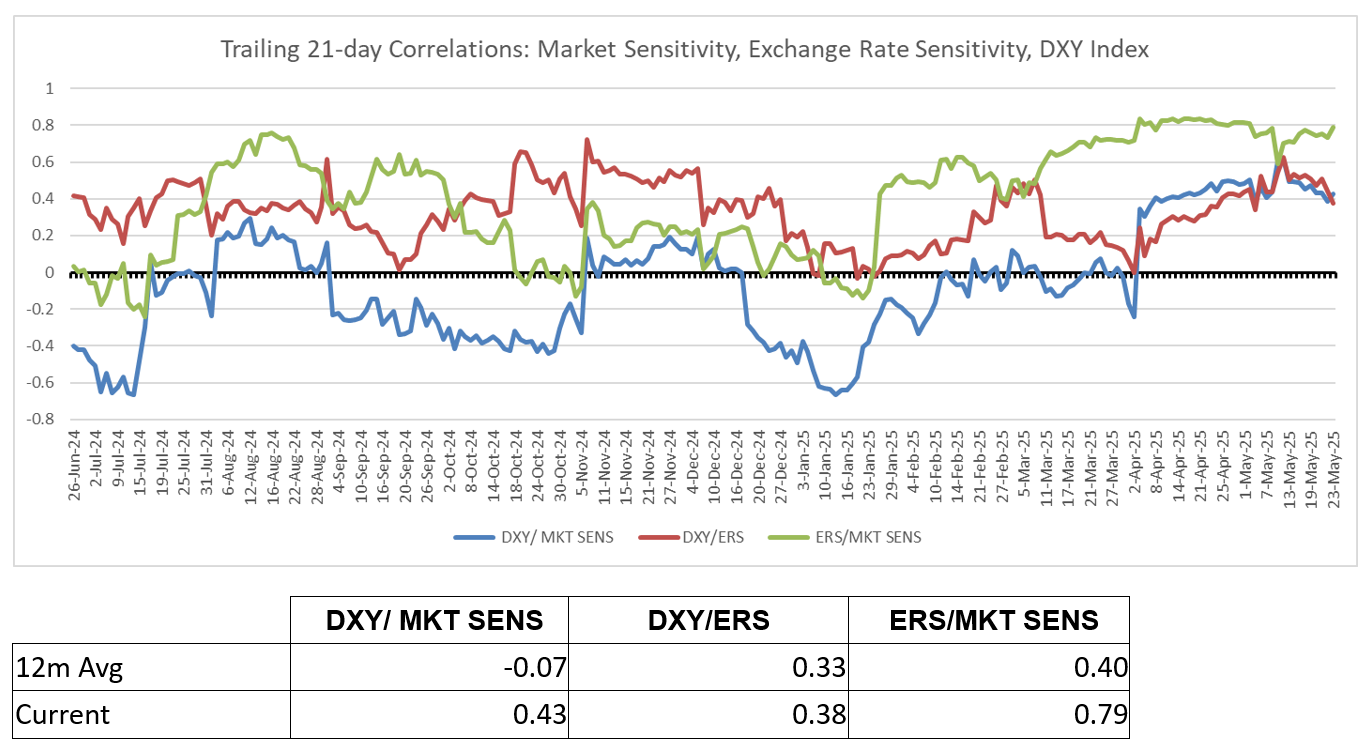
The correlation of Market Sensitivity and Exchange Rate Sensitivity hit a 20-year high of 0.78 last week! While this is high relative to the last 12 months, the long run average correlation between these factors is close to zero, so what is this telling us? High beta stocks (unit exposure to Market Sensitivity) don’t necessarily have positive exposure to the Exchange Rate Sensitivity factor (cross-sectional correlation of the factor loadings on 23 May are effectively zero). We would expect a strong positive correlation between the Exchange Rate Sensitivity factorand the DXY index, but not necessarily with the Beta factor. Yet from a cumulative return perspective over the last 12 months, Exchange Rate Sensitivity looks like a less-volatile version of Market Sensitivity:
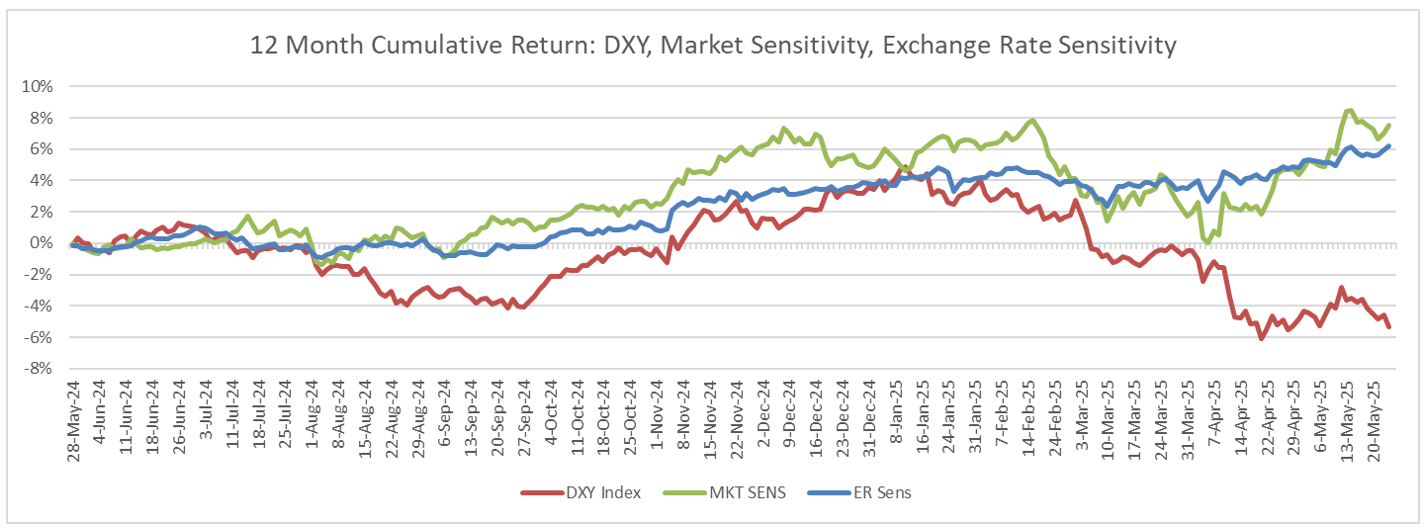
But it is not the same companies driving these factor returns, so this has meaningful portfolio construction considerations. High beta companies appear to have positive correlation to the dollar, regardless of whether their business involves trade of goods or overseas delivery of services. We intend to study this phenomenon more thoroughly in an upcoming piece.
You may also like


