

Factors and the “R” Word
WW5.1 model insights on recession factor behavior
Author
Melissa R. Brown, CFA
Investors are starting to worry about a recession. If it happens, what can we expect from factor performance?
Recent loss of consumer confidence, concerns about the impact of tariffs and trade wars beyond just driving inflation higher, general market uncertainty and even comments by the US president have raised concerns that the US economy is about to enter a recession. As of April 9, 2025 the Atlanta Fed Nowcast predicted growth of -2.4% in the first quarter, confirming that GDP growth could be negative this quarter. And, as the old saying goes, “when the US sneezes the world catches a cold”.
Investors are rightfully concerned, as recessions and bear markets are closely linked. While many have started to look for safe havens, others want to or need to remain invested in equities. Of course we remain strong believers in the benefits of factor investing, and therefore thought it could be instructive to look at factor performance in periods leading up to and immediately after recessionary periods, using the factors in our new Worldwide WW5.1 equity risk model.
Key findings across different recession periods
Data for this model starts in January 1995, and on a positive note (for participants in the world economy) we have only experienced three official US recessions in the subsequent 30 years, although the one related to the Global Financial Crisis was quite a doozy. The others were the economic decline linked to the burst of the internet bubble in 2001 and the COVID-related contraction in 2020. That is not enough observations to make any kind of firm conclusions, but can still provide a guide for us. We attempted to answer a few questions:
- Can performance in the period leading up to the economic slowdown be a harbinger of what is to come?
- Do factors behave differently in the periods before and after the economic bottom?
- Are factor returns significantly different in one or both of those periods as compared with their long-term averages?
We might expect to see rotation in popular stocks as the economy slows down, and therefore a downturn in the performance of Momentum. Investors may also seek out safer names, and therefore low volatility strategies or those leaning on more profitable companies may perform better than average. The optimism of investors as we come out of a recession may lead them to seek risk, buying small-caps, cheap names that would benefit from economic expansion, or more volatile stocks. These are just some of our priors – we wanted to see what the data would tell us.
Factor performance and investment implications
What we found confirmed some of our expectations, but not all.
- There was little consistency across the three periods, which is not all that surprising given the very different natures and causes of the recessions.
- Preceding the 2001 recession, Earnings Yield and Value fared unusually well, with returns that were significantly higher than their long-term averages. Similarly, Profit Quality experienced a high return. The “Internet Bubble” had already burst, and these factors that had been largely out of favor came back with a vengeance. That performance continued after the economy bottomed out. In contrast, Medium-Term Momentum had a negative return for the six months leading up to March 2001 as the stocks leading the market shifted, but its return bounced back as the economy started on a growth path again. While the returns both before and after the trough were not statistically significantly different from average they were still worth noting.
- We might have expected more factors to go “haywire” in advance of the Global Financial Crisis-related bottom in December 2007 (remember the August 2007 Quant crisis?). We did not see this in the WW5.1 model, with just a few factors’ returns statistically different from the long-term average and only Investment having the opposite sign. Although these six-month figures do not suggest that factors can predict a downturn, we believe that if factors do behave very differently than expected in the short run, or if we see a sudden change in factor volatility, they may be telling us about a change of heart on the part of investors. But that is a blog post for a different day.
- The recession related to COVID was short-lived and clearly driven by an exogenous factor that investors were unlikely to have anticipated. The most notable significant factor return was the high shortfall in Dividend Yield, driven by investor fears that companies, especially those with the highest yields, would not be able to pay their dividends. The unusually positive return to the Investment factor is somewhat puzzling, while the negative return to Earnings Yield coming out of the recession was more understandable, as investors continue to be concerned about the ability of companies to achieve their earnings goals. Perhaps the Investment return reflected investor expectations that those companies who over-invested would be better positioned for recovery.
- Measures of volatility were more consistent across the three recessions as investors shunned volatility: Downside Risk, Market Sensitivity and Residual Volatility returns were negative on average in the period leading up to the bottom. Market Sensitivity had the most negative return prior to the 2001 trough (most negative of the three instances and most negative among all factors). However, its return was positive before the 2007 bottom.
- Climbing out of the economic nadir, investors remained cautious, continuing to favor lower-risk stocks (and/or shun those with higher volatility).
For style investors these results bear some good news: most factors’ returns are not significantly different from the long-term average in the period preceding economic troughs or the period coming out of them. A consistent approach, with positive tilts on factors with positive expected returns based on their long-term averages, and negative tilts on factors with negative payoffs, remains likely to produce benchmark-beating performance.
How should investors position their portfolios if they are concerned we are due for the next economic downturn? With the exception of perhaps lowering exposure to Downside Risk, they should probably continue to follow their disciplined process as is.
Table 1: WW5.1 factor returns before and after the last three recessions
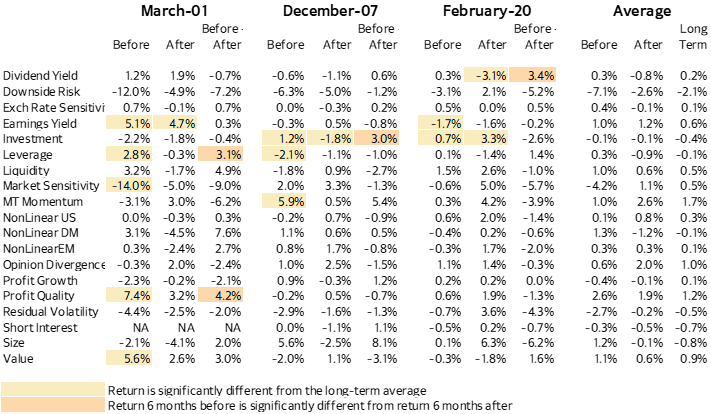
Significance is defined as a p-value of less than 5% (there is less than a 5% chance that the averages came from the same distribution).
Before: 6 months before the official recession month. After: 6 months after.
Long term average is the average 6-month return.
"For style investors these results bear some good news: most factors’ returns are not significantly different from the long-term average in the period preceding economic troughs or the period coming out of them."