
EQUITY RISK MONITOR HIGHLIGHTS
WEEK ENDED MAY 30, 2025
- Markets were strong in May as investors ignored the old saw, “Sell in May and go away”
- May factor returns: investors sought higher risk, larger size
- Trading volume dipped recently, but remains higher than the 12-month average for most sectors
Markets were strong in May as investors ignored the old saw, “Sell in May and go away”
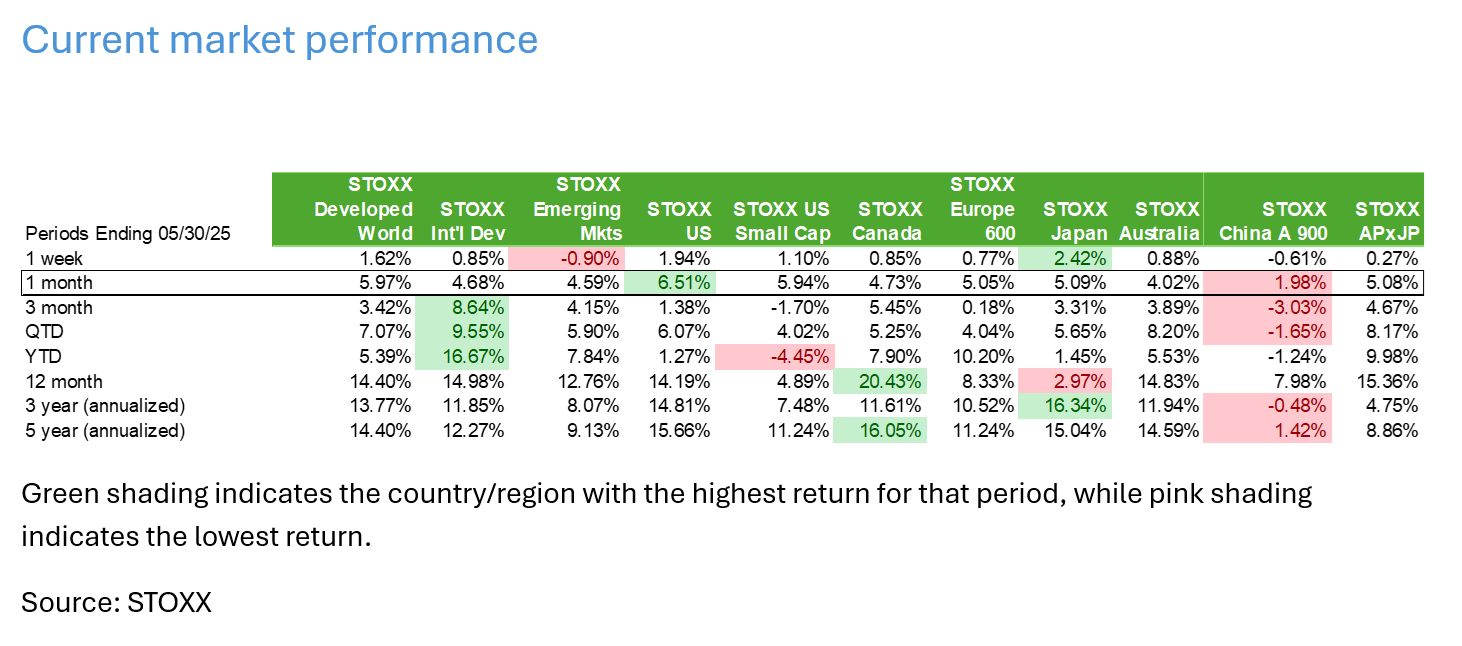
Most major markets saw strong positive returns during May. The US led the pack, with the STOXX US® Index up about 6.5%, but even the STOXX International Developed Markets® and STOXX Emerging Markets® Indexes gained more than 4%, and the STOXX China A 900® was up just under 2%.
Year to date, the STOXX International Developed Markets® Index (encompassing developed markets ex-US) has seen by far the most strength with a return of almost 17%. The US pales in comparison, with the STOXX US Index up just over 1%, and the STOXX US Small Cap index down more than 4%. China, too, has lagged this year as investors sort out the impact of tariffs on corporate profits, inflation, etc. New announcements of tariffs on European products imported to the US may change the trajectory there as well, but as of month end investors seemed to be expecting the biggest impact on the US and China.
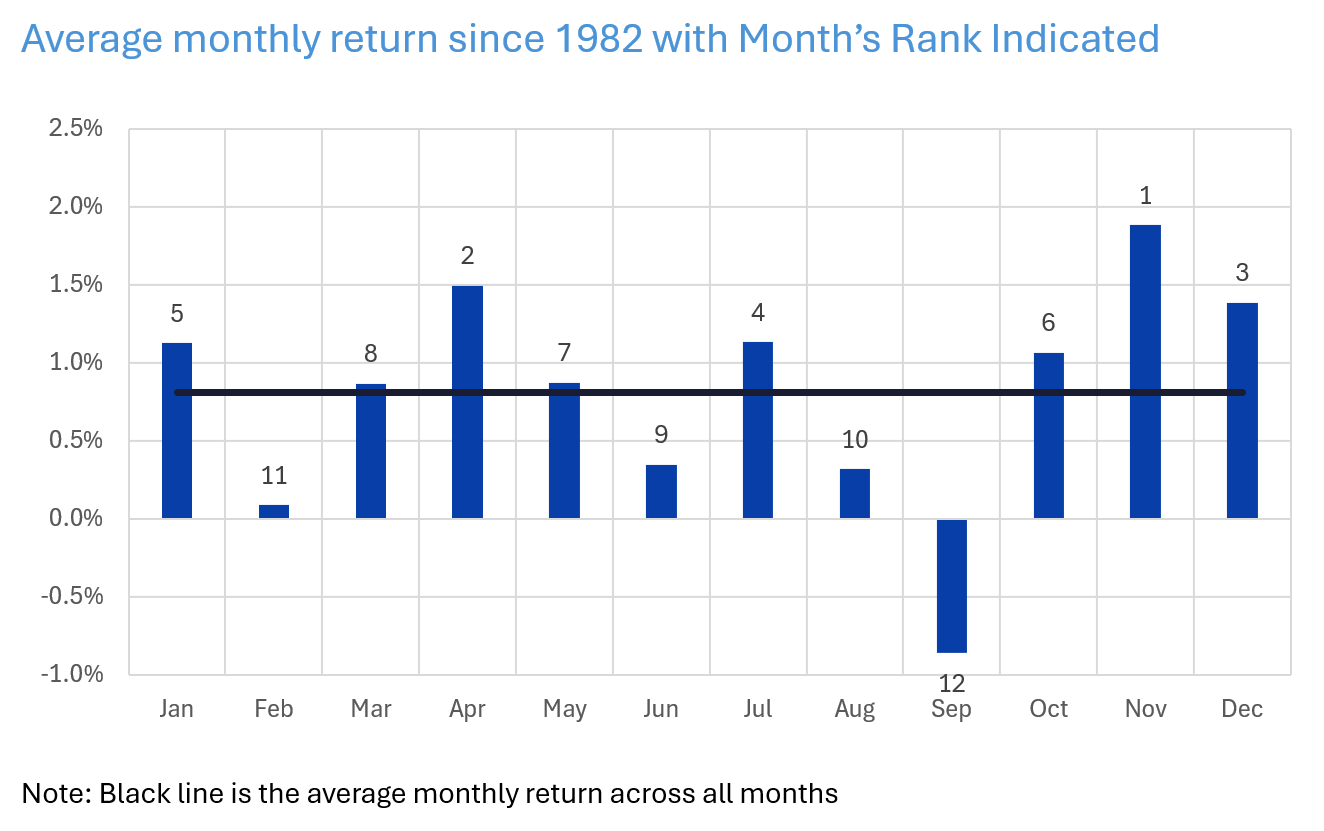
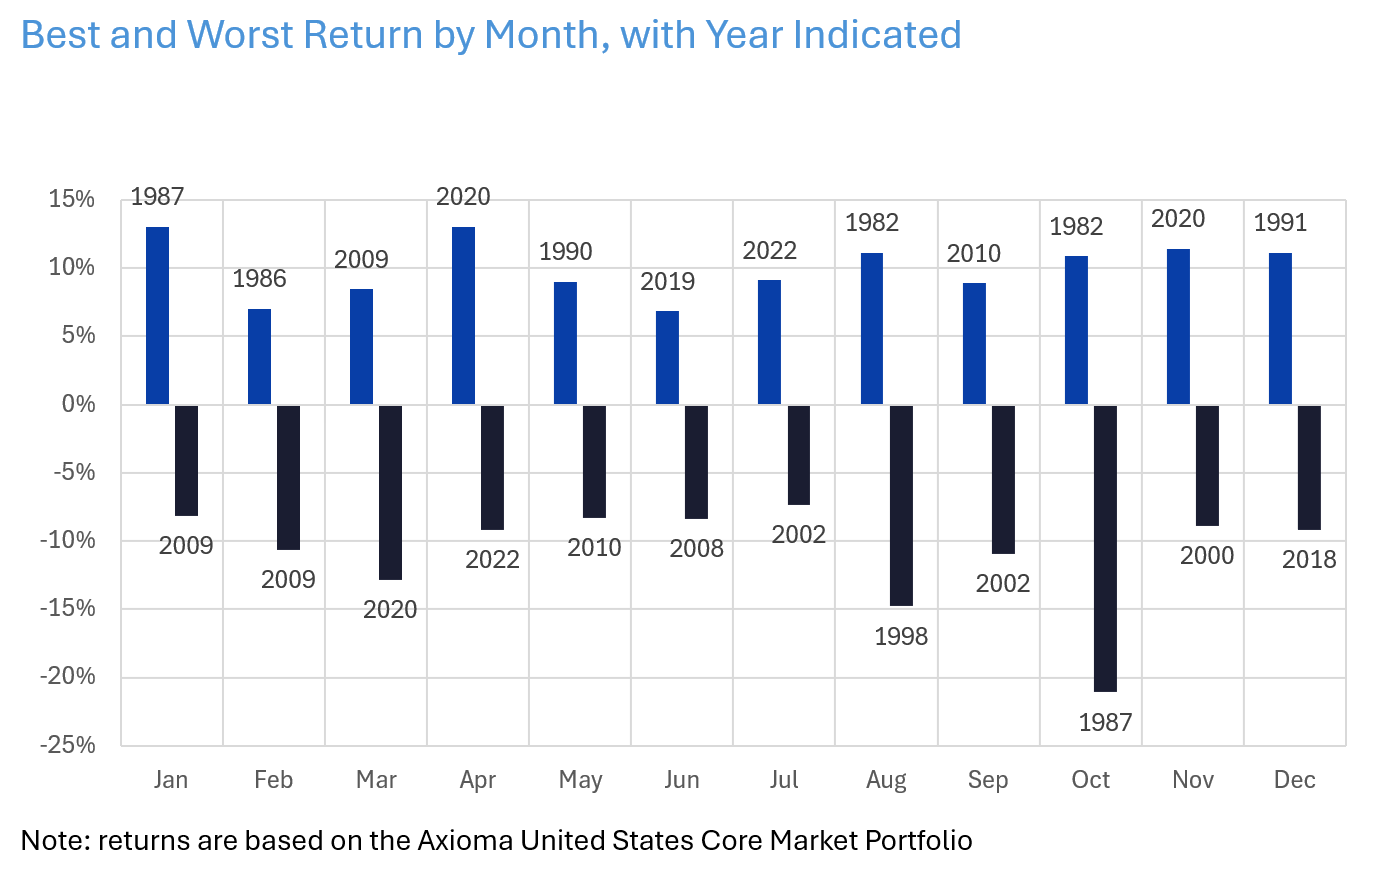
Given equity market strength last month, does “Sell in May and go away” still hold? We found that yes, it seems to. A simple calculation of average monthly returns for the US market going back to 1982 confirms that average returns in June, August and September have indeed been lower than the overall monthly average over that 43 year span . In addition, the highest monthly returns (about 13.1%) were in January (1987) and April (2020), whereas June never saw a return higher than 6.8%. The worst months in our available history were in August 1998 (-14.8%) and especially October 1987 (-21.1%). So “sell in May and go away” may not always be the best strategy, and of course timing is everything, but it is interesting to note that an adage coined many years ago still makes sense.
The following charts do not appear in the Equity Risk Monitors but are available on request:
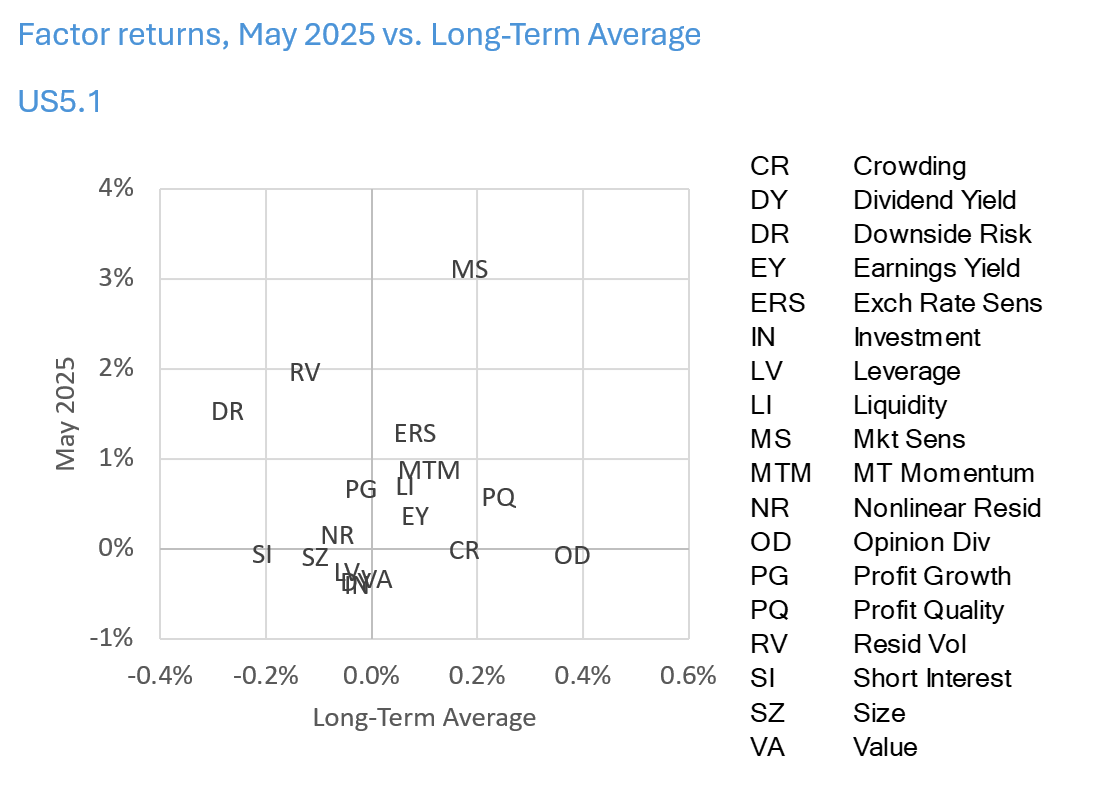
May factor returns: investors sought higher risk, larger size
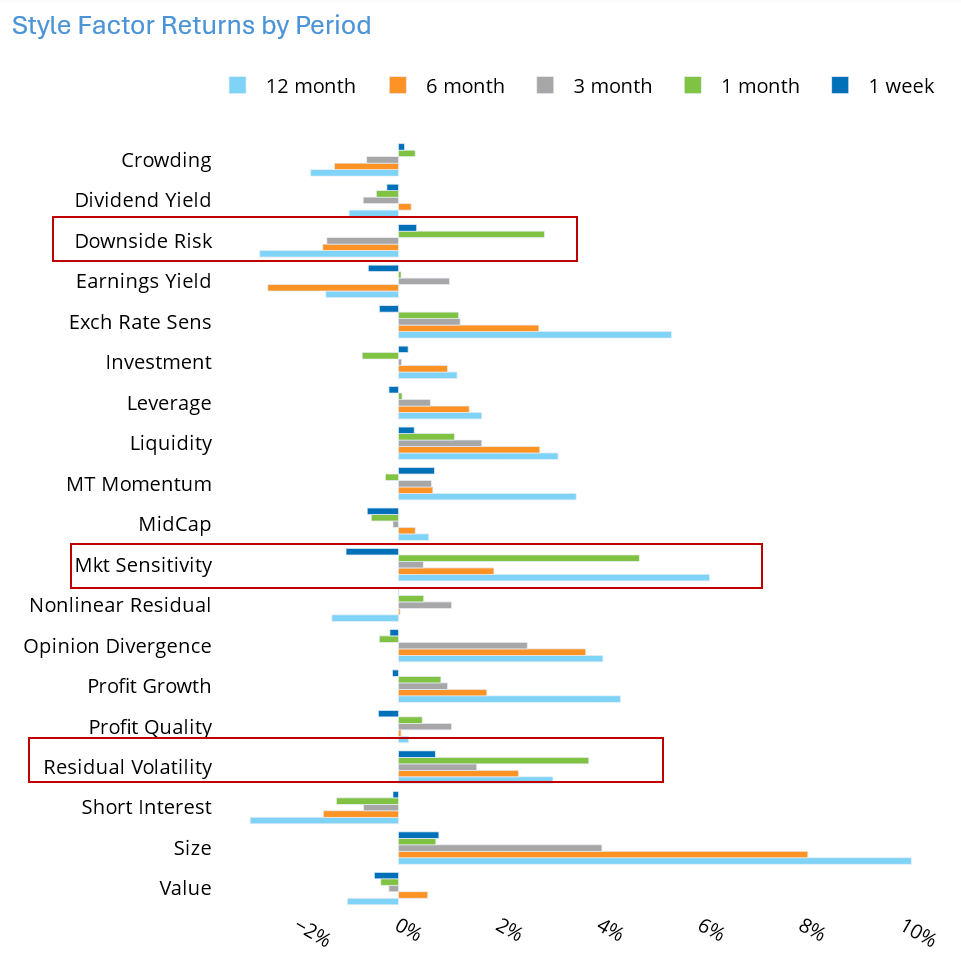
According to the AxiomaUS5.1 model, a number of factors had returns in May that were larger than expected given the risk forecast at the beginning of the month. Even more notable was the decided risk-seeking behavior as the market retraced its path, hoping that tariffs would be lifted or at least paused, against a backdrop of otherwise good economic news. Downside Risk, Market Sensitivity and Residual Volatility each produced highly positive returns that were more than two standard deviations away from the expectation at the beginning of May. For the five days ending May 30 that strength continued for Downside Risk and Residual Volatility, while Market Sensitivity gave back some of its gains.
While most other US5.1 factors’ returns were within risk expectations for May, in general, their magnitude was higher than we see over the long-term average. We note that Medium-Term Momentum fell slightly in the month although recovered last week. Investors continued to prefer larger cap names and those with high Profit Growth and Profit Quality (although both reversed last week). Stocks with high Crowding exposure, which had been shunned earlier in the year, came back, and stocks with high Short Interest fell, as expected, and what those who are short the stocks hope for. Overall, most US factors’ May returns were in the same direction as their respective long-term averages, while Downside Risk and Residual Volatility were major exceptions.
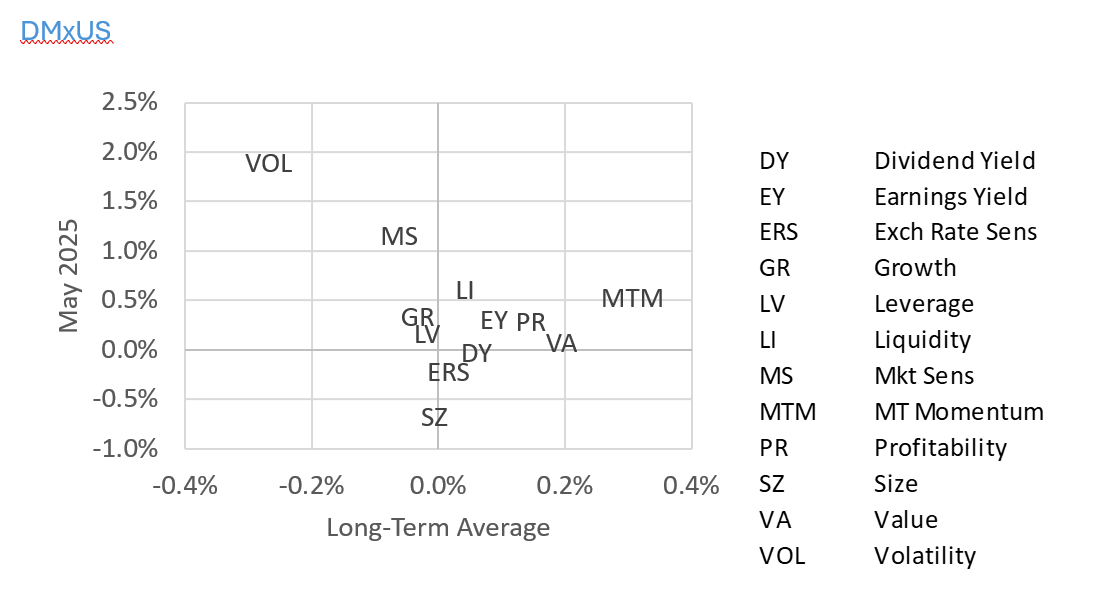
Outside the US we see a similar picture of return directions, although the magnitude was more in line with long-term average levels. High Volatility and Market Sensitivity fared extremely well (opposite to expectations based on long-term performance that their returns would be negative) while other factors’ returns were generally in the same direction as their long-term averages. The biggest difference between the US and Developed Markets ex-US was in the Size factor return, which was quite negative outside the US.
It has been our experience that when factors produce high magnitude returns in the opposite direction of expectations based on long-term averages it can be a harbinger of a turning point in the market. In May we saw the high magnitude but not the unexpected direction, which could be good news for equity markets, at least for now.
See chart from the US5.1 Equity Risk Monitor from May 30, 2025:
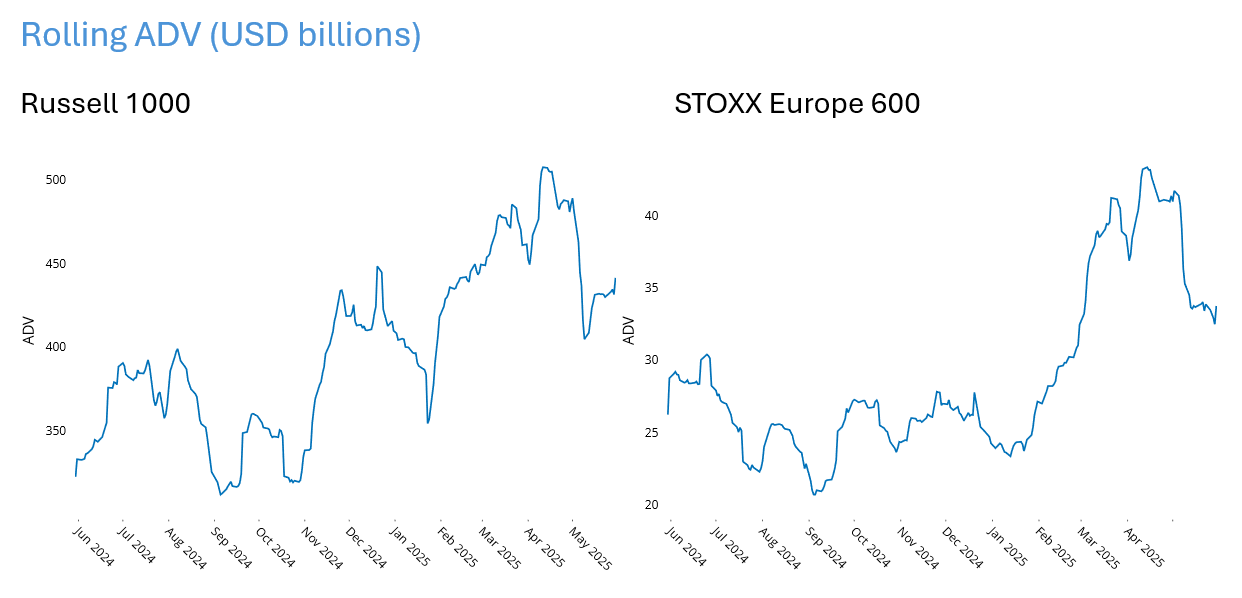
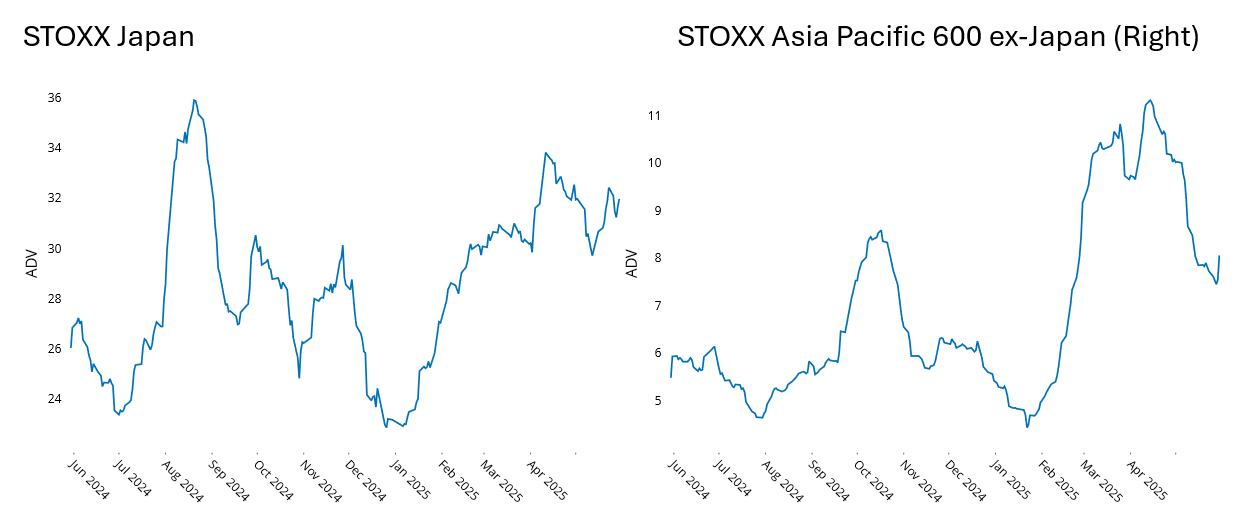
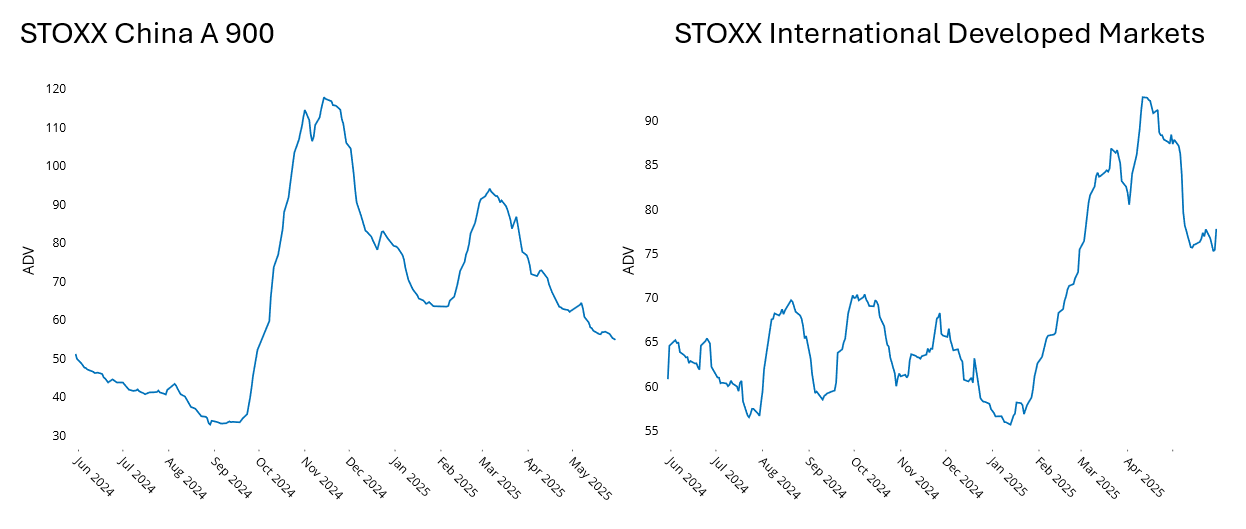
Trading volume dipped recently, but remains higher than the 12-month average for most sectors
As noted, May was a good month for equity investors, and factor performance suggested a clear “risk-on” stance. However, we note that trading volume dipped during the month of May in many markets, so recent market strength was accompanied by declining volume in most of the markets we track closely, with the exception of STOXX Japan.
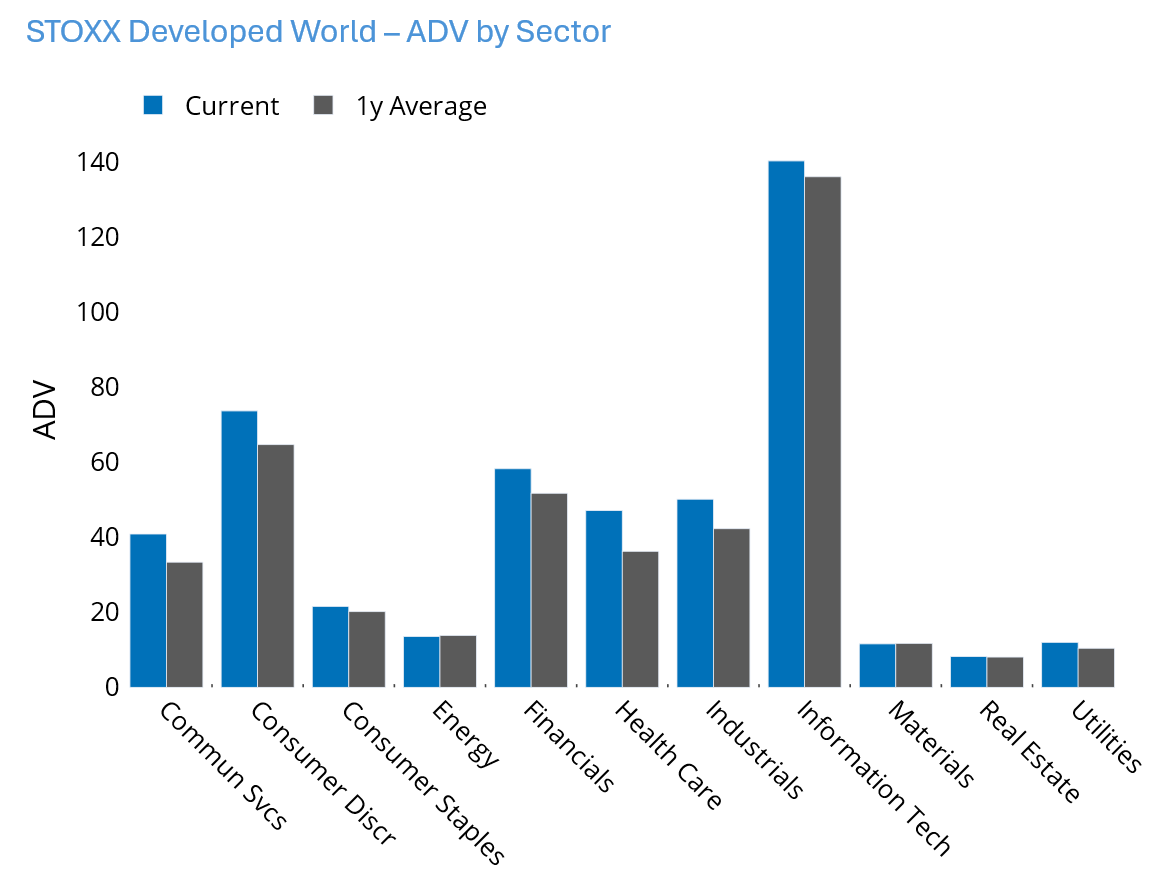
Still, trading volume at the end of May was above the average for the last year in most markets we track closely. In addition, average daily trading volume (ADV) at the end of May was about 32% higher than it was at the same time last year for the STOXX Global Developed Index. Since the market rose about 14% during the same period this means that a lot more shares were traded. This should not be surprising as the on-again, off-again tariff announcements suggest a continuous rethinking of investment theses, driving a need for portfolio rebalancing. For the STOXX Developed World Index, as well as other country and regional indices, we see that recent trading volume is higher than the average in the past year for most sectors. Energy, with its current volume slightly below average, is the exception.
See charts from various Equity Risk Monitors:
You may also like

.png%3Fh%3D1080%26iar%3D0%26w%3D1920&w=3840&q=75)
