
EQUITY RISK MONITOR HIGHLIGHTS
WEEK ENDED JULY 25, 2025
- Risk “On” Prevails
- Carry Factors Lead the Way
- Riskless Meme Stocks?
Risk “On” Prevails
Risk forecasts continued to fall in this last full week of July, along with other indicators of risk such as the VIX, which closed below 15 on Friday the 25th for the first time since February. The financial press was full of stories about the return of “meme stocks”, SPACs buying Crypto companies and other associated speculative tales.
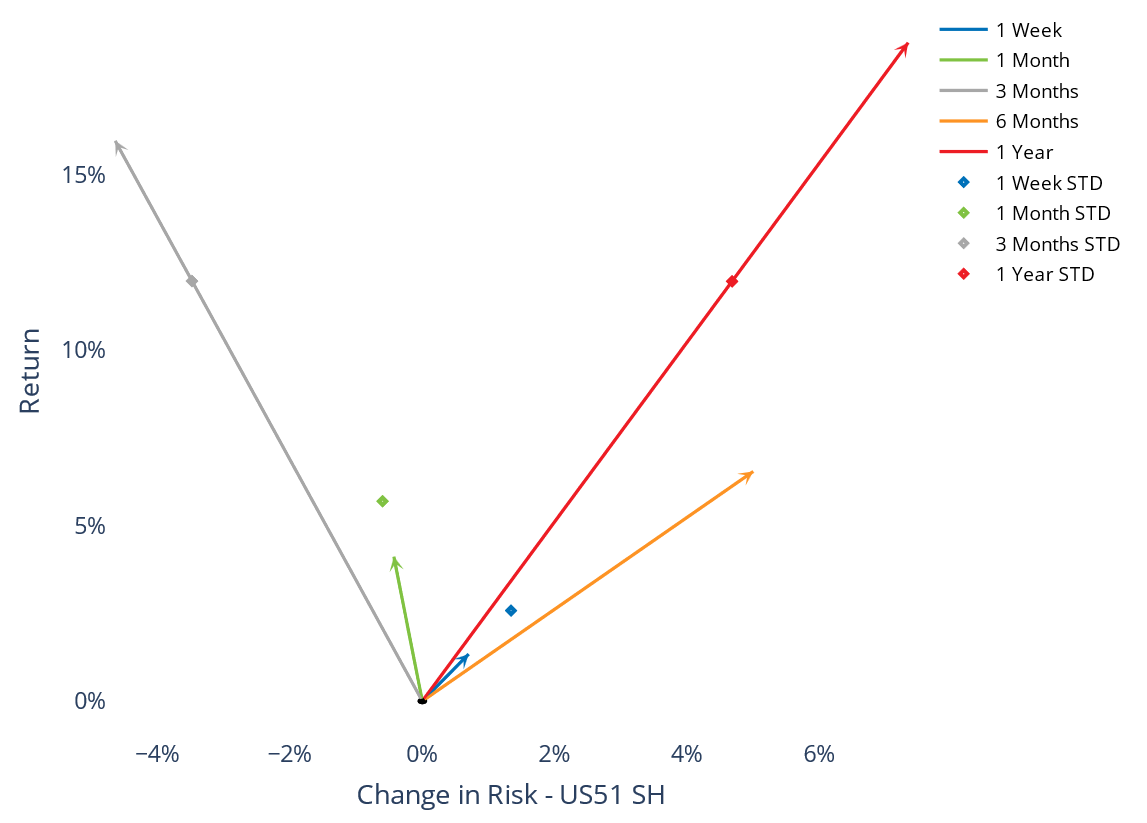
In the US 5.1 models, the risk forecast for the Russell 1000 ticked up slightly this week, despite the positive index return:
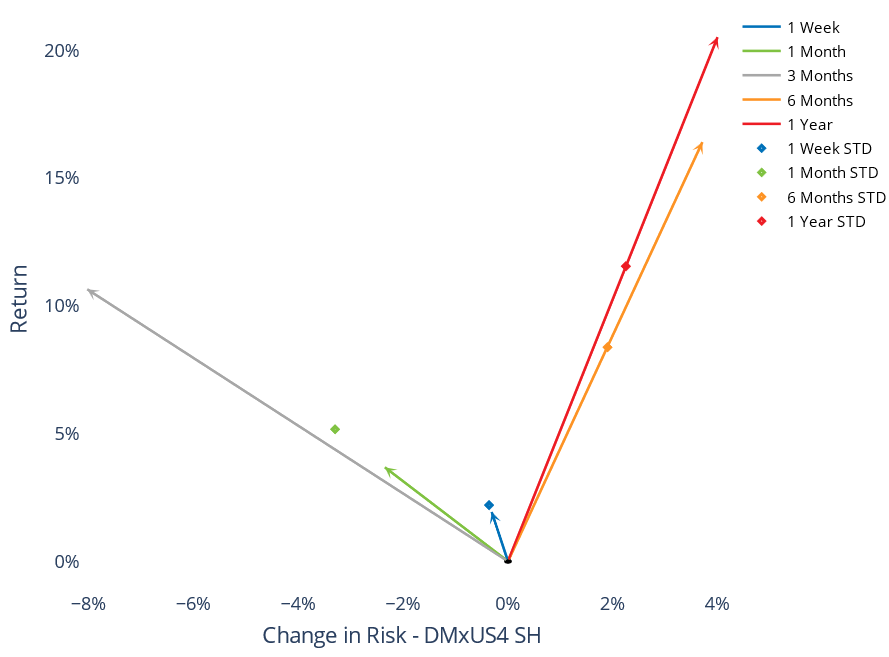
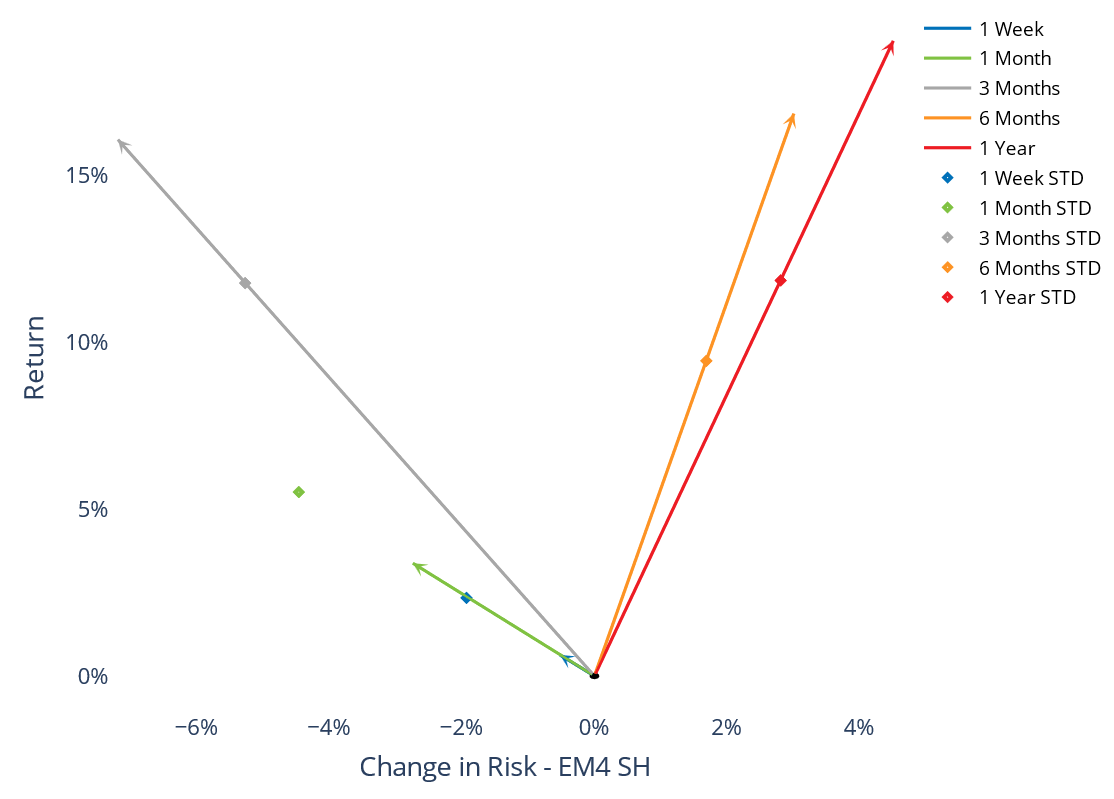
See Chart 11 in US5.1, Developed Ex-US, and Emerging Markets Risk Monitors, July 25, 2025
Developed ex-US was down, as was Emerging Markets:
Carry Factors Lead the Way
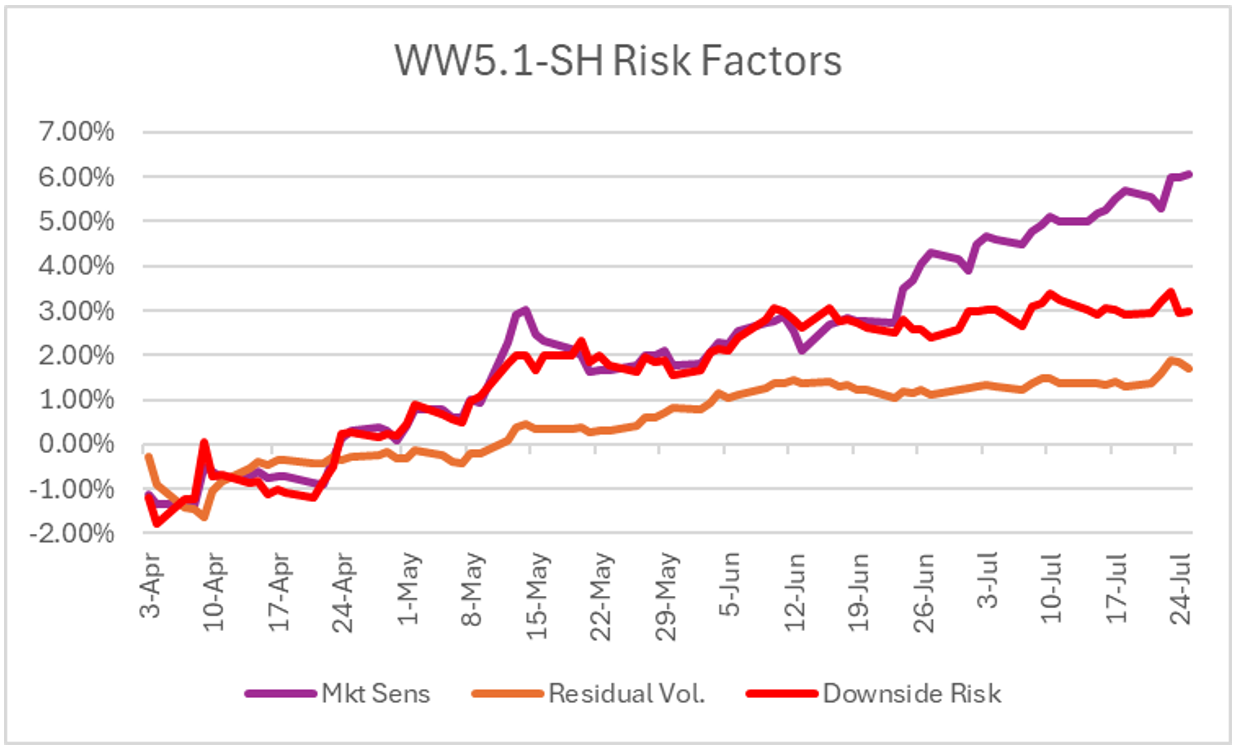
If there is any doubt regarding the current risk appetite of investors, particularly in the US, but Worldwide as well, the performance of the “carry” group of factors, or those factors for which an investor might be compensated purely for bearing additional risk, have led all other factors (except Size in the US) since the “Liberation Day” shock:
Performance of Carry Factors in WW5.1-SH since April 3, 2025:
(these charts are not available in the risk monitors but are available upon request)
Performance of Carry Factors in US5.1-SH Since April 3 2025:
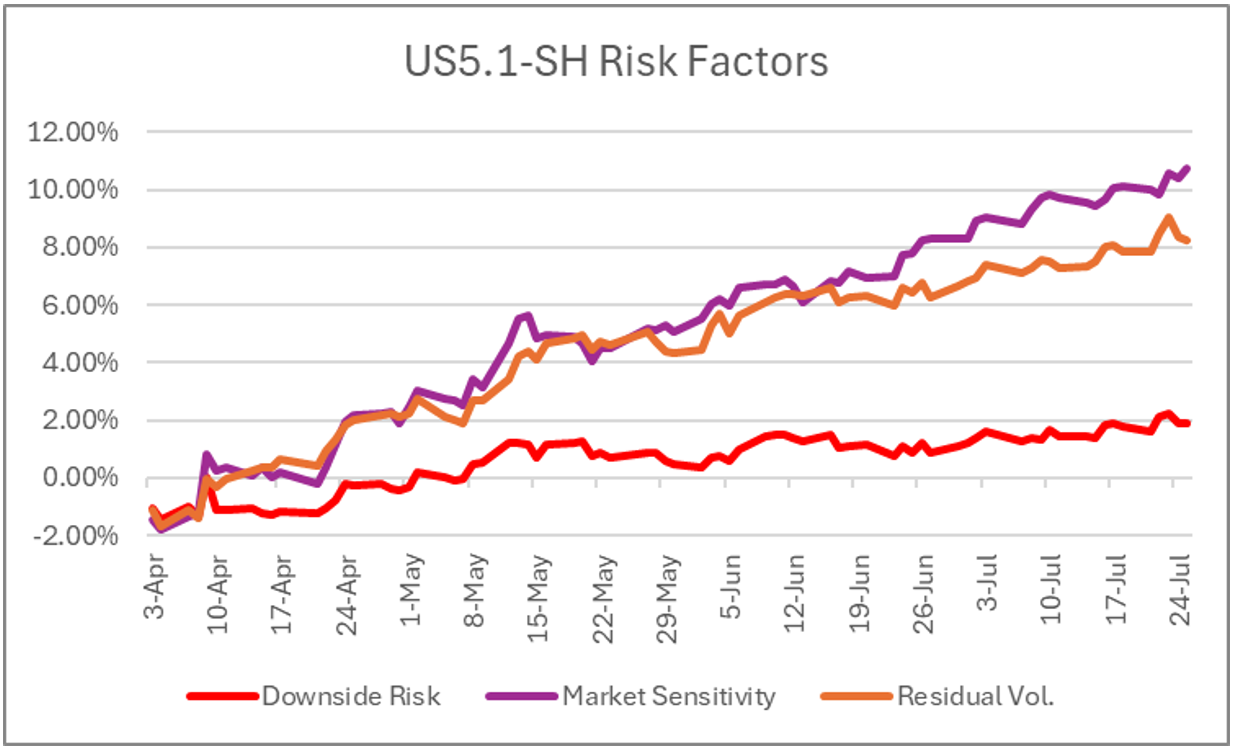
Meme Stocks: Riskless?
All the talk about “meme stocks” last week sparked our curiosity, so we looked at the time series of risk forecasts for the Van Eck Social Sentiment ETF (Ticker:BUZZ) which weights its holdings via a sentiment score derived from AI analysis of social media, news articles, and blog posts.
What we found was a bit disconcerting: while our forecasts were quite good at the beginning of the year, we are now forecasting 2x the realized forward 20-day volatility of this portfolio as of July 7 (last day we have 20-day realized forward volatility):
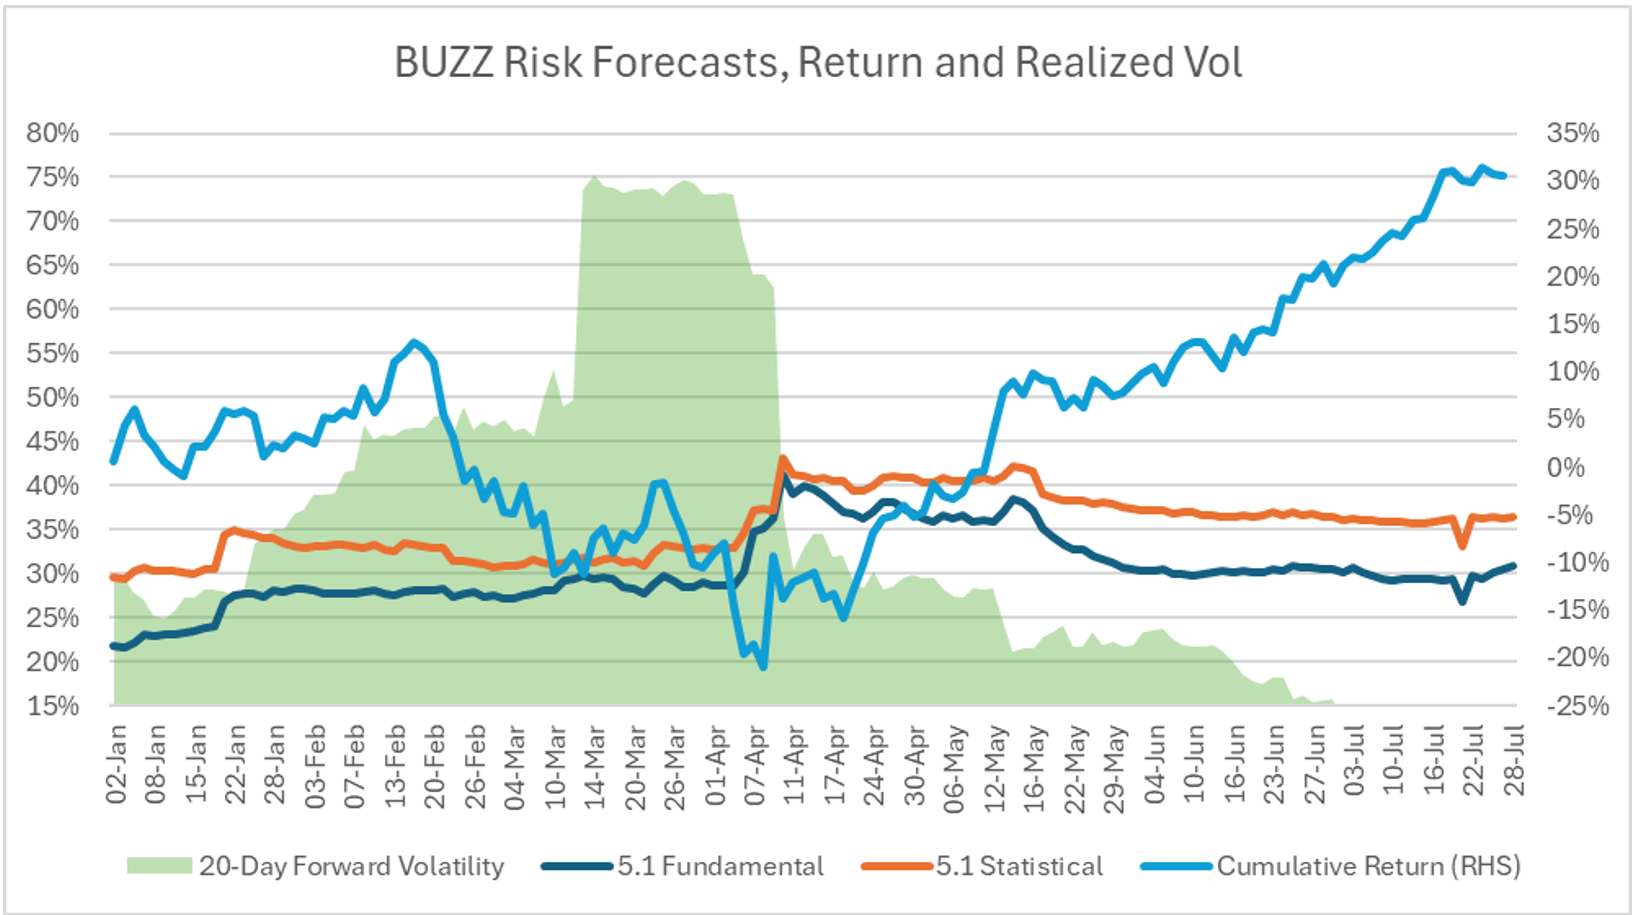
The US 5.1-SH statistical model was accurately forecasting risk of about 30% in January, and both models has a jump upwards in late January. Both models missed the “Liberation Day” shock which sent 20-day forward volatility as high as 70% in late March, but each of them caught up in early April. Since then risk forecasts have been falling quite steadily, but realized volatility has fallen off a cliff in a nearly literal sense, judging by the chart- as of July 7, it was 13.7%, while the stat model is forecasting 36% and the fundamental model 31%.
How can we interpret this?
In both the statistical model, with its dynamic, numerical factors and the fundamental model, with its structured market, industry, and style factors, the factor volatilities and correlations remain high, despite the disappearance of volatility in the names that make up this portfolio. In both models, more than 90% of the forecast risk is factor risk, so this isn’t a question of “missing” idiosyncratic risk. The factor relationships in both models are inferring that the volatility should be much higher than what we’re currently experiencing- and this is a good reminder of why we use factor models in the first place: to reduce the dimensions of the portfolio risk forecasting problem and to mitigate the spurious relationships and noise that evolve in the time series of asset returns. It may be that this sentiment-weighted portfolio of “meme” stocks has crossed some invisible barrier into the land of low-risk, safe investments, but the more likely explanation is that the factor relationships will prevail and we will see the volatility of this portfolio revert to its much higher mean in the near future.
You may also like


