
EQUITY RISK MONITOR HIGHLIGHTS
WEEK ENDED AUGUST 1, 2025
- Reacting to a barrage of data releases, markets had one of their worst weeks since “Liberation Day”
- …yet predicted volatility remained stable across many market
- Amid the turmoil, investors once again sought low volatility; other factors changed course as well
Reacting to a barrage of data releases, markets had one of their worst weeks since “Liberation Day”…
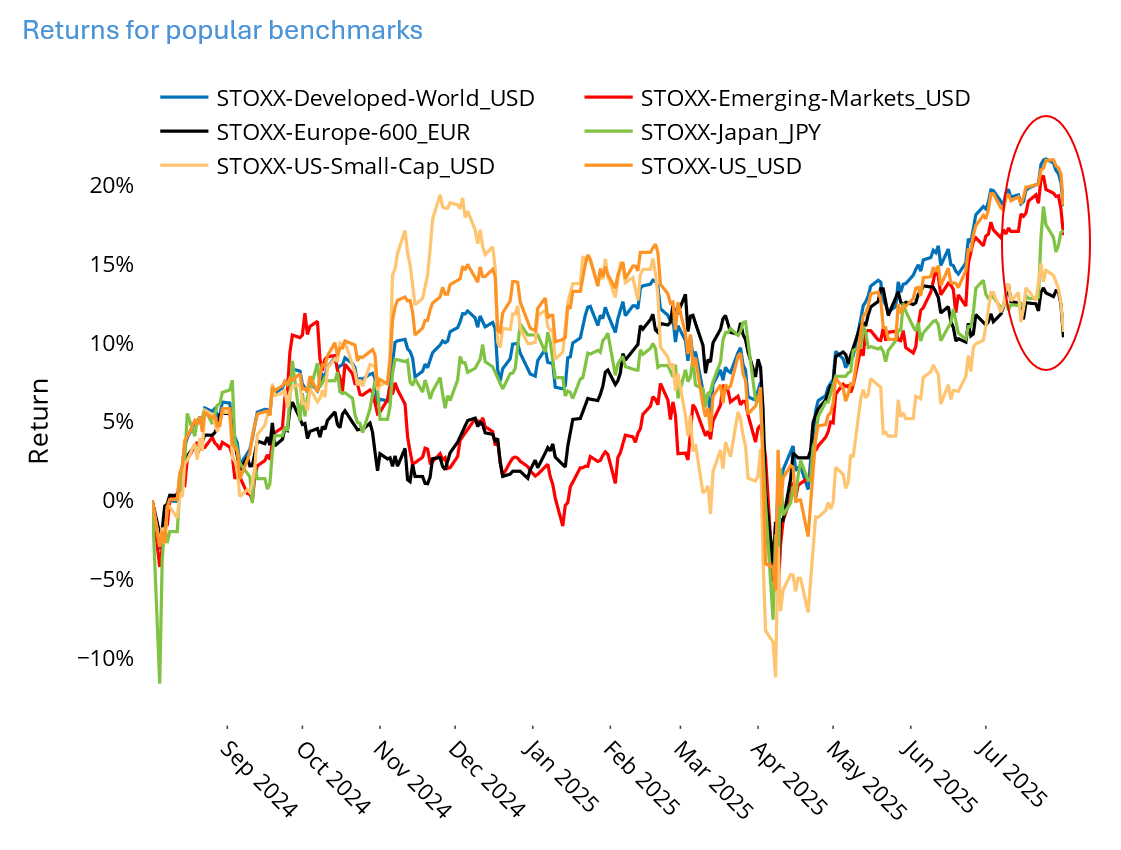
The week ending August 1 provided investors with several new data points on which to base their investment theses, and whether it was very disappointing employment results and their aftermath, new and elevated tariff announcements, inflation still exceeding the Fed’s 2% target, the threats suggesting the loss of Fed independence (see here for more from our team on that), good but not good enough earnings from some of the biggest companies or something else, markets around the world were shaken. We observed sharp drops in the US, Europe, China, Developed Asia ex-Japan, and Emerging Markets. In the Russell 1000, last week’s streak of down days was the longest, and the cumulative return was the worst since late May.
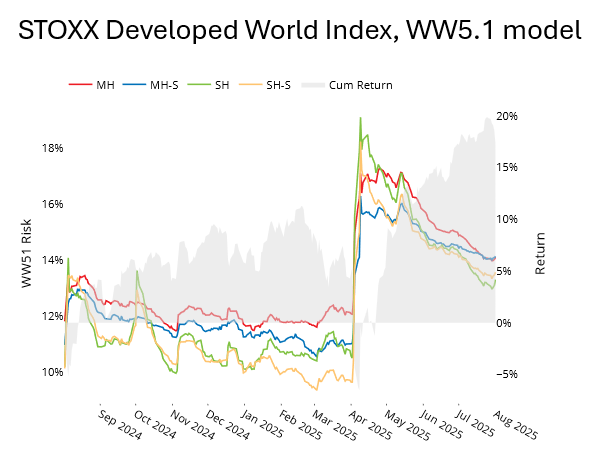
See chart from the STOXX Developed Index Equity Risk Monitor as of August 1, 2025
…yet predicted volatility remained stable across many markets
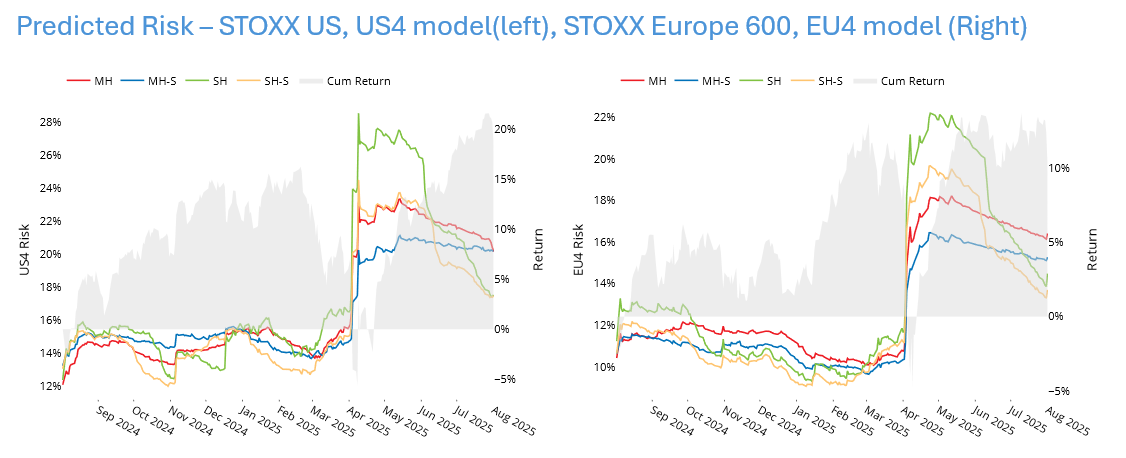
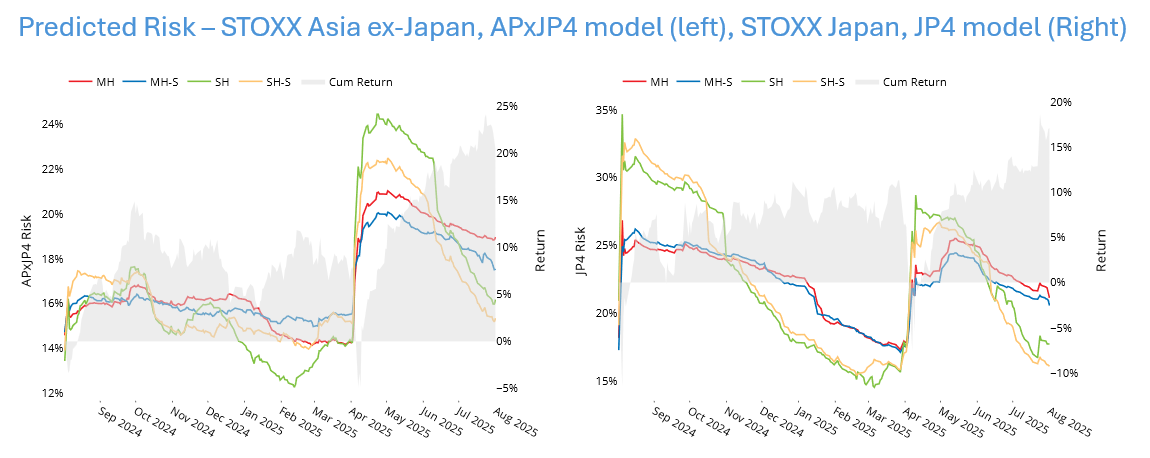
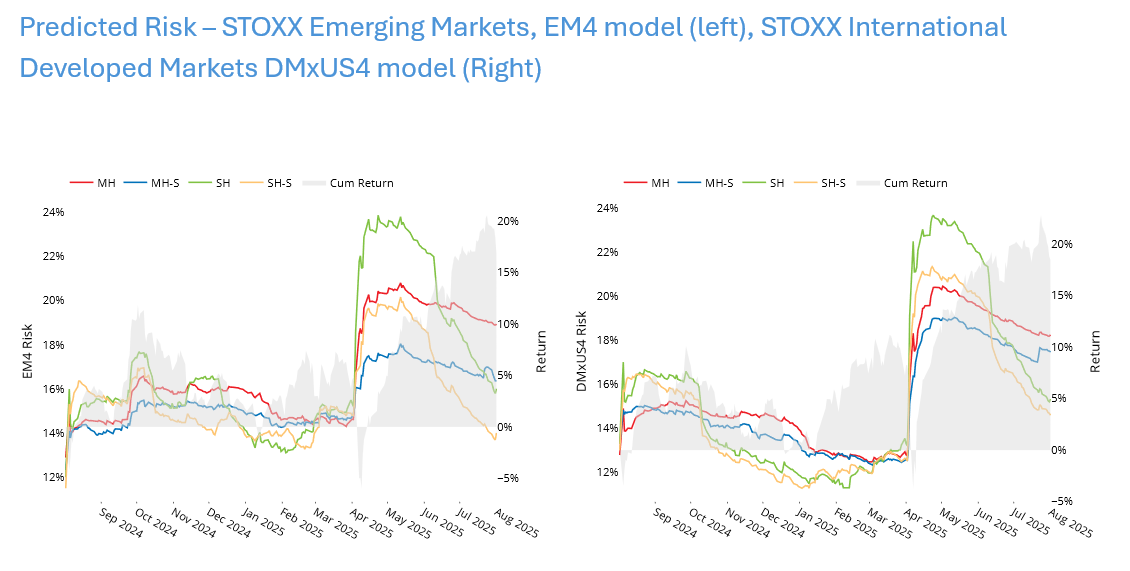
Surprisingly, despite the downdraft in prices, risk forecasts were little-changed in many markets. We would typically expect to see an uptick in predicted volatility after the market falls like this, especially since the STOXX US return on Friday, August 1 was one of the lowest in 2025 and the worst since late April. It wasn’t just the US: the streak of six down days from July 25 to August 1 for the STOXX Europe 600 and for the STOXX International Developed Markets (representing Developed Markets ex-US) Indices was the longest period of consecutive drawdown so far this year for both, and the five-day returns were only worse after “Liberation Day.”
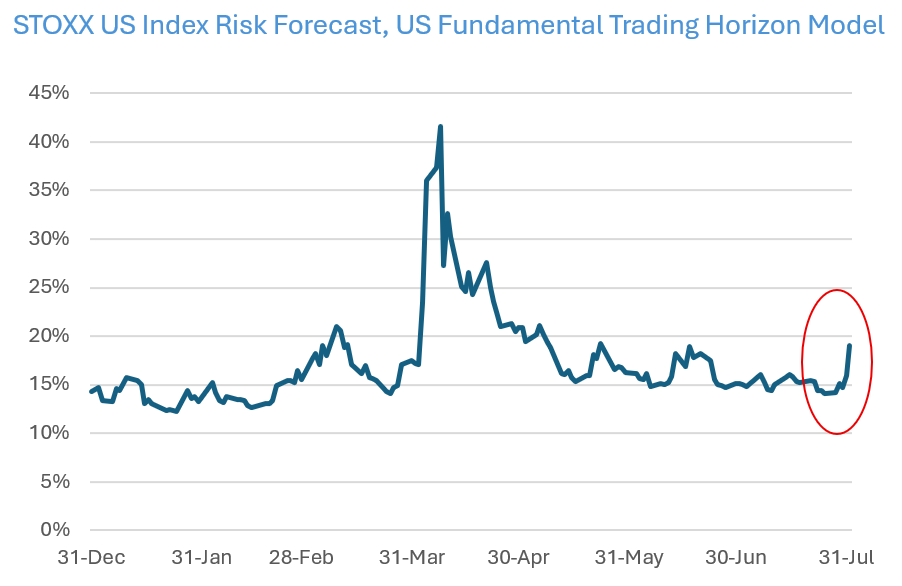
See charts from various equity risk monitors as of August 1, 2025
These disappointing returns beg the question, then, of why predicted risk has not jumped.
First, we believe it will start to rise shortly. We can see this in forecasts for the STOXX US index coming from the US trading horizon model. Risk jumped from 15.9% after Thursday’s close to almost 20% on Friday, one of the largest one-day jumps we have seen this year; the only larger increases were seen in the period around “Liberation Day.” Shorter horizon forecasts tend to lead those with longer horizons, so we believe this is a harbinger of higher risk to come, first in the short-horizon and then in the medium-horizon model variants.
The following chart is not included in the equity risk monitors but is available on request:
Second, whereas individual stock volatility has increased, correlations have fallen as investors try to sort out winners from losers. This can be seen most clearly from the perspective of the Worldwide (WW5.1) model, as investors see individual countries – and the stocks in them - benefitting relatively more or less from trade wars.
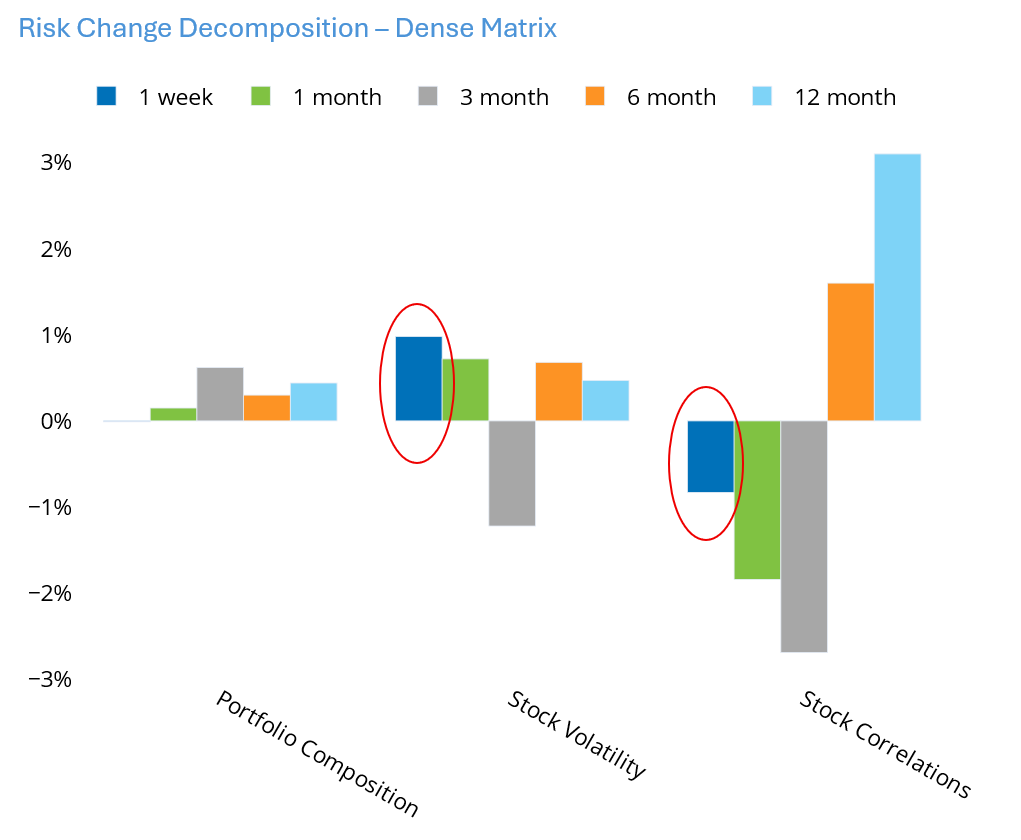
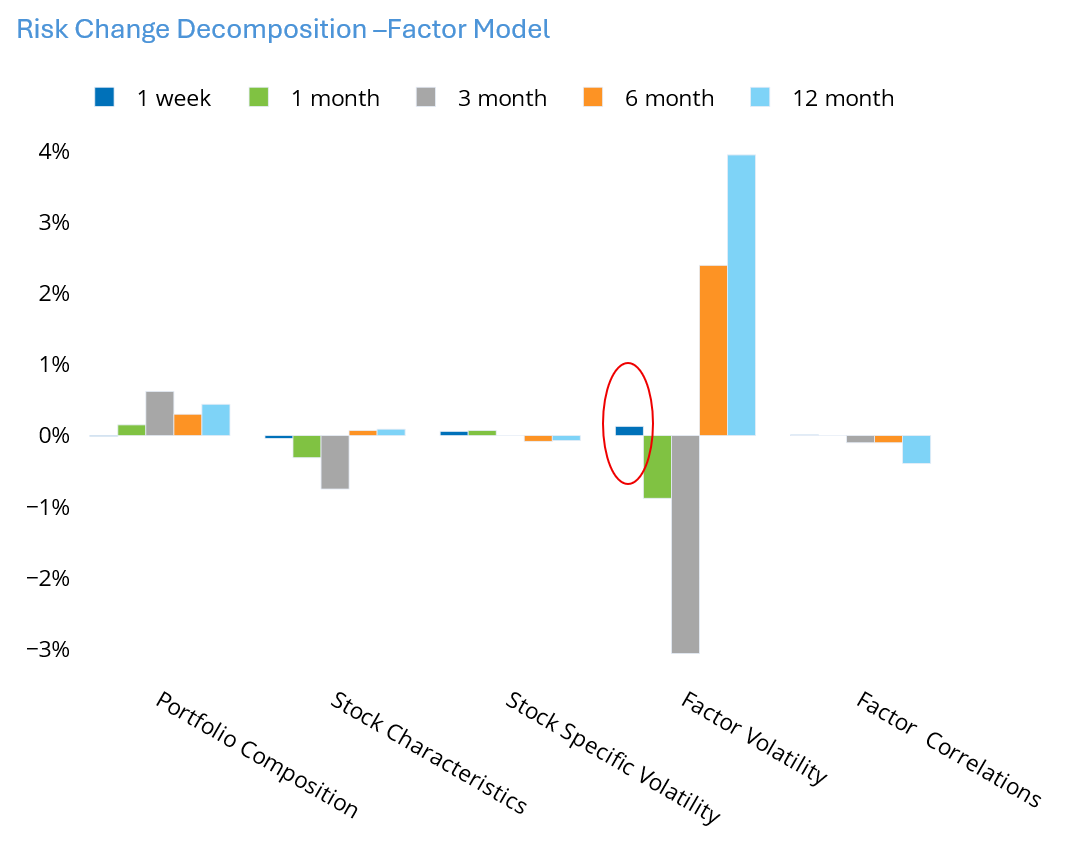
One of the charts showing the decomposition of the change in risk depicts the drivers of the change if we were using a dense matrix. The three sources are the components of the index, the volatility of individual assets and the correlations between assets. We can see that little changed in the index last week, and the increased stock volatility would have driven a 1% increase in predicted volatility if it had not been offset by a drop in correlations. Hence, no overall increase in risk. Also note that these offsetting contributors meant that factor volatility did not change, which we see in the decomposition of the factor-model change in risk.
Note that over the longer periods shown in the chart that portfolio composition also potentially drove risk higher. This is not because there were many stocks added to or taken out of the STOXX Developed World Index. Instead, it reflects the resurgence in Information Technology stocks. Their increasing weight in the index, especially over the last three months, combined with their relatively higher individual-stock riskiness, has meant that if stock volatility and correlations had stayed constant, index risk still would have risen.
See charts from the STOXX Developed Index Equity Risk Monitor of August 1, 2025
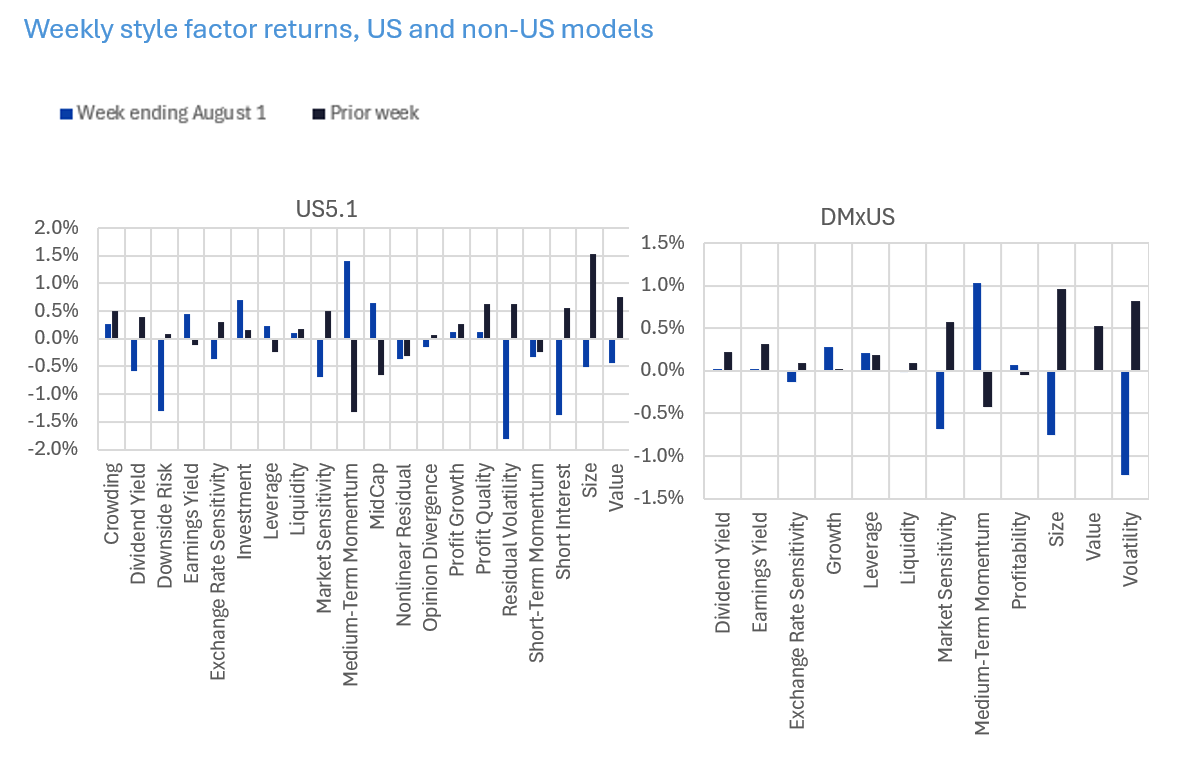
Amid the turmoil, investors once again sought low volatility; other factors changed course as well
The about-face in markets last week was accompanied by a dramatic shift in factor preferences. In addition, some style factors’ returns fell into the extremes (top or bottom decile) at least one of the days last week.
Many of the Axioma models reflected that investors have switched from a strong preference for higher volatility stocks to avoiding those riskier names. In the US5.1 model, Residual Volatility and Market Sensitivity returns were both quite positive in the week ending July 25, meaning investors were seeking out higher volatility and higher beta names but became sharply negative last week (especially Tuesday – Friday) as the “risk-on” trade turned to “risk-off”. In fact, the return to Residual Volatility on Tuesday, July 29, was among the lowest daily returns in the history of the model back to 1982, and the weekly rank went from the 87th percentile to the 2nd. Similarly, Market Sensitivity’s return was in the bottom 1% on Friday, August 1, and the weekly rank fell from the 80th percentile to the 12th. Downside Risk had been flat for the prior week, but was highly negative (meaning investors were shunning high Downside risk), in the 2nd percentile relative to history, last week.
It wasn’t just volatility-related factors that changed course. Short Interest’s weekly return went from a percentile rank of 97 (meaning stocks with high short interest were doing well, contrary to expectations that they should have negative returns) to one of the lowest five-days returns in model history (so shorts were behaving as expected). As the US dollar weakened Exchange Rate Sensitivity went from positive to negative. While the magnitude was small, the percentile ranking went from 93 to 4, with especially negative returns last Thursday and Friday. Shifts in market direction, especially after a strong and consistent trend, will often lead to a change in the return direction for Medium-Term Momentum. Curiously, this time the return went from negative (2nd percentile) to positive (99th percentile).
Results were quite similar in the Developed Markets ex-US model, where preferences shifted from higher-risk strategies (Volatility and Market Sensitivity) to lower, and Medium-Term Momentum went from being punished to being rewarded.
These factor flip-flops may continue, as general uncertainty about the economy and future Fed moves remains (even if it doesn’t show up in forecast index volatility). While factor volatilities are therefore likely to rise, their correlations could fall. Like market risk, overall portfolio factor risk would then remain stable, but that stability would be hiding some large changes in factor dynamics.
The following charts are not included in the equity risk monitors but are available on request:
You may also like


