MULTI-ASSET CLASS MONITOR HIGHLIGHTS
WEEK ENDED JANUARY 3, 2025
Treasury curve normalizes as long yields soar despite rate cuts
Long-term US Treasury yields ended 2024 at an 8-month high, despite the Federal Reserve lowering its policy rate target by a full percentage point from its peak of 5.25-5.50%. In fact, since the first rate cut in mid-September, the 10-year benchmark yield has climbed 95 basis points, rising above the effective federal funds rate for the first time since November 2022. This also concluded the deepest and longest inversion of the 10-year/2-year term spread since the 1980s, with the USD yield curve now upward sloping for maturities between 12 months and 20 years.
Treasury curve inversions have traditionally been followed by at least one quarter of negative GDP growth, which usually started anytime between two and five months after the term spread turned positive. Most recently, the 10-year yield surpassed the 2-year rate again in early September, which means that if the bond market is correct, the American economy is either already in a recession or will be by the end of the current quarter. This would come as a big shock to most analysts and investors who are clearly betting on things being different this time.
The fact that long yields soared in an environment of falling short-term rates may also seem slightly counterintuitive. However, long-term borrowing costs tend to be driven by economic growth and inflation expectations rather than changes in monetary policy. The nominal 10-year yield has historically been—with the exception of the ultra-low rate environment after the 2008 crisis—around two times the same-maturity breakeven inflation rate. With the latter currently around 2.3%, a nominal rate of 4.6% can be simply seen as a reversion to historical averages.
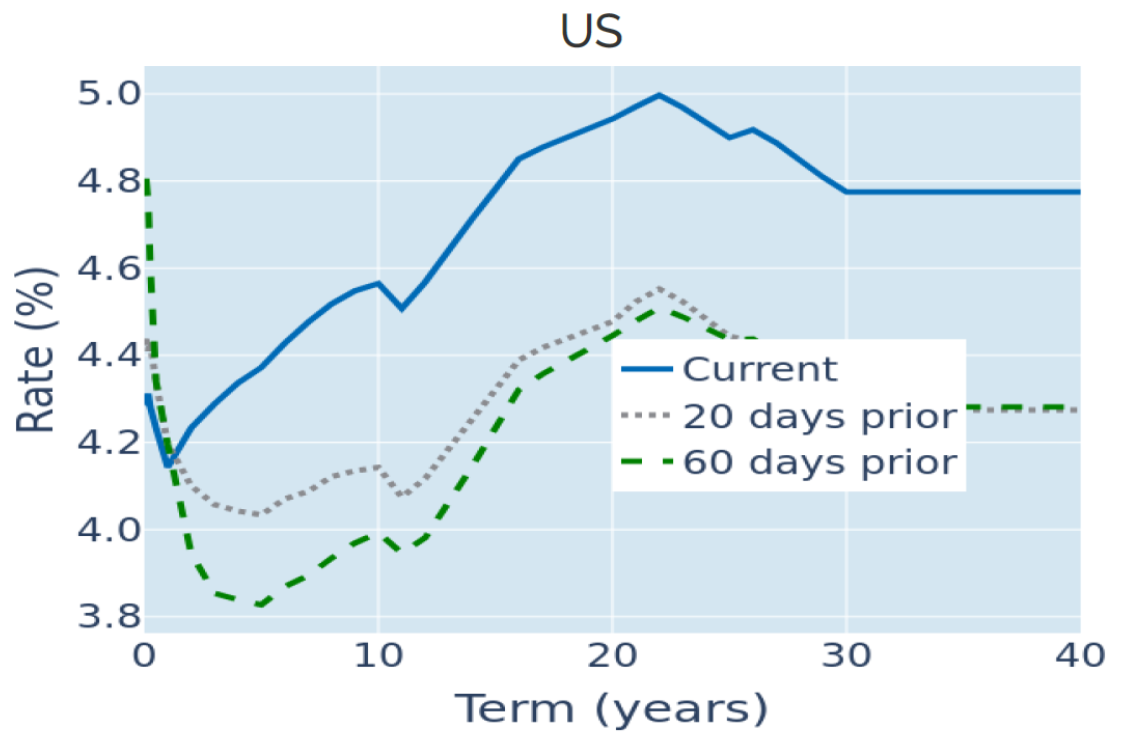
Please refer to Figure 3 of the current Multi-Asset Class Risk Monitor (dated January 3, 2025) for further details.
Upward revision in monetary policy expectations boosts the dollar
The US dollar rose to its highest level against a basket of major trading partners since November 2022, buoyed by expectations that the Federal Reserve will ease monetary conditions less than previously projected. Over the course of last year, the greenback appreciated more than 6% against the euro and 10% against the Japanese yen.
At the start of 2024, market participants anticipated 150 basis points worth of monetary easing in that year with another half percentage point following over the first six months of 2025. But those hopes were quashed by a flurry of upward inflation surprises in the first quarter of 2024, and traders reduced their rate cut expectations to just 0.25% in 2024 and 0.75% by June 2025.
Consumer price growth resumed its downward trend over the summer, reigniting rate cut speculations, only to be doused once more by a stronger-than-expected labor market report at the beginning of October. Since then, the euro has weakened more than 7% against its American rival, while the yen lost just over 8%. The latter has been exhibiting the greatest sensitivity to changes in monetary policy expectations, as the Bank of Japan only just started to tighten financial conditions, while all its major counterparts cut their policy rates.
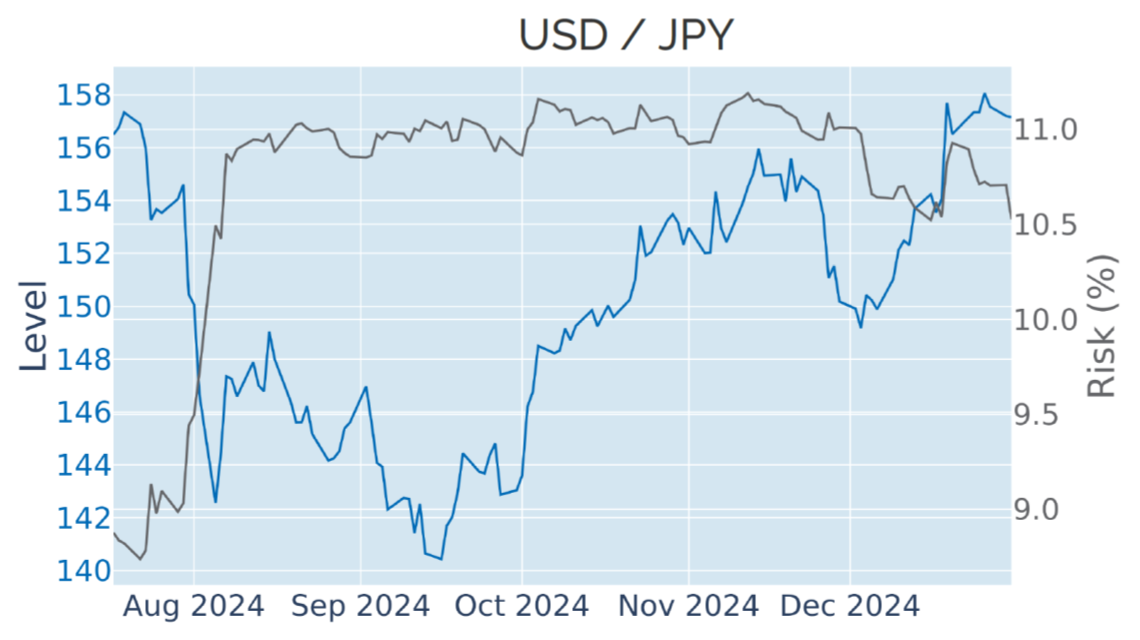
Please refer to Figure 6 of the current Multi-Asset Class Risk Monitor (dated January 3, 2025) for further details.
US equities dominate portfolio risk after tumultuous December
The predicted short-term risk of the Axioma global multi-asset class model portfolio ended 2024 at 8.2%, with most asset classes apart from oil contributing positively to overall volatility. US equities displayed the biggest percentage risk contribution of 56% relative to their monetary weight of 30%, reflecting a surge in share price volatility over the course of December. Their counterparts from other parts of the world, on the other hand, appeared less risky due to a weak correlation between stock prices and exchange rates against the US dollar, which also resulted in smaller risk contributions from the corresponding cash holdings. The opposite effect could be observed for non-USD sovereign bonds versus their American peers. The returns of the former were very closely linked to changes in FX rates, which made them appear almost three times riskier relative to their market value weight than US Treasury bonds. But even the latter added to the overall volatility of the portfolio, due to the prolonged positive interaction between equity and interest rate returns.
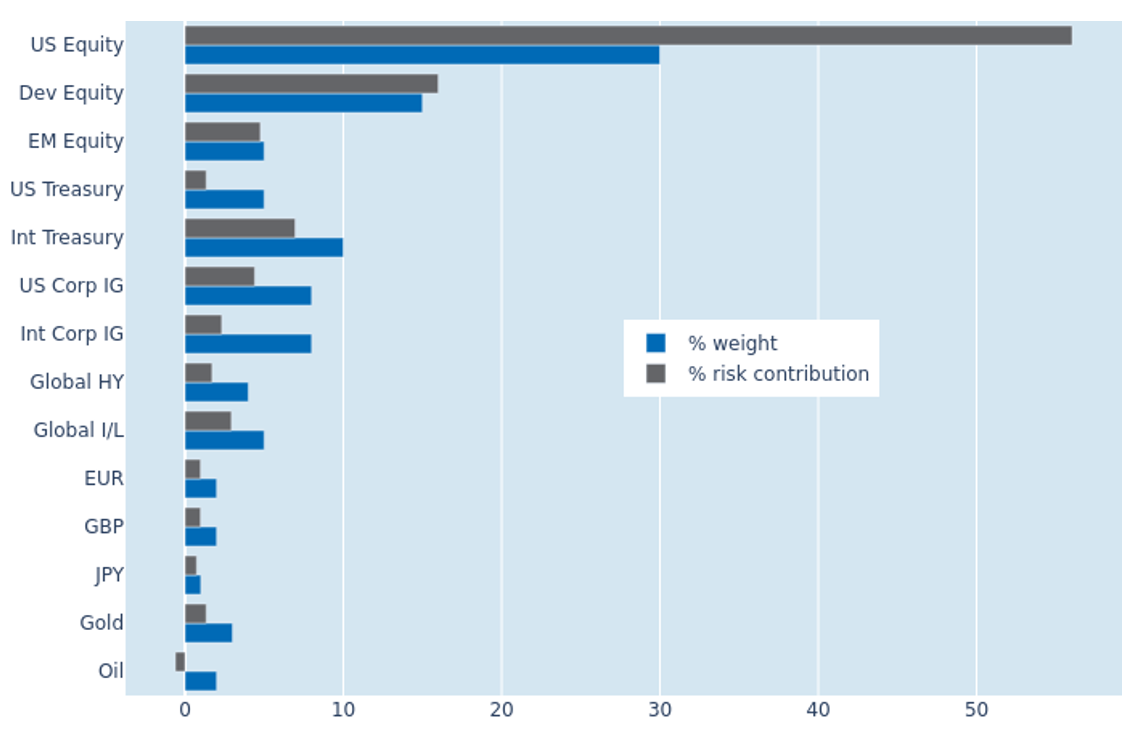
Please refer to Figures 7-10 of the current Multi-Asset Class Risk Monitor (dated January 3, 2025) for further details.
You may also like