AXIOMA ROOF™ SCORE HIGHLIGHTS
WEEK OF MAY 6, 2024
Potential triggers for sentiment-driven market moves this week
- US: Michigan consumer confidence survey and speeches by Fed officials. Earnings from Pharmaceuticals, Walt Disney, BP, Toyota, Uber, Airbnb, and Shopify.
- Europe: BoE interest rate decision in the UK. Germany’s factory orders, industrial production, and trade balance figures.
- APAC: China’s Services and Composite PMI, inflation, and foreign trade data.
- Global: Fed officials’ speeches and any hints that a rate hike might conceivably make its way back onto the table.
Insights from last week's changes in investor sentiment:
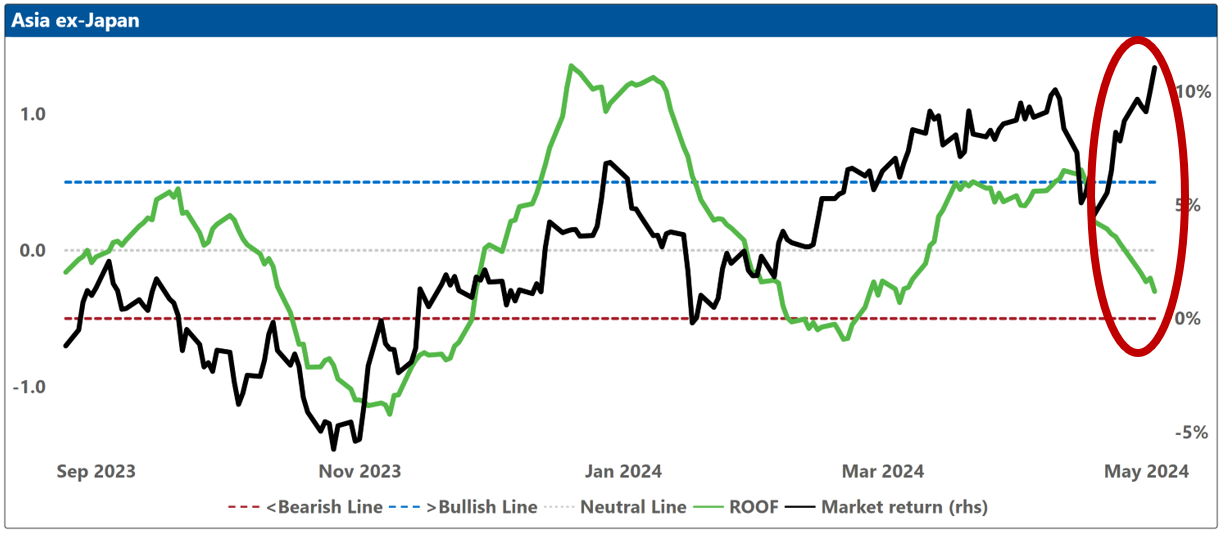
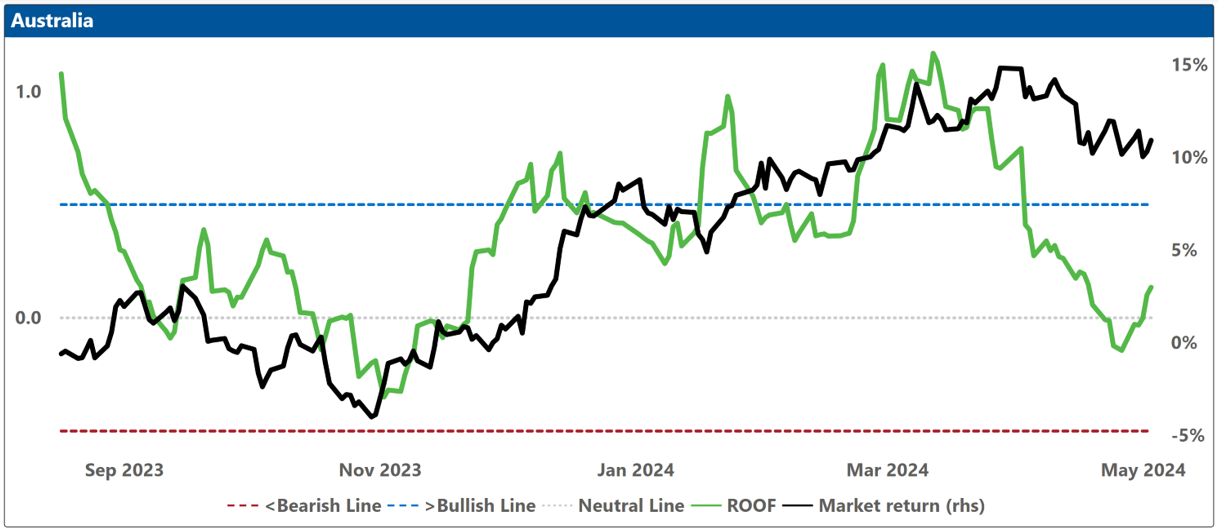
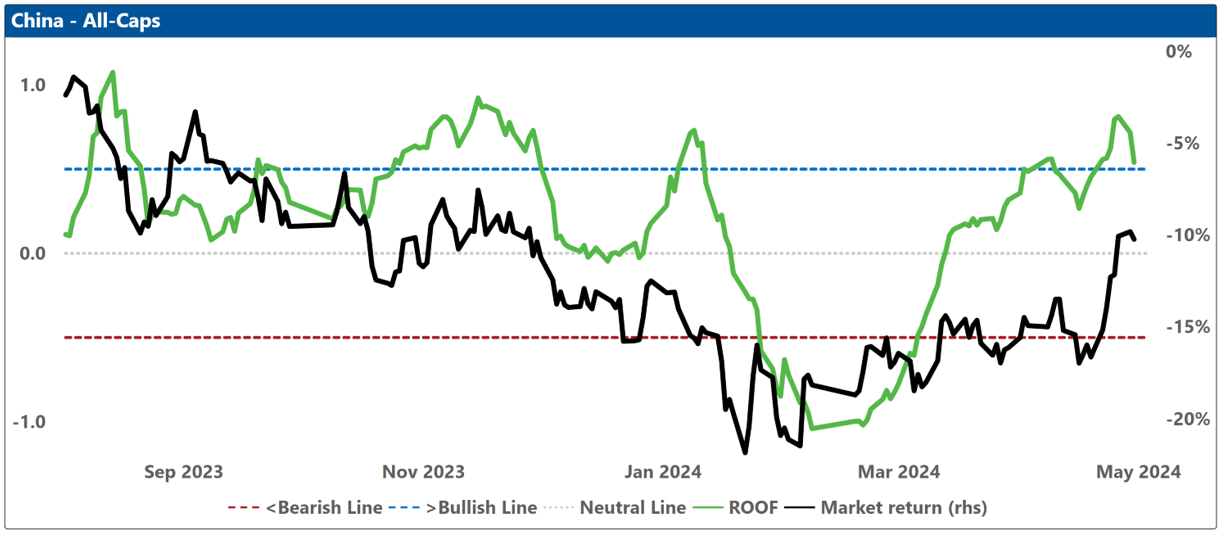
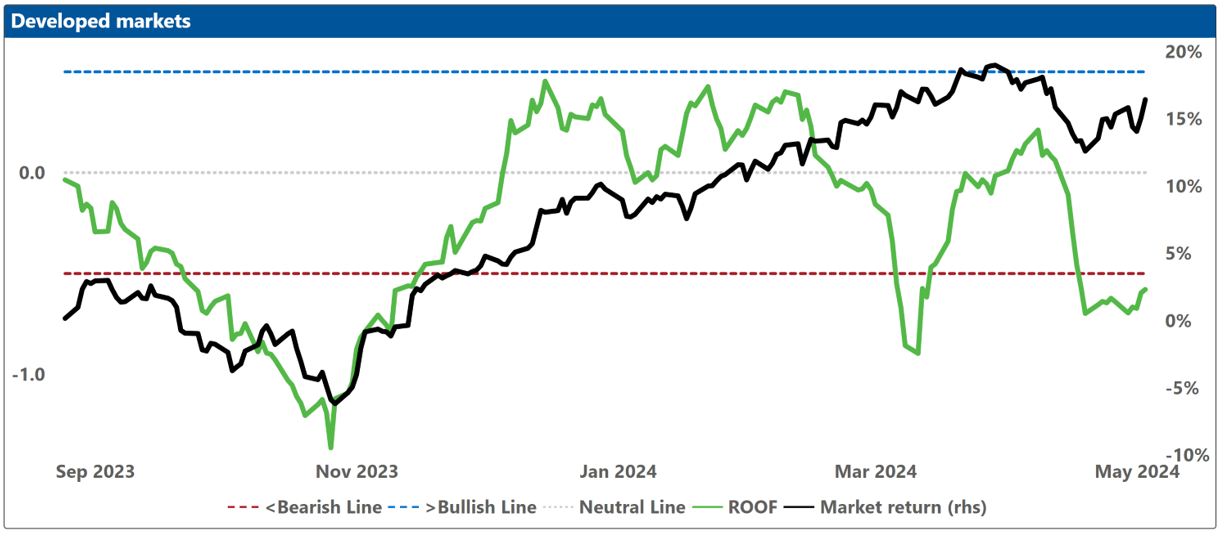
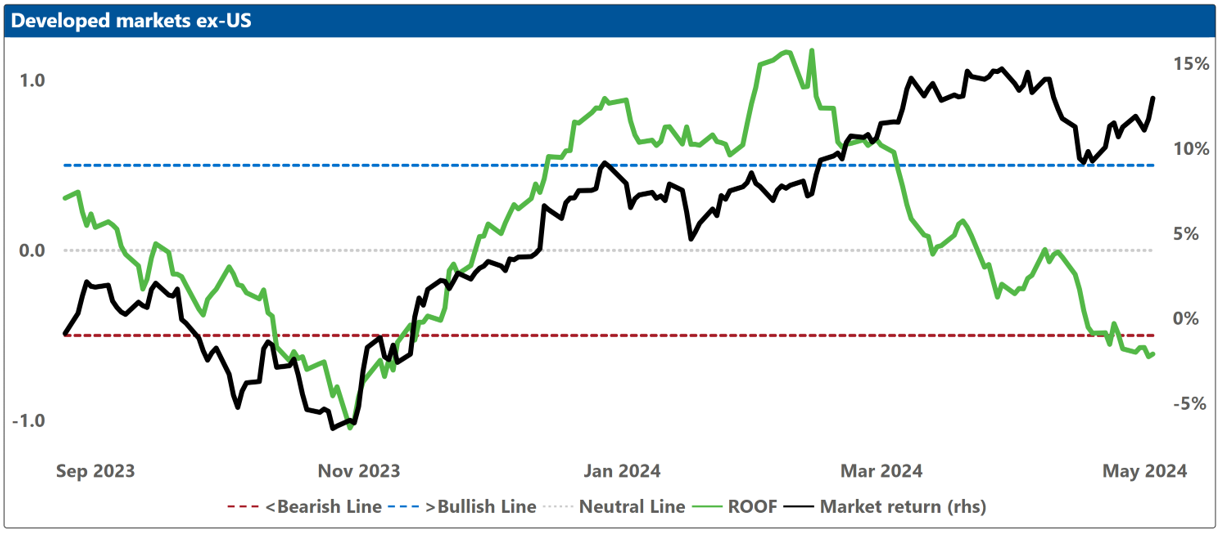
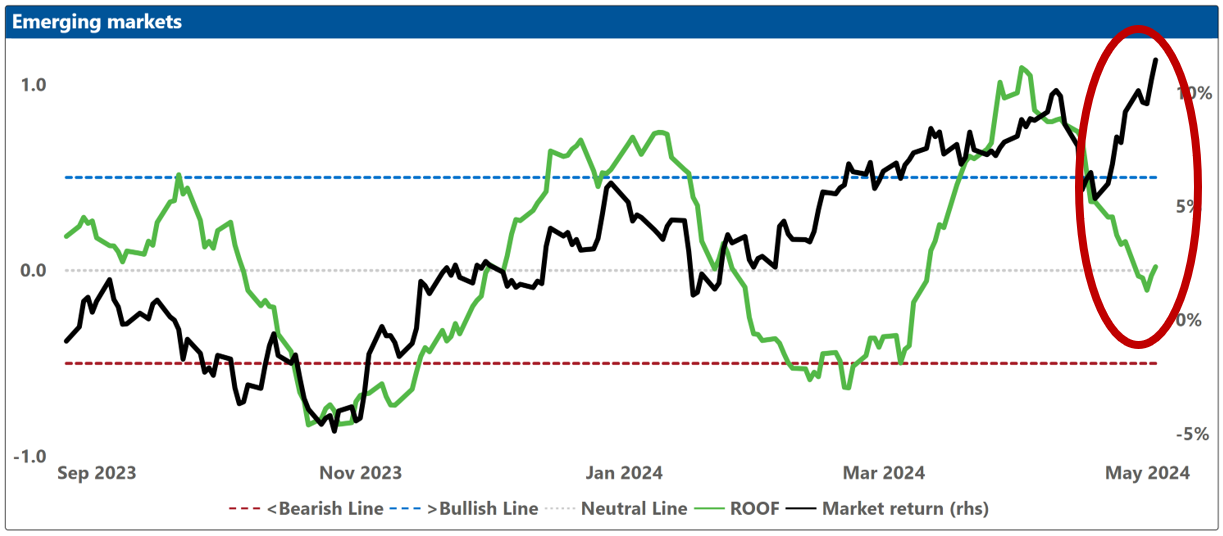
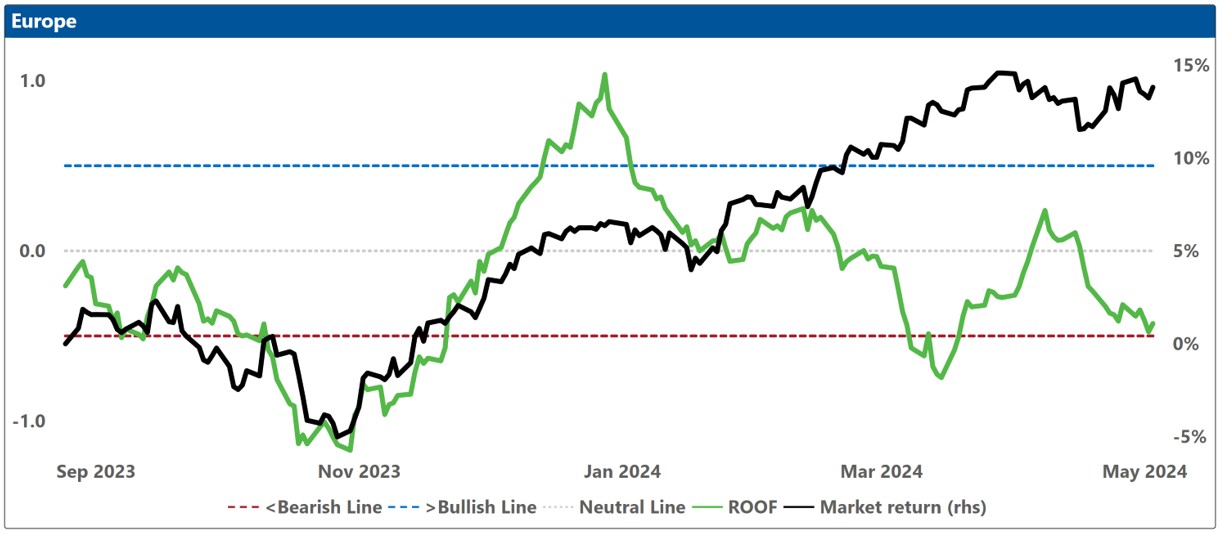
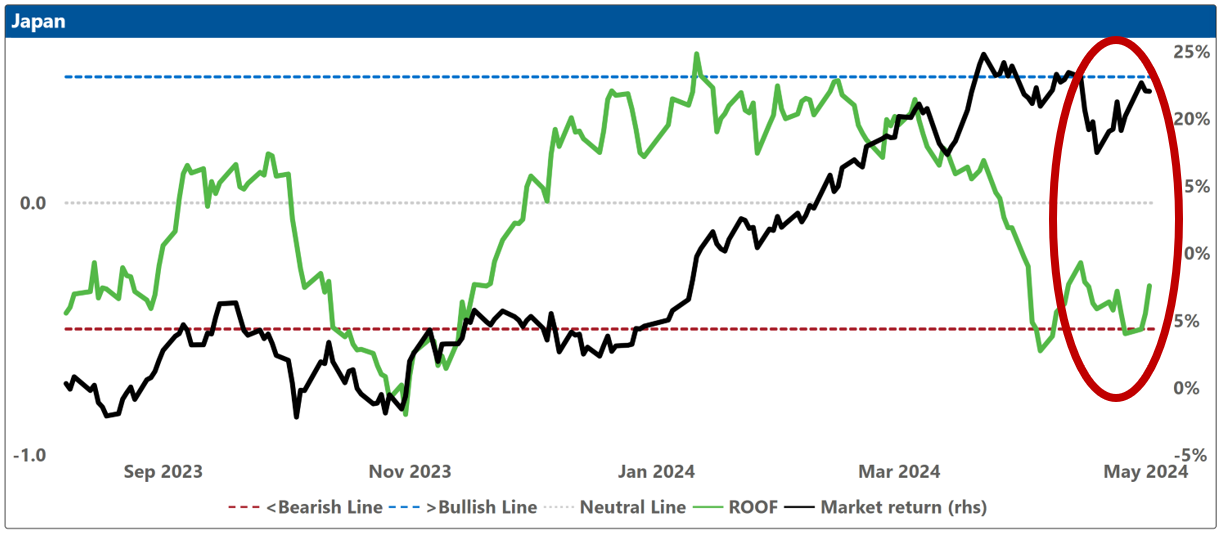
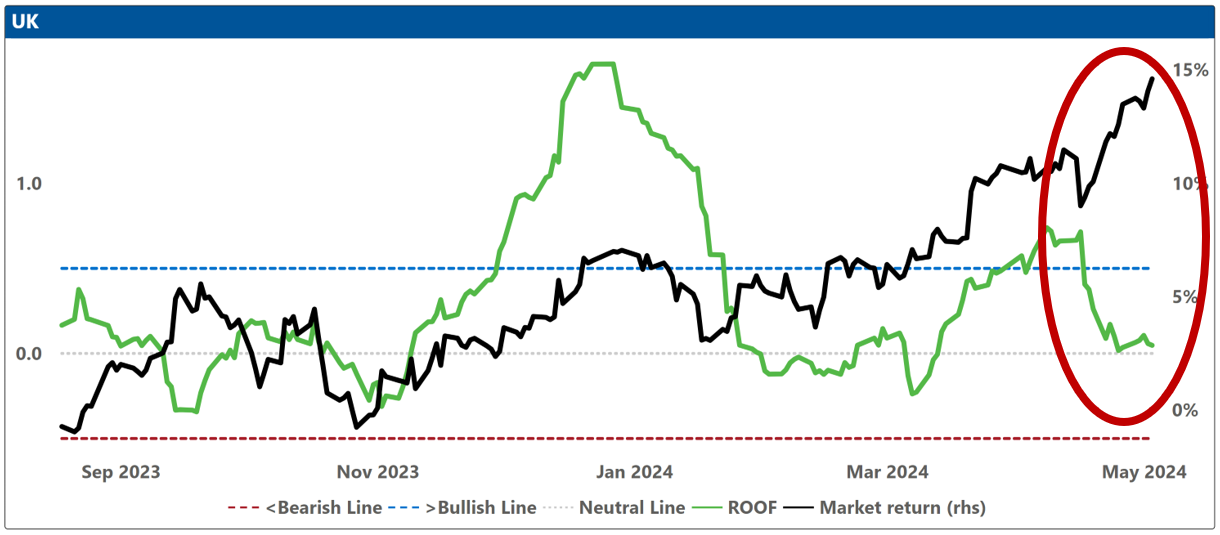
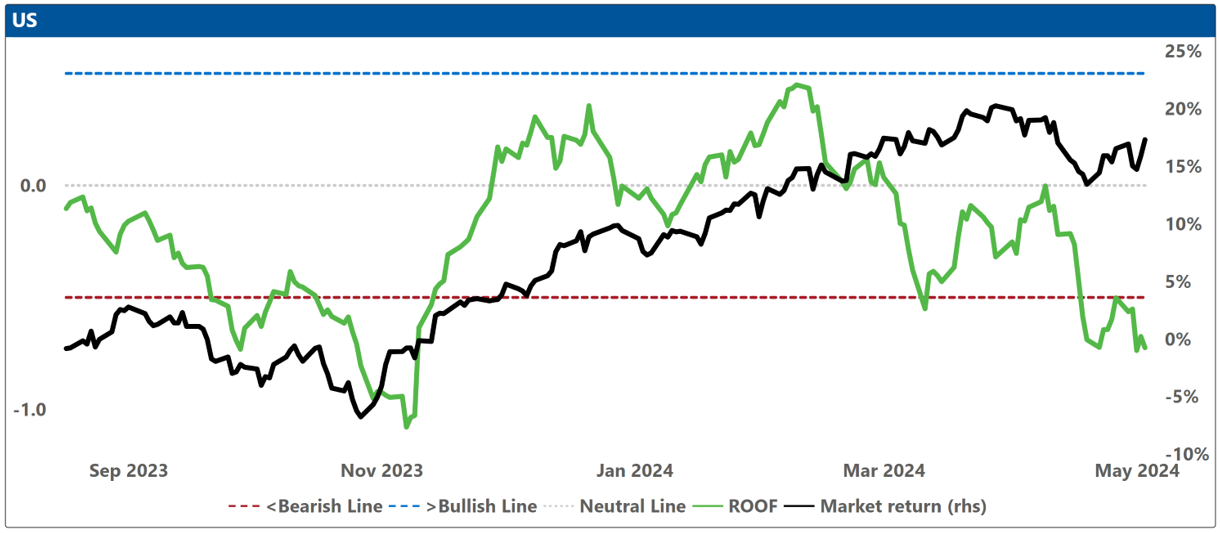
Investor sentiment ended last week little changed from the prior week, with investors in Global Developed, Global Developed ex-US, and US markets remaining bearish. Sentiment weakened from neutral to negative in Asia ex-Japan, remained negative in Europe, and neutral in the UK and Australia (Japan and China had a holiday-shortened week).
The main factor still weighing on sentiment is the direction of US interest rates. The negative mood reflects the adjustment to their portfolios investors still need to (reluctantly) make from their original forecast of where they would be at year-end. For Wall Street, where newness is a constant demand, the lack of movement so far in 2024, marks it as an especially portentous year.
Last week’s US economic data releases did not answer any questions for investors. In fact, it may have raised their anxiety levels about the timing of the first rate cut (if any). April marked the 27th consecutive month with the unemployment rate remaining below 4%, equaling the longest period of such low rates since the 1960s. The proportion of employed individuals in their prime working years, aged 25 to 54, edged up slightly to 80.8%, close to the highest level observed in over two decades (an all-time high for women). The employment report depicted a robust job market that is not too hot, a best-case scenario for the Fed as it continues to focus on inflation.
It has been nine months without a shift in US interest rates, the second-longest period on record, and very unusual for a Fed who, like a child with a scab, finds it hard to let alone. When asked about the possibility of an increase in interest rates, Jerome Powell, safe in the knowledge that the get-out-of-jail clause of ambiguity would later excuse his answer, replied with a statement that was somehow both clear and cryptic: "I think it's unlikely that the next policy rate move will be a hike." The recognition of the thought, however, by no means eradicated the thought for investors who began the year confidently betting on six rate cuts in 2024 and are now left forcefully pleading – a tone that melds begging and demanding – for just the one.
In a pre-inflation economy where interest rates were discussed nostalgically and without any anxiety or menace, investors were free of all worries except earnings. There was no fear or dread of what the Fed might or might not do yet—no irony. It was, investors have come to realize over the past two years, an innocent time, even though they decidedly felt it wasn’t as they lived through it (i.e. COVID).
Today, investors are having to deal with the realization that at the end of the day, a forecast is just gossip. “The Fed will cut rates six times this year”, “The ECB will cut first”, “The BoJ will intervene”. We read this gossip again and again in graffiti scribbled on the bathroom wall that is Twitter (sorry Elon). Sometimes, gossip and reality reconcile like old friends and sometimes the feud goes on. And sometimes, geopolitical uncertainty gets involved, further disturbing the comfortable and comforting the disturbed.
2024 isn’t even halfway over and investors are already having to look for the kind of fire in the belly that Tums can’t put out just to keep doing battle with not one but two eight-hundred-pound gorillas in the shape of US monetary policy and the US Presidential election. The recent weakness in sentiment may indicate that many don’t have the stomach for it.
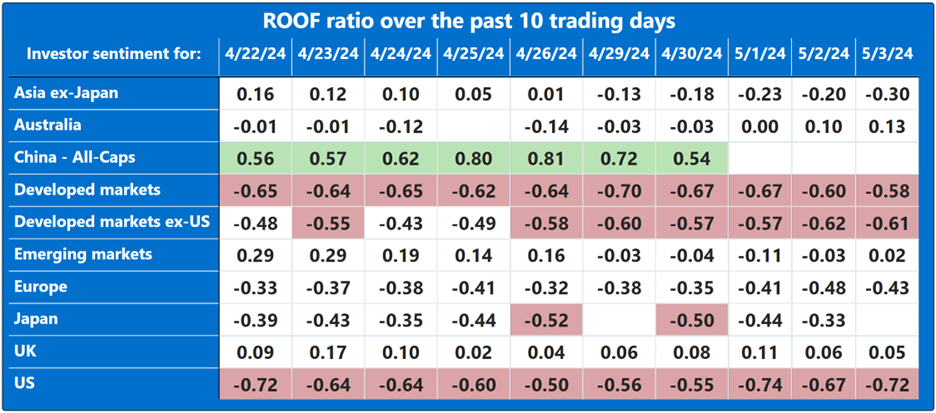
Note: green background = bullish, red background = bearish
Changes to investor sentiment over the past 180 days for the markets we follow:
How to read these charts: The top charts show the ROOF ratio (investor sentiment) in green (left axis), against the cumulative returns of the underlying market in black (right axis). The horizontal red line at -0.5 (left axis) represents the frontier between a negative sentiment (-0.2 to -0.5) and a bearish one (<-0.5), and the horizontal blue line at +0.5 (left axis) represents the frontier between a positive sentiment (+0.2 to +0.5) and a bullish one (>+0.5). Around the horizontal grey line at 0.0 (left axis), sentiment can be considered neutral (-0.2 to +0.2).
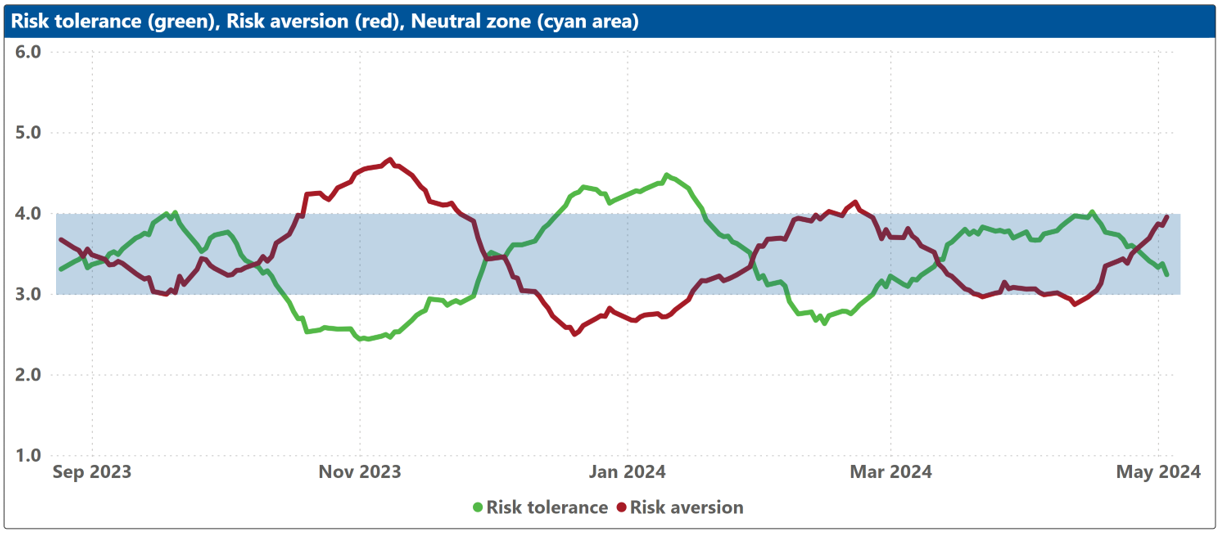
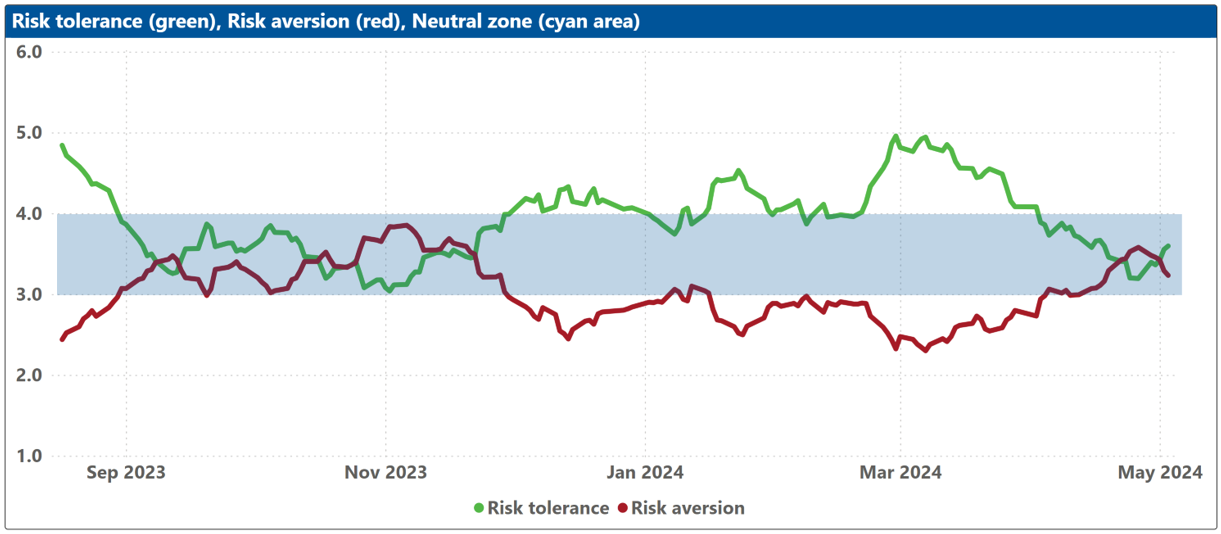
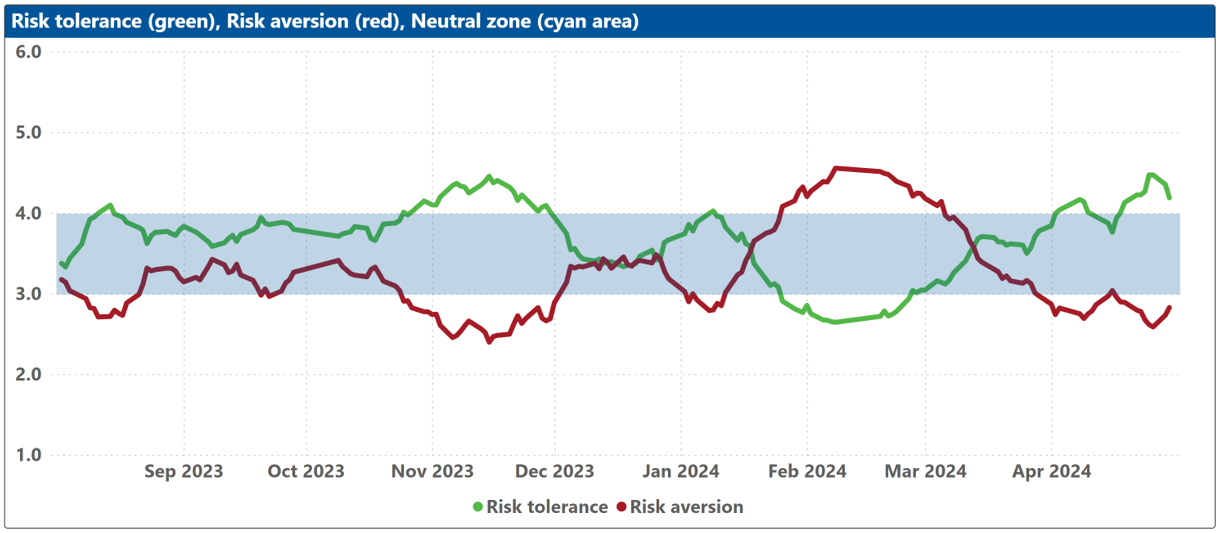
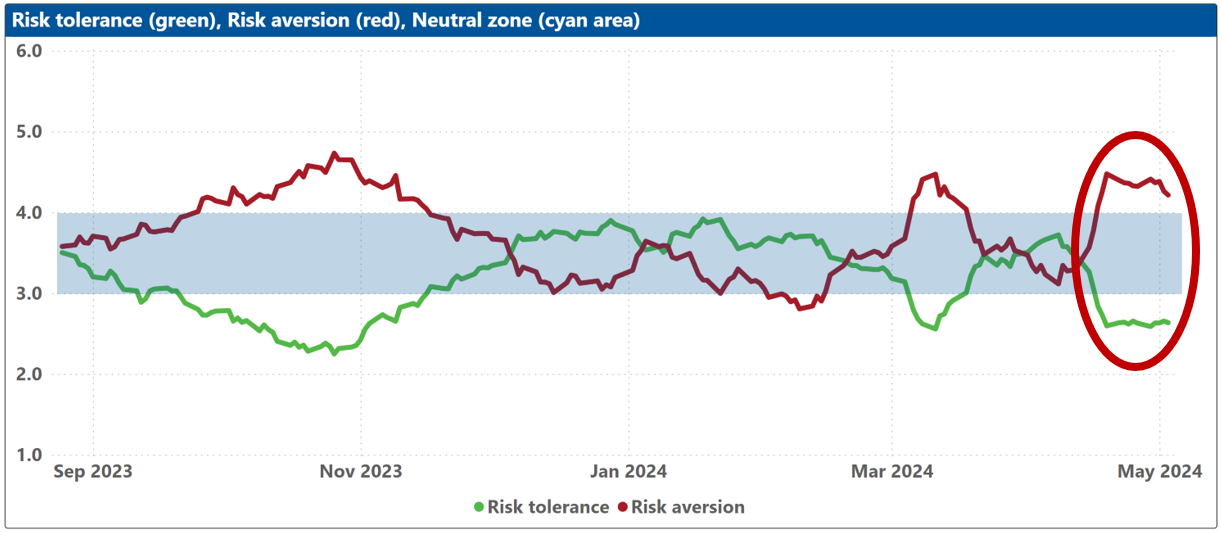
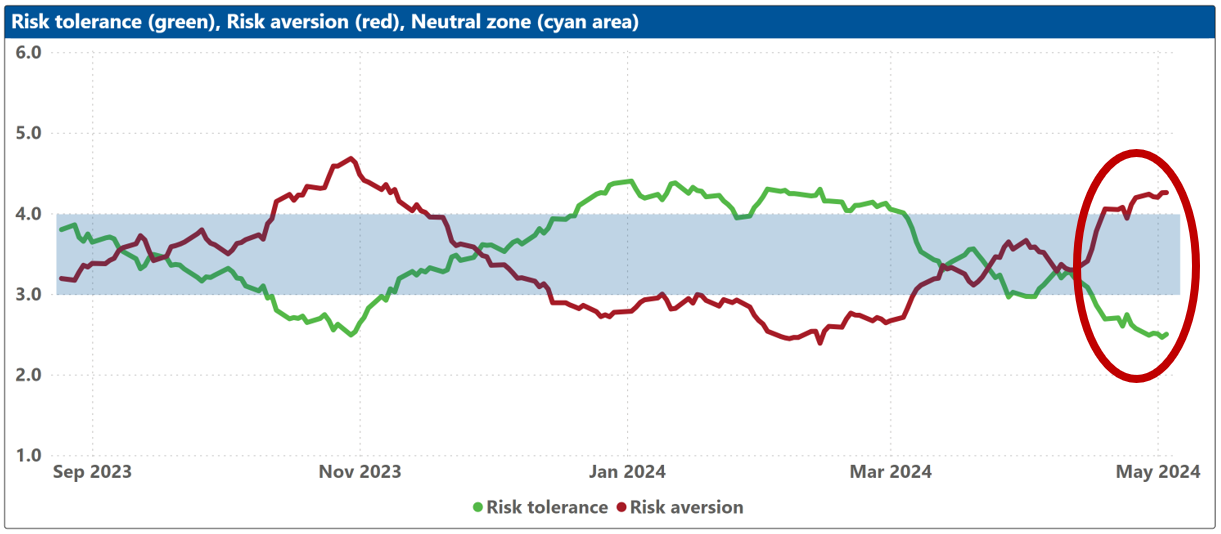
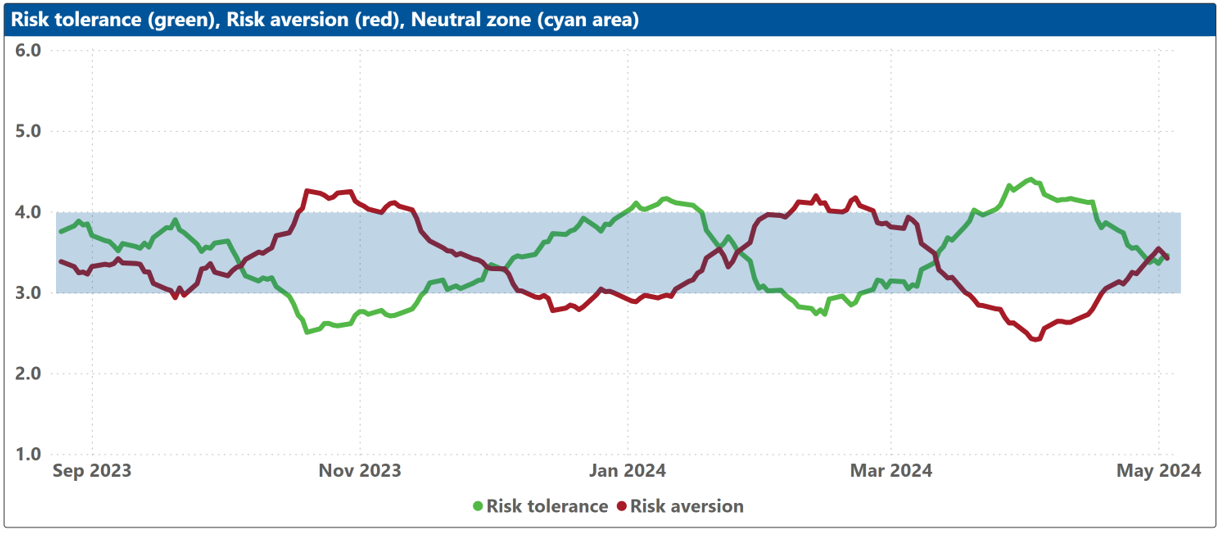
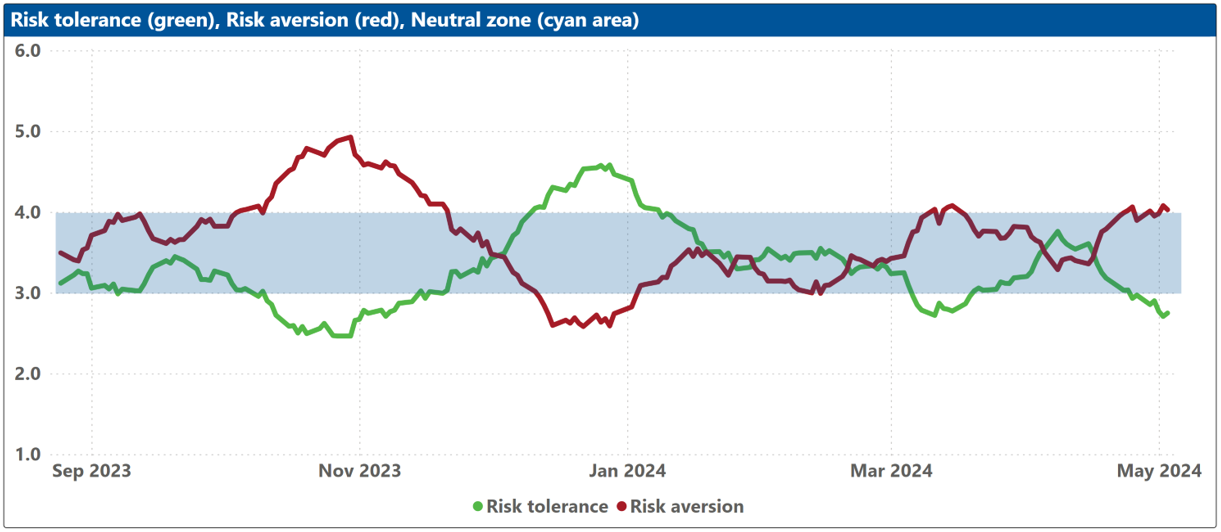
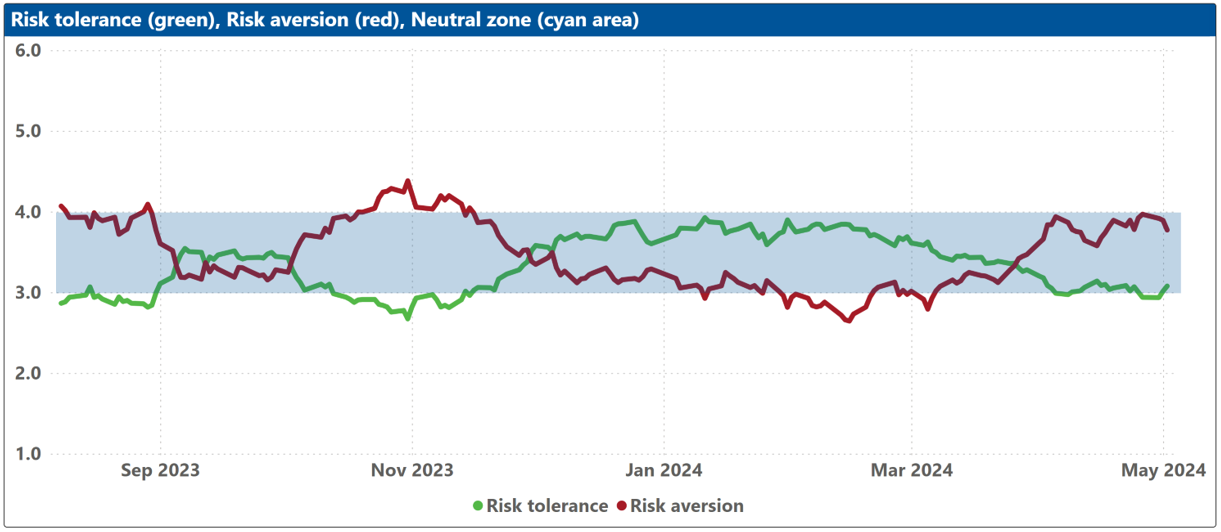
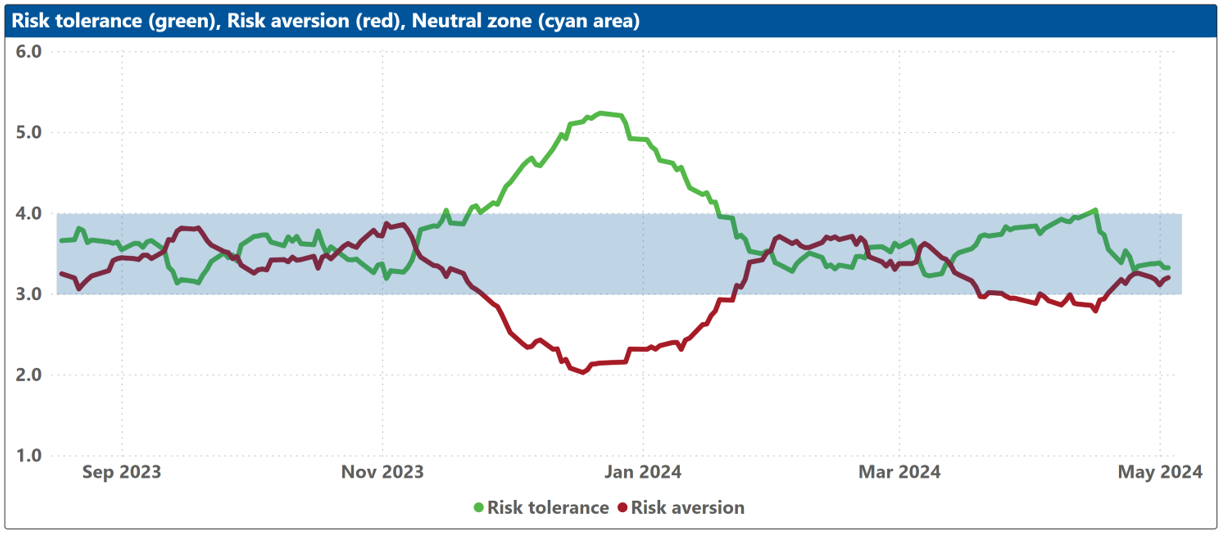
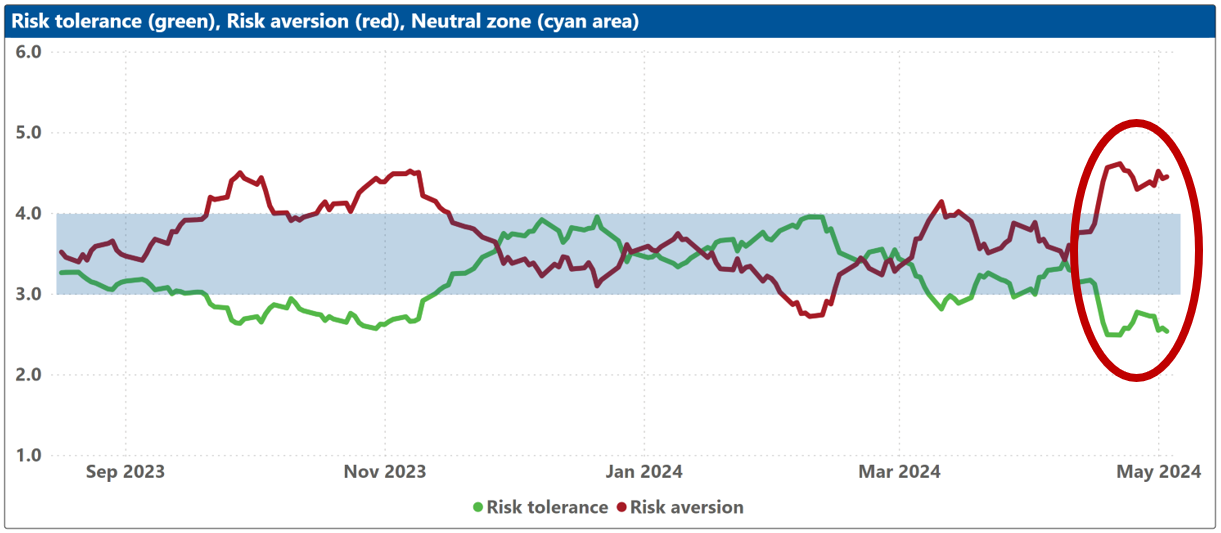
The bottom charts show the levels of both risk tolerance (green line) and risk aversion (red line) in the market. These represent investors’ demand and supply for risk. When risk tolerance (green line) is higher than risk aversion (red line), there are more investors looking to buy risk assets then investors willing to sell them (at the current price), forcing risk-tolerant investors to offer a premium to entice more risk-averse counterparts to take the other side of their trade, which drives markets up. The reverse is true when risk aversion (red line) is higher than risk tolerance (green line). The net balance between risk tolerance and risk aversion levels is used to compute the ROOF ratio in the top charts, representing the sentiment of the average investor in the market.
The blue shaded zone between levels 3-4 for both indicators represents a reasonable balance between the supply and demand for risk in the market. Conversely, when both lines are outside of this blue zone, the large imbalance in the demand and supply for risk can lead to an overreaction to unexpected news or risk events.