AXIOMA ROOF™ SCORE HIGHLIGHTS
WEEK OF MAY 13, 2024
Potential triggers for sentiment-driven market moves this week
- US: CPI, PPI, retail sales, industrial production and housing start data. Earnings from Home Depot, Cisco, and Walmart. Speeches by several Fed officials.
- Europe: ZEW Indicator of Economic Sentiment for Germany.
- APAC: China’s industrial production, retail sales, and unemployment data for April.
- Global: Investors are keeping one eye on US inflation figures and the other on developments in Rafah and North Ukraine.
Insights from last week's changes in investor sentiment:
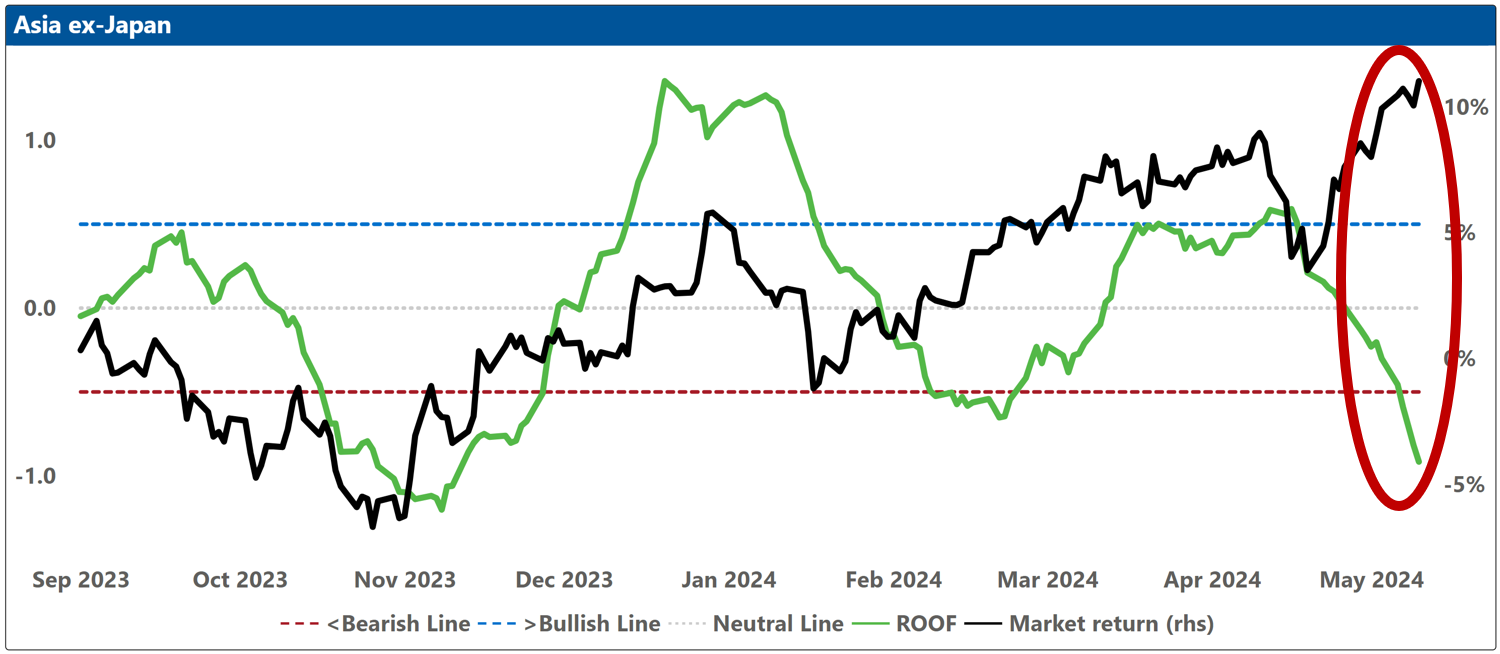
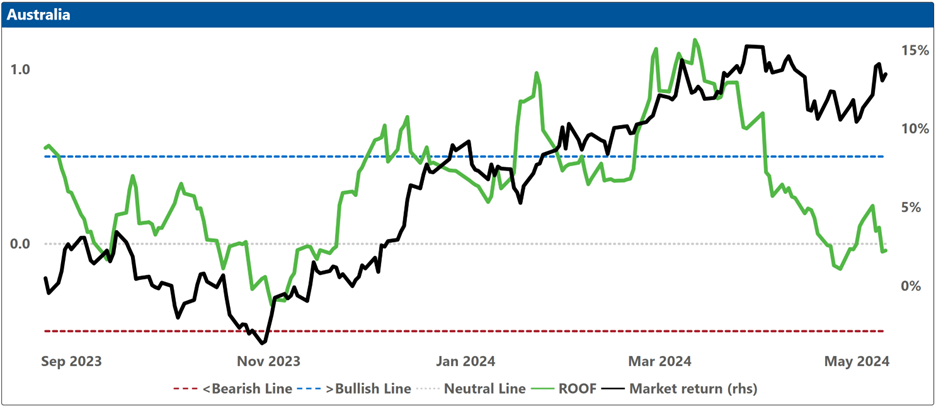
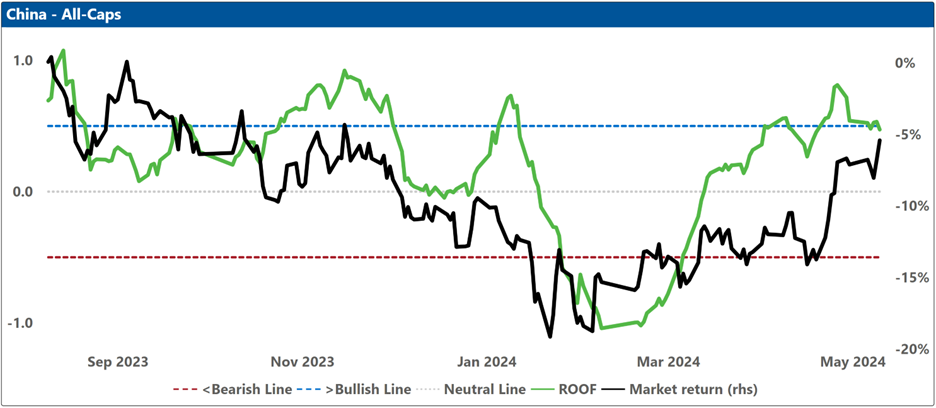
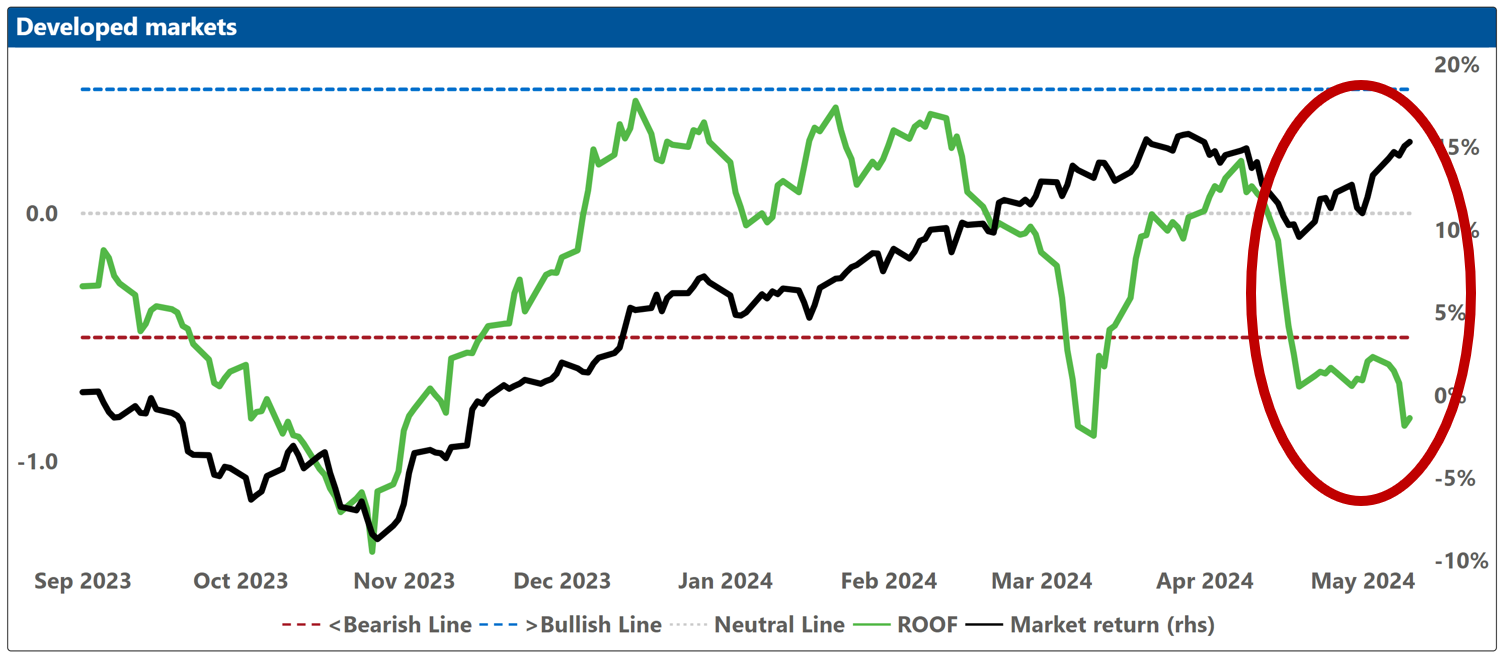
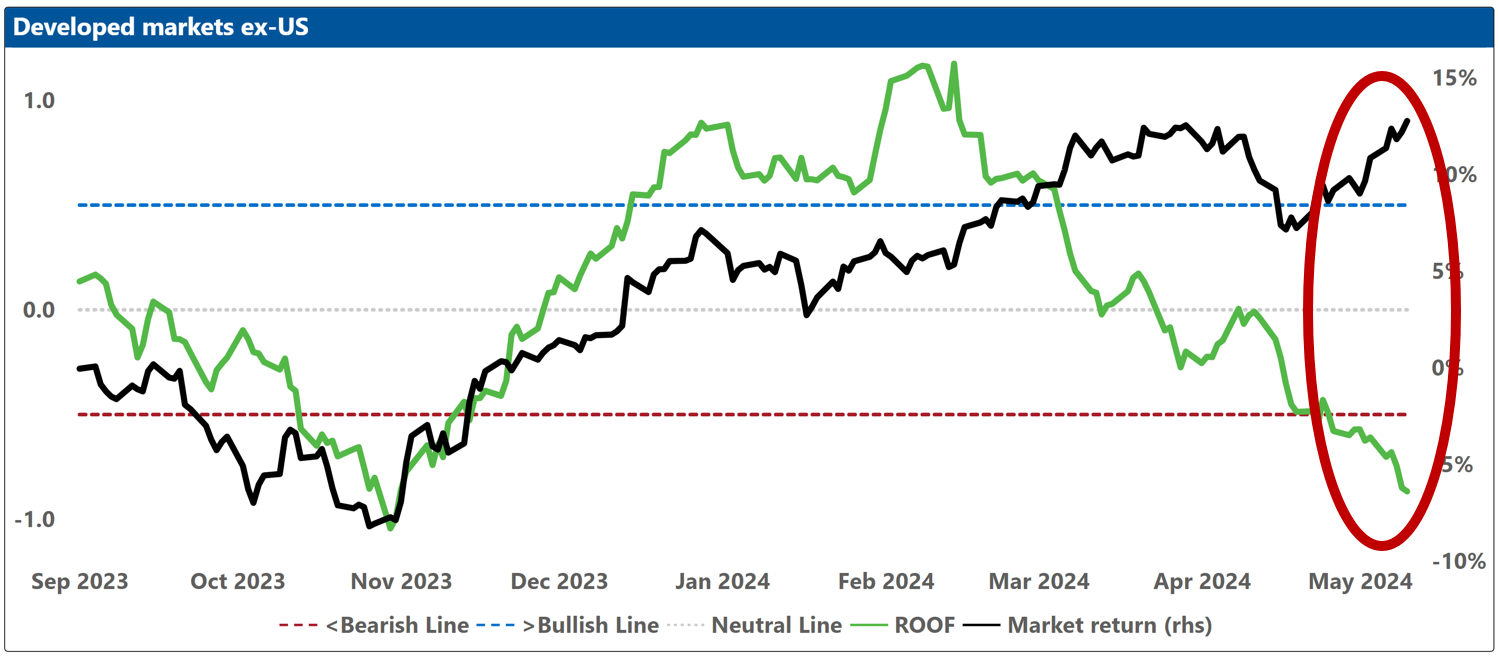
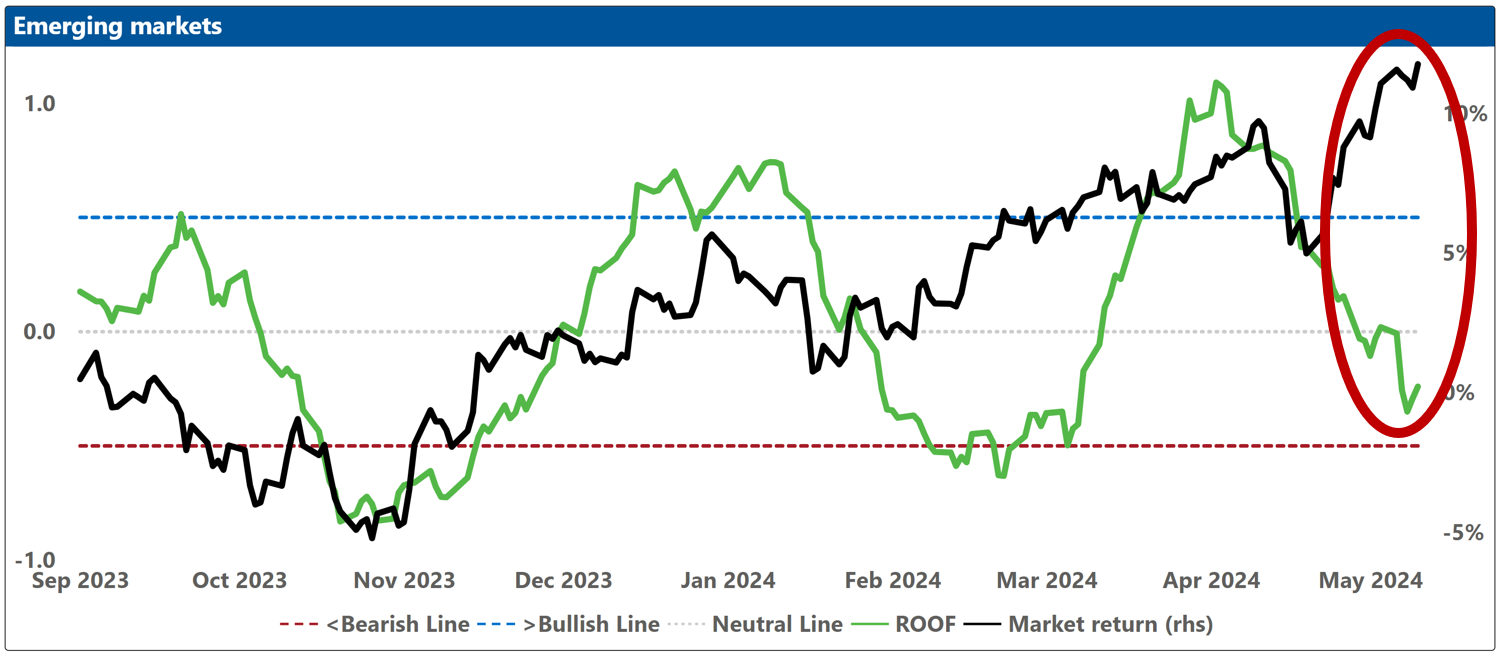
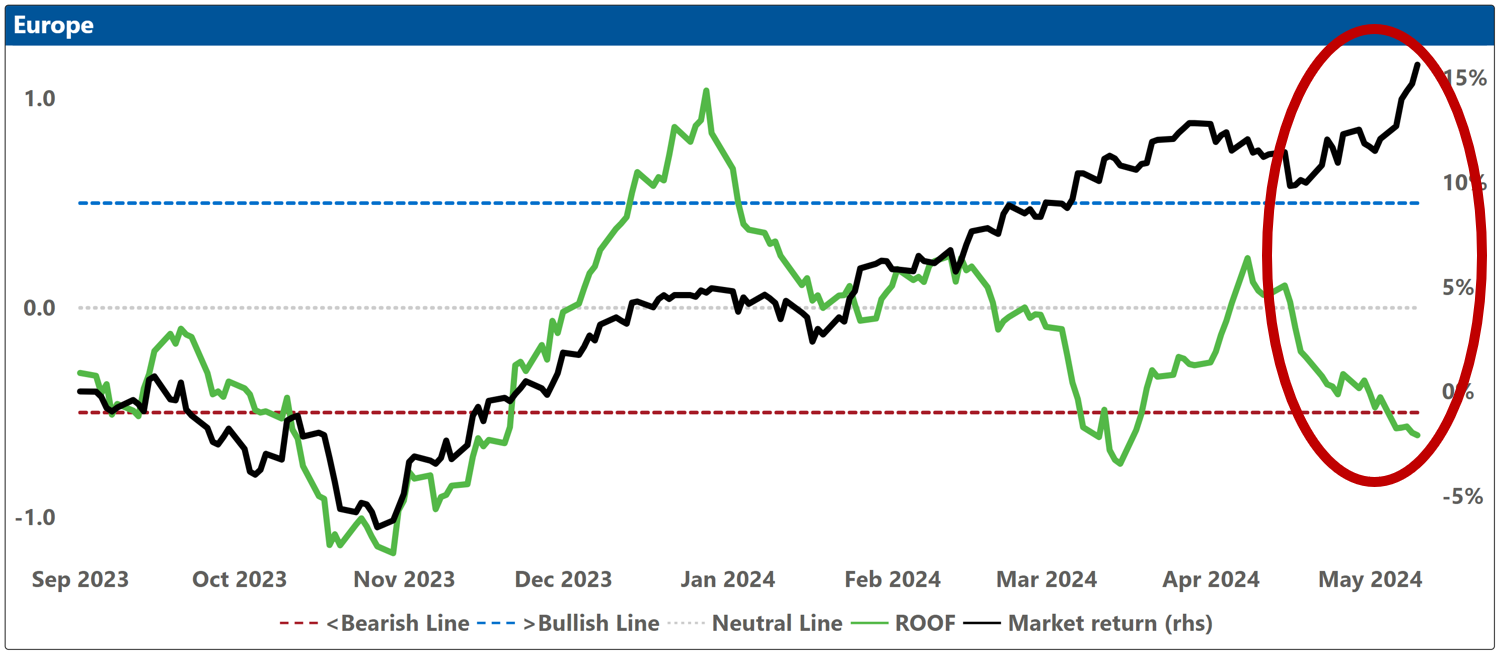
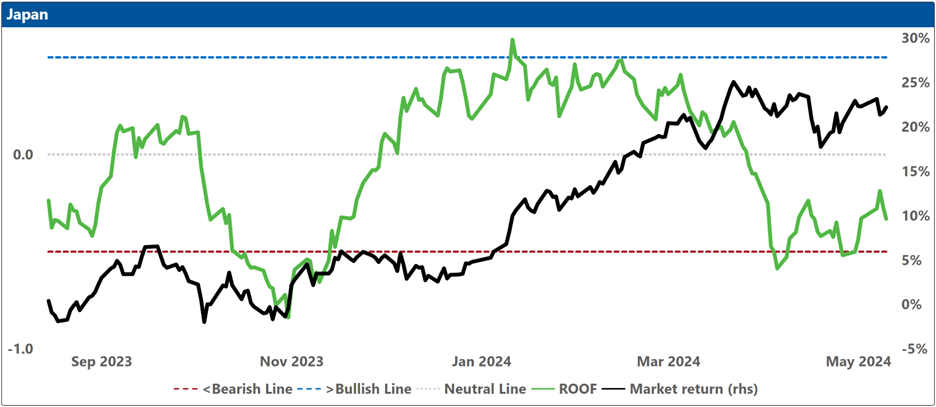
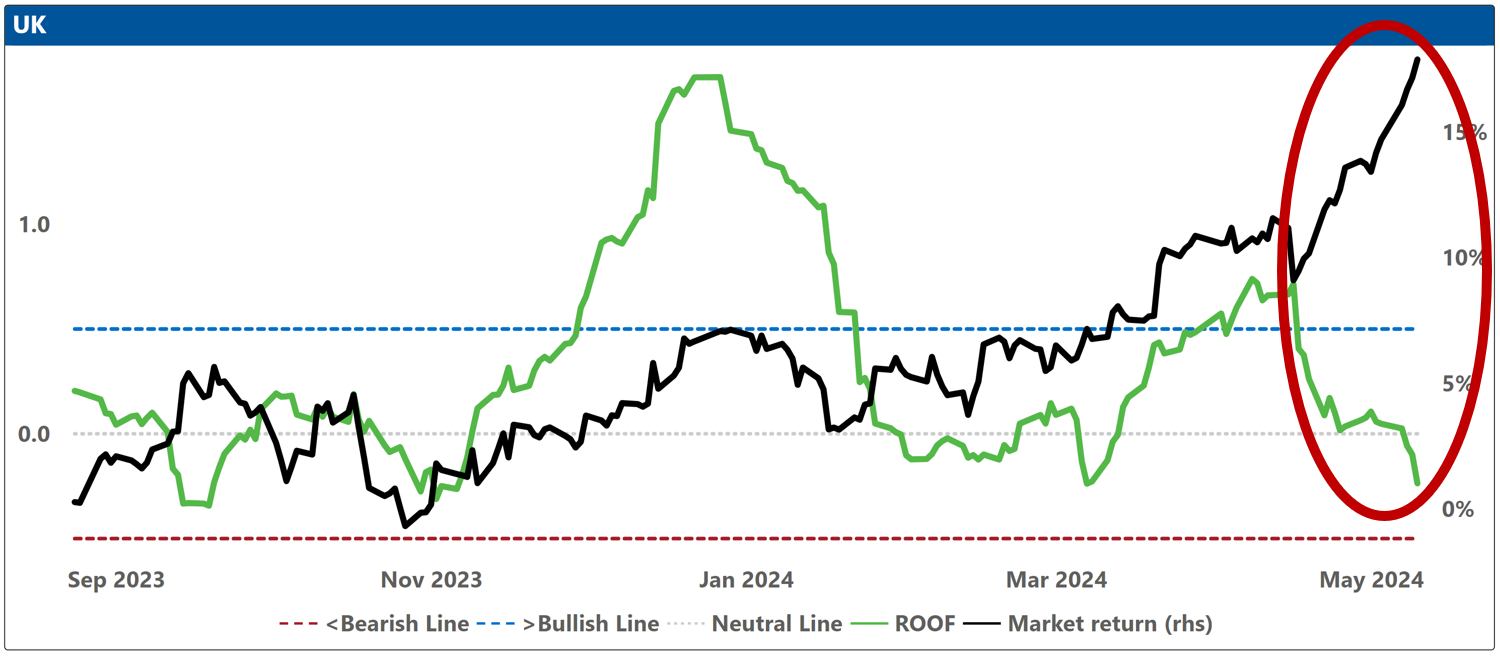
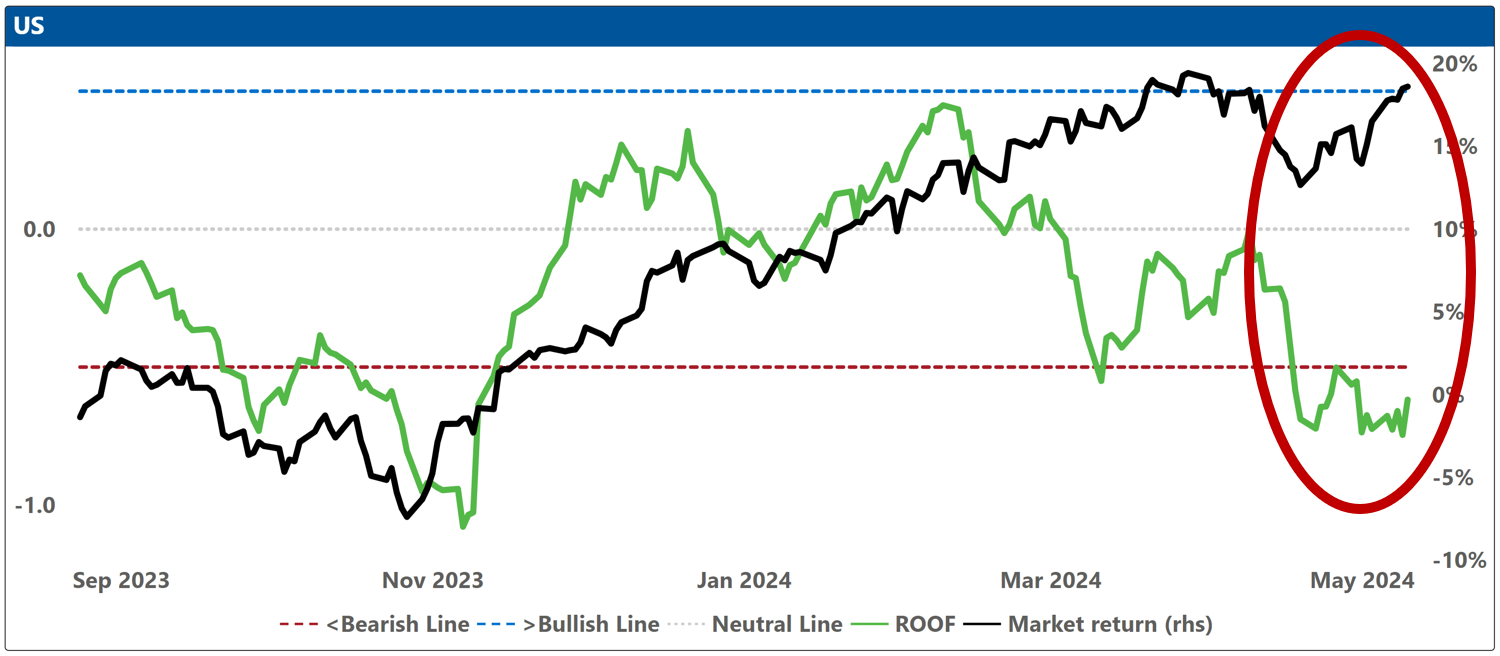
Investor sentiment declined across all markets we follow ending the week bearish in Asia ex-Japan, Global Developed Markets, Global Developed ex-US markets, Europe, and the US. Sentiment remains negative in Global Emerging Markets, Japan, and the UK. The only market with a still positive (but also weakening) sentiment was China. We note that in defiance of sentiment, markets continued to rise for the fourth consecutive week as (some) investors insist an interest rate cut is imminent in what increasingly feels like an enormous quid for a yet unspoken quo.
US monetary policy: This week, the focus is on Federal Reserve Chairman Powell's Tuesday speech and Wednesday's Consumer Price Index (CPI) data release. It's expected that core inflation will slightly decrease as the high April 2023 monthly increase of 0.468% drops from the annual rate calculation, to be replaced by an estimated 0.3% rise for April 2024, leading to a lower annual inflation rate of 3.56% from the 3.8% previously. Despite this, prevailing market sentiment is quite pessimistic, posing a risk of a downward overreaction should inflation figures unexpectedly rise. Conversely, a decline in inflation could trigger profit-taking among investors, who recognize that replacing the small forthcoming six monthly core inflation figures from 2023 with even smaller ones will be challenging in 2024 without a considerable economic deceleration.
US Presidential election: Both candidates continue to face their challenges. Biden has a youth and a pro-Palestine lobby problem passionate enough to give some Orwellian gravitas to the student protests. Trump, meanwhile, continues to (very publicly) deal with the multiple attempts to legally defenestrate him from the ballot box in November. The only thing we have learned so far from these proceedings is that Donald Trump is as rich as Michael Jordan, as powerful as Shaqueal O’Neal, and as controversial as Dennis Rodman. This race remains too weird close to call and won’t affect markets until the home stretch.
Geopolitics: The ongoing conflicts in the two regions are evidently exerting pressure on the outlook of investors and may persist in influencing market sentiment in the coming week. The emergence of a new offensive by Russia in the northern sector of Ukraine's Kharkiv region, alongside indications that Israel may initiate a ground invasion into Rafah following its war cabinet's unanimous decision to proceed with military operations, are ongoing concerns. Additionally, investors are worried about the warming relations between President Xi of China and President Vladimir Putin of Russia. President Xi's recent tour of Europe has done little to mitigate apprehensions regarding these geopolitical developments, nor has it alleviated concerns about an impending trade conflict between Europe and China.
Financial markets continue to be propelled by the ongoing AI craze which dominates daily news reports. This has prompted Wall Street to respond with a veritable Cambrian explosion of AI-focused investment products, drawing parallels to the enthusiasm for Environmental, Social, and Governance (ESG) investments a decade ago. As a result, there is a persistent concentration risk within both the United States and European markets being picked-up by our statistical models, which forecast a higher level of risk compared to our fundamental models. While fundamental models are reacting positively to encouraging economic indicators and earnings reports that have exceeded expectations thus far, statistical models advise caution, suggesting that despite recent profitable outcomes, there is potential for significant market disruptions. Put another way, “You’ve made some good money here, great. But a whole can of hell can just as easily open up, too” (a.k.a., saying the quiet part out loud).
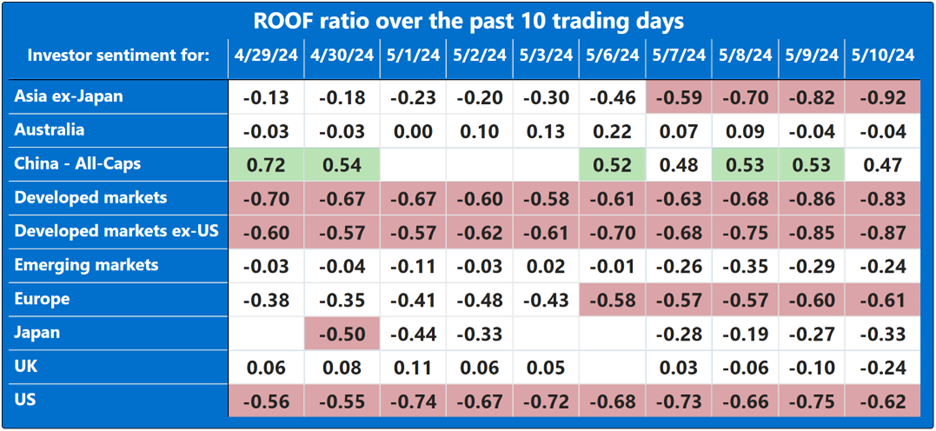
Note: green background = bullish, red background = bearish
Changes to investor sentiment over the past 180 days for the markets we follow:
How to read these charts: The top charts show the ROOF ratio (investor sentiment) in green (left axis), against the cumulative returns of the underlying market in black (right axis). The horizontal red line at -0.5 (left axis) represents the frontier between a negative sentiment (-0.2 to -0.5) and a bearish one (<-0.5), and the horizontal blue line at +0.5 (left axis) represents the frontier between a positive sentiment (+0.2 to +0.5) and a bullish one (>+0.5). Around the horizontal grey line at 0.0 (left axis), sentiment can be considered neutral (-0.2 to +0.2).
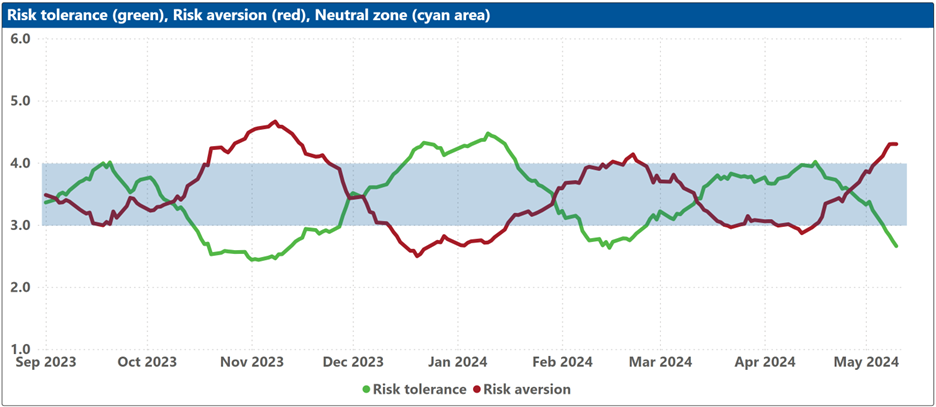
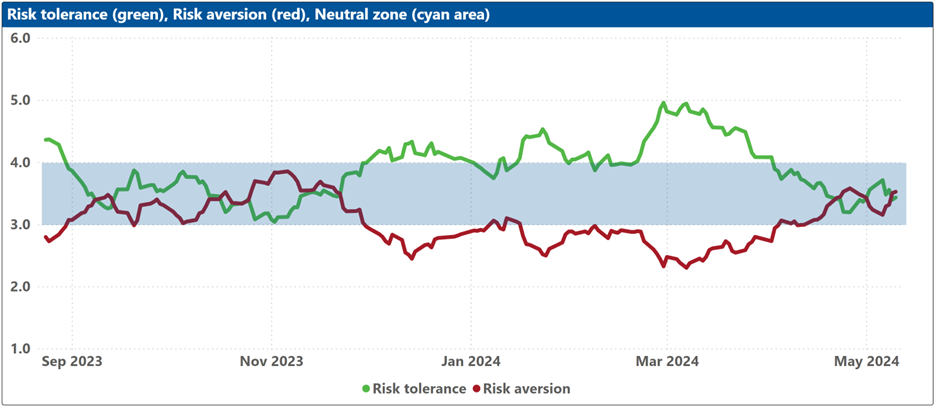
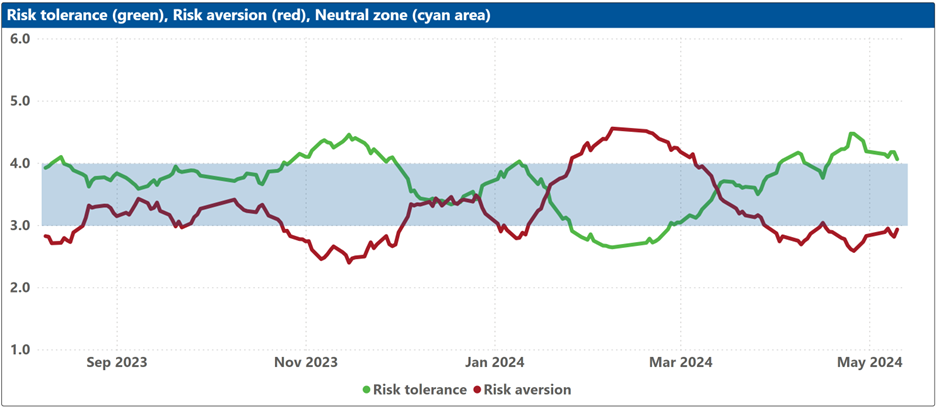
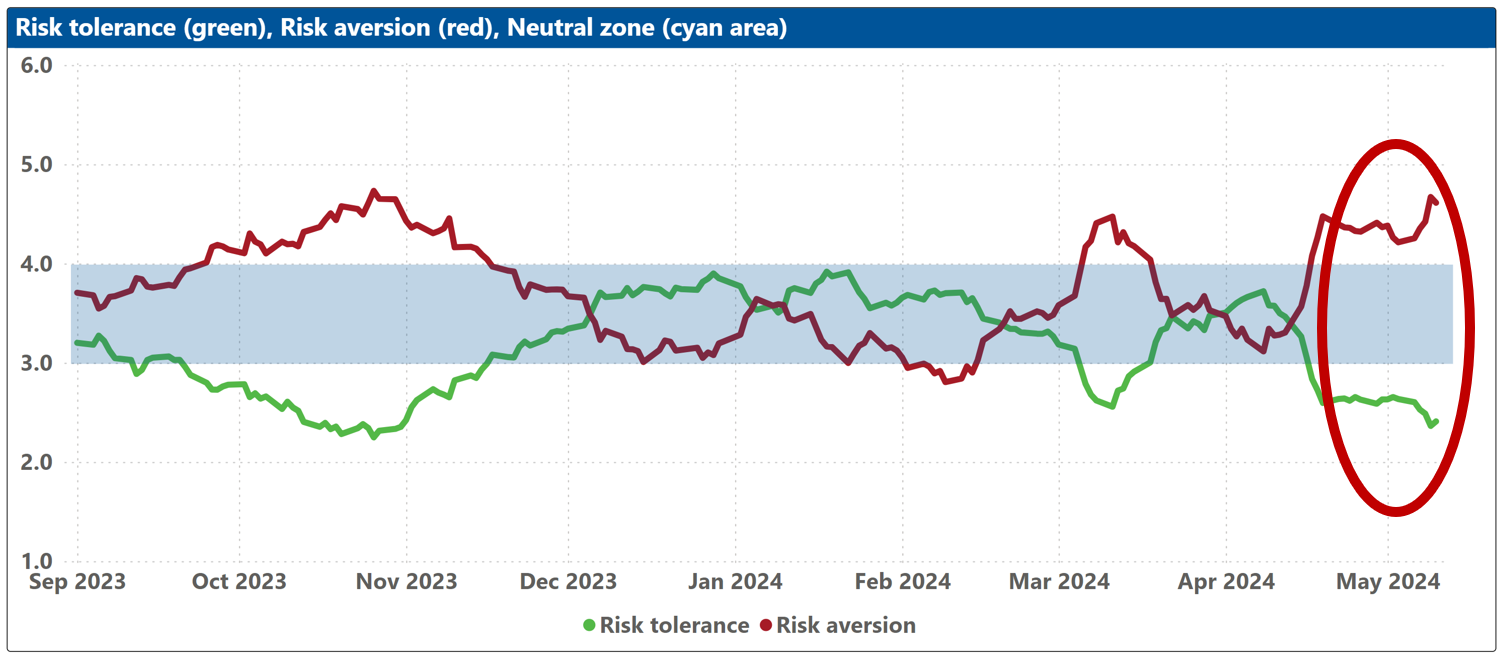
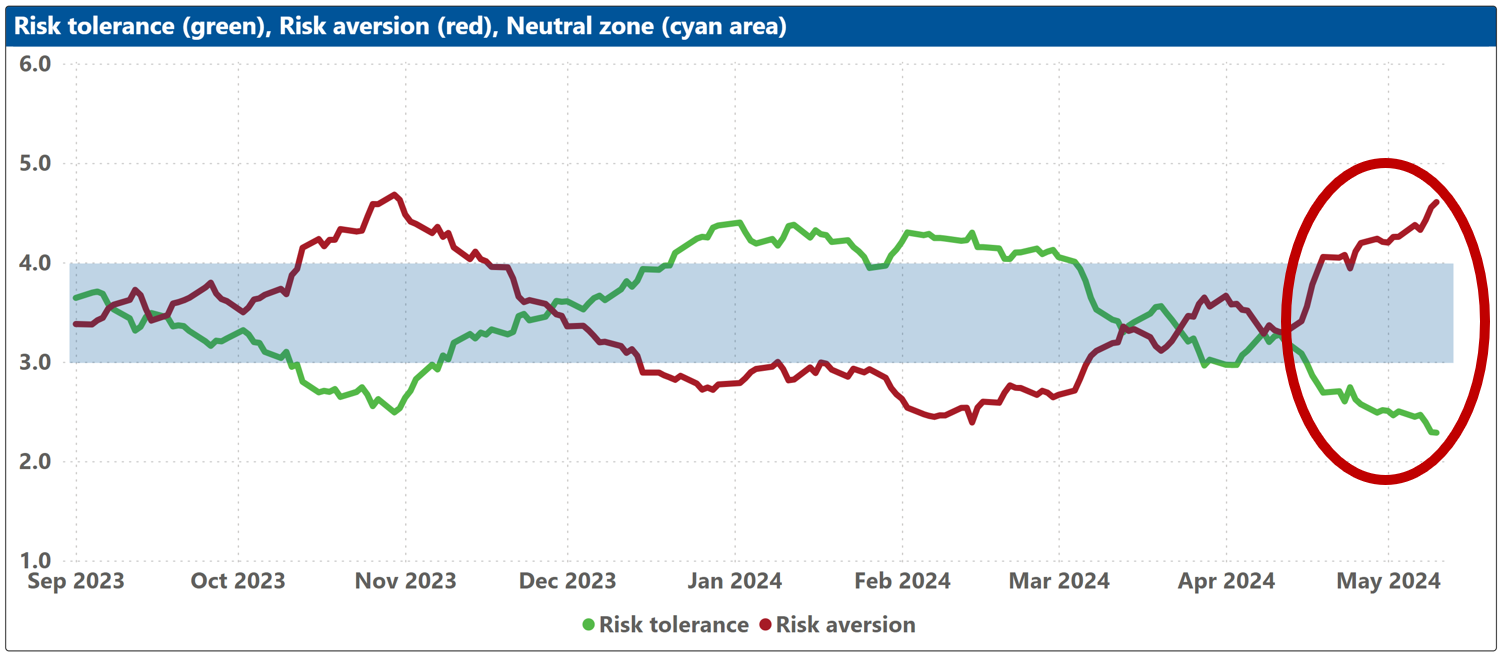
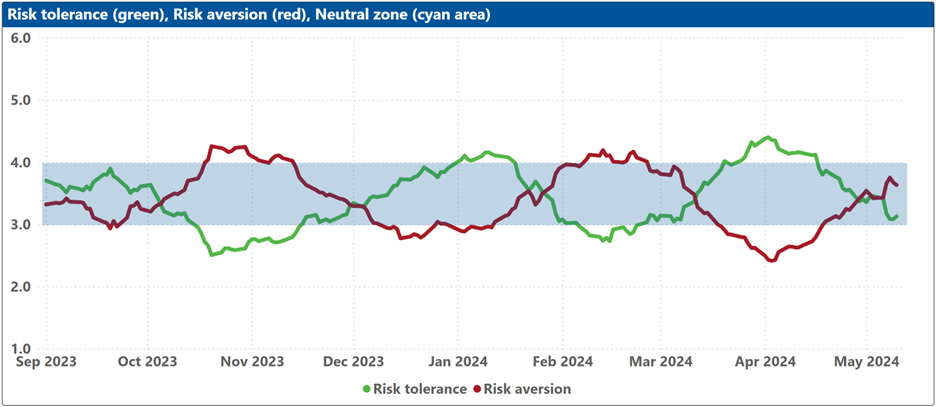
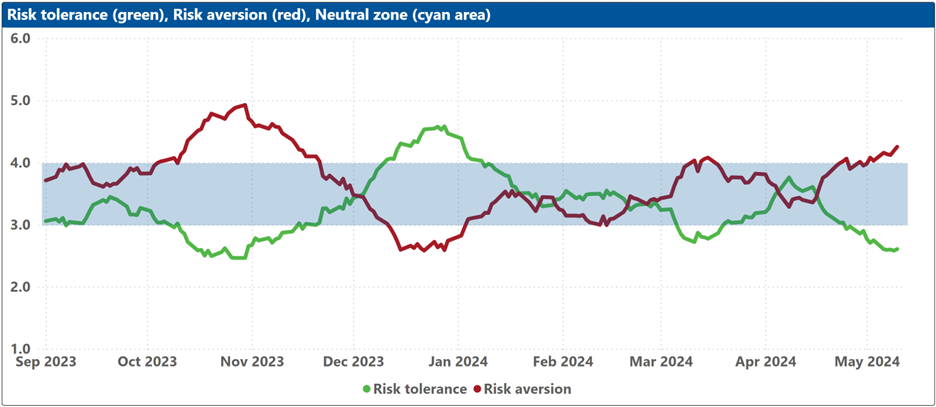
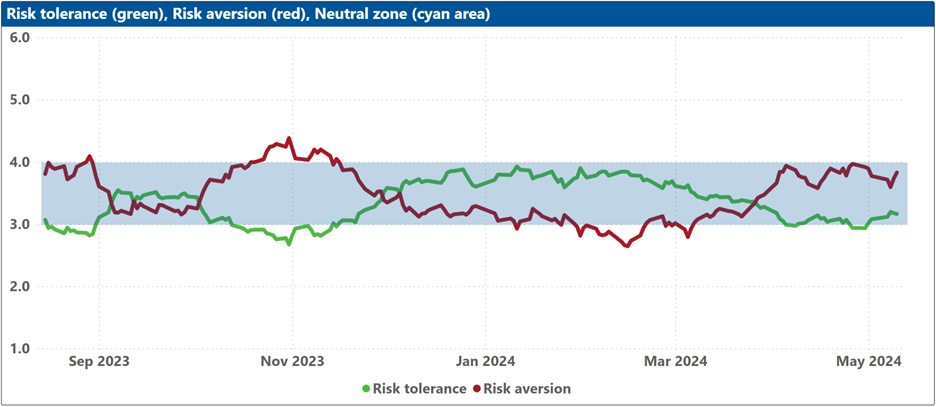
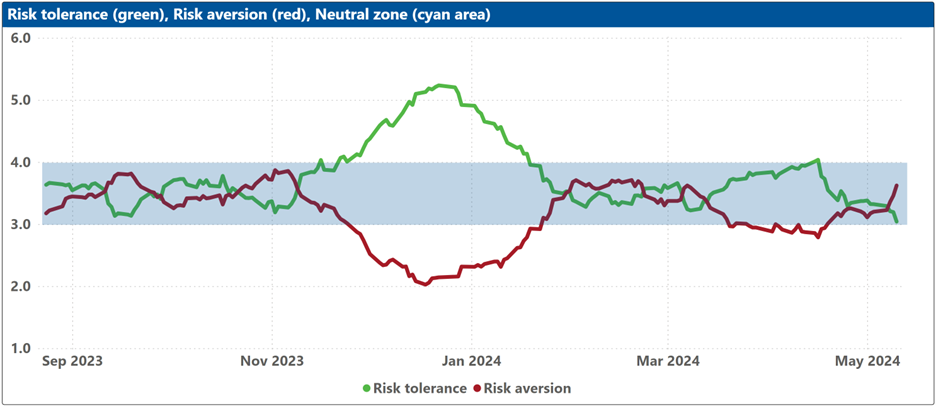
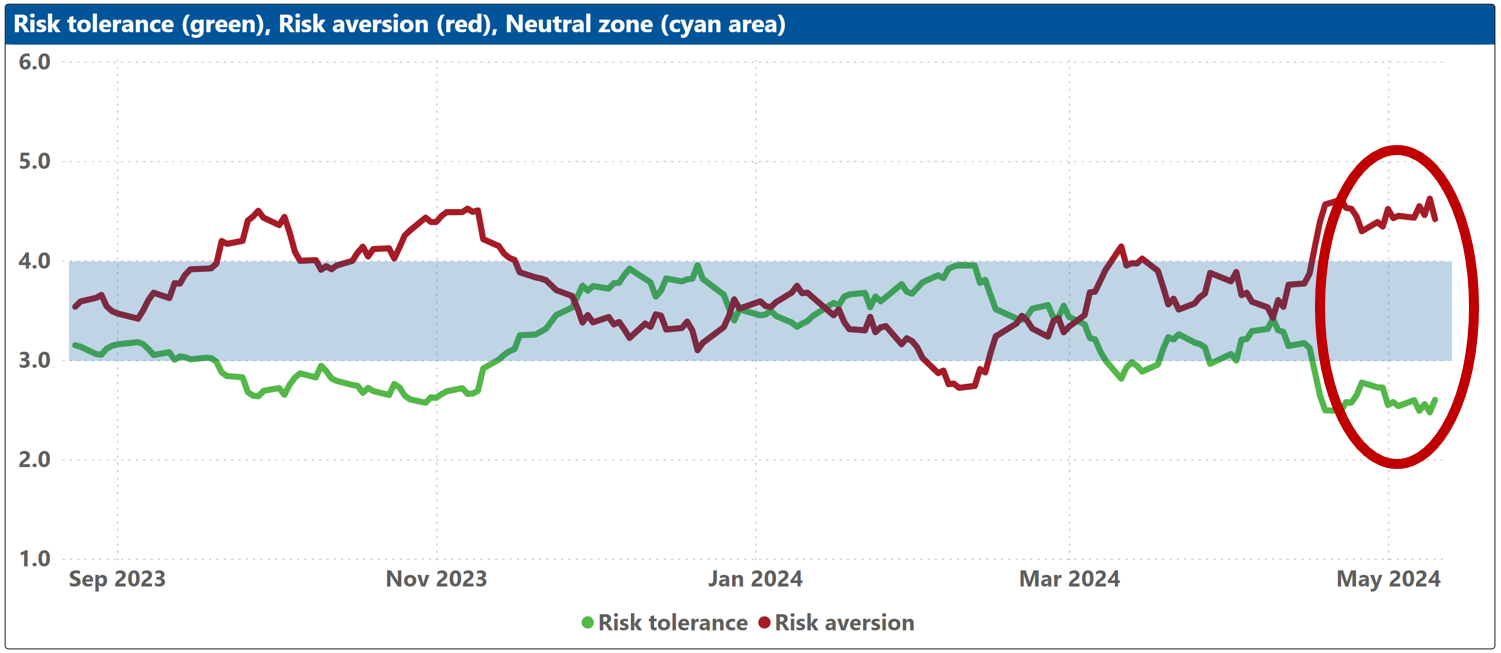
The bottom charts show the levels of both risk tolerance (green line) and risk aversion (red line) in the market. These represent investors’ demand and supply for risk. When risk tolerance (green line) is higher than risk aversion (red line), there are more investors looking to buy risk assets then investors willing to sell them (at the current price), forcing risk-tolerant investors to offer a premium to entice more risk-averse counterparts to take the other side of their trade, which drives markets up. The reverse is true when risk aversion (red line) is higher than risk tolerance (green line). The net balance between risk tolerance and risk aversion levels is used to compute the ROOF ratio in the top charts, representing the sentiment of the average investor in the market.
The blue shaded zone between levels 3-4 for both indicators represents a reasonable balance between the supply and demand for risk in the market. Conversely, when both lines are outside of this blue zone, the large imbalance in the demand and supply for risk can lead to an overreaction to unexpected news or risk events.