
AXIOMA ROOF™ SCORE HIGHLIGHTS
WEEK OF MAY 20, 2024
- US: FOMC minutes and speeches by several Fed officials. Manufacturing and services PMI, durable goods orders, and new home sales data. Earnings from Nvidia and Target.
- Europe: UK inflation (est. 2.1%) and retail sales data. PMI and consumer confidence data for the Eurozone.
- APAC: BoC interest rate decision. Japan inflation data. Details of China’s plan to purchase unsold homes to rescue its indebted real estate sector.
- Global: Ukraine and Gaza continue to dominate the front pages. Any escalation in those conflicts will trigger some profit taking.
Insights from last week's changes in investor sentiment:
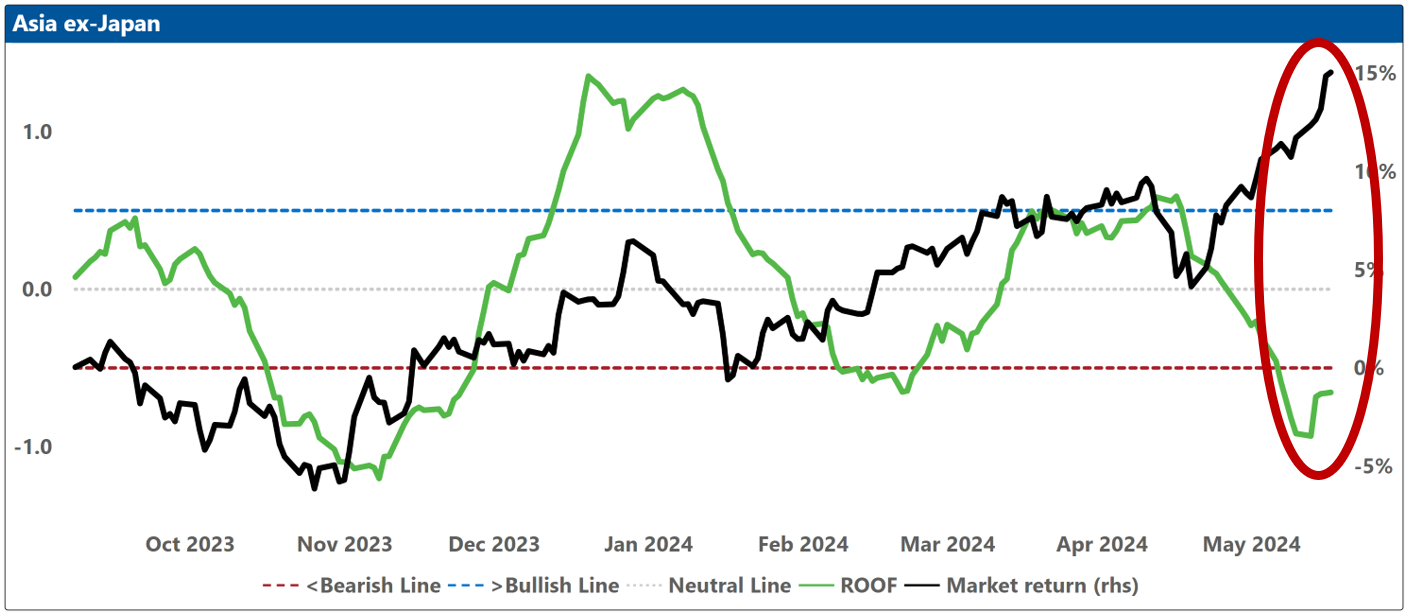
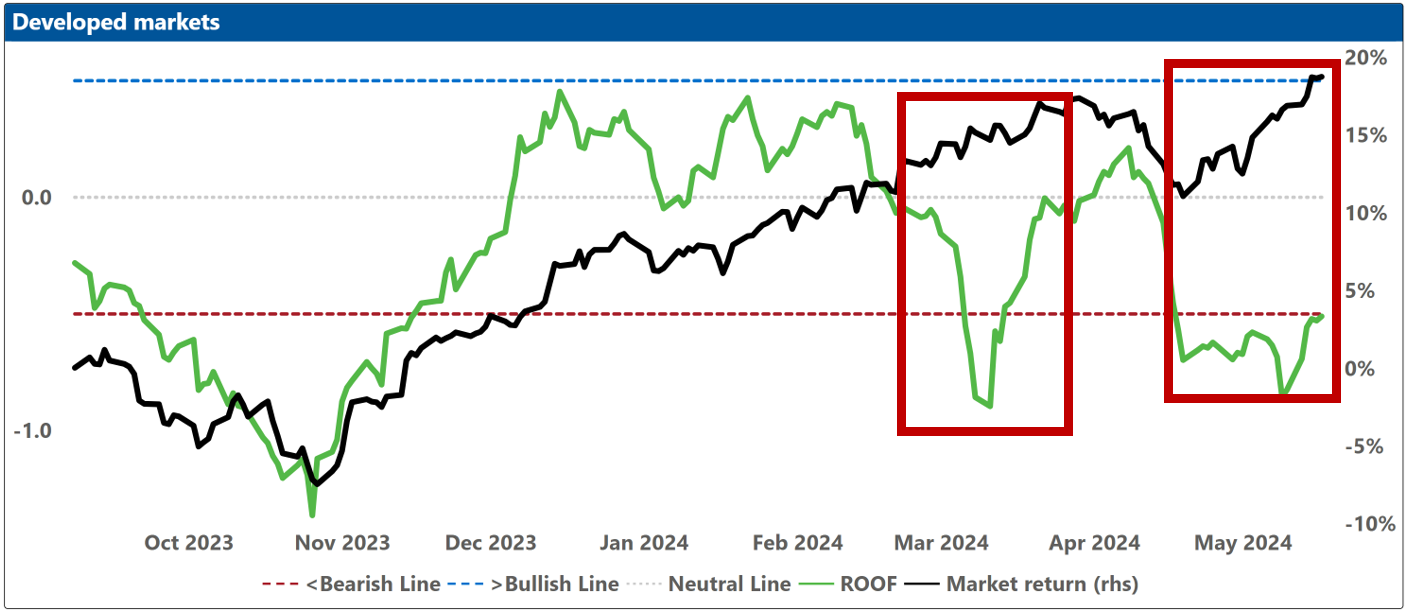
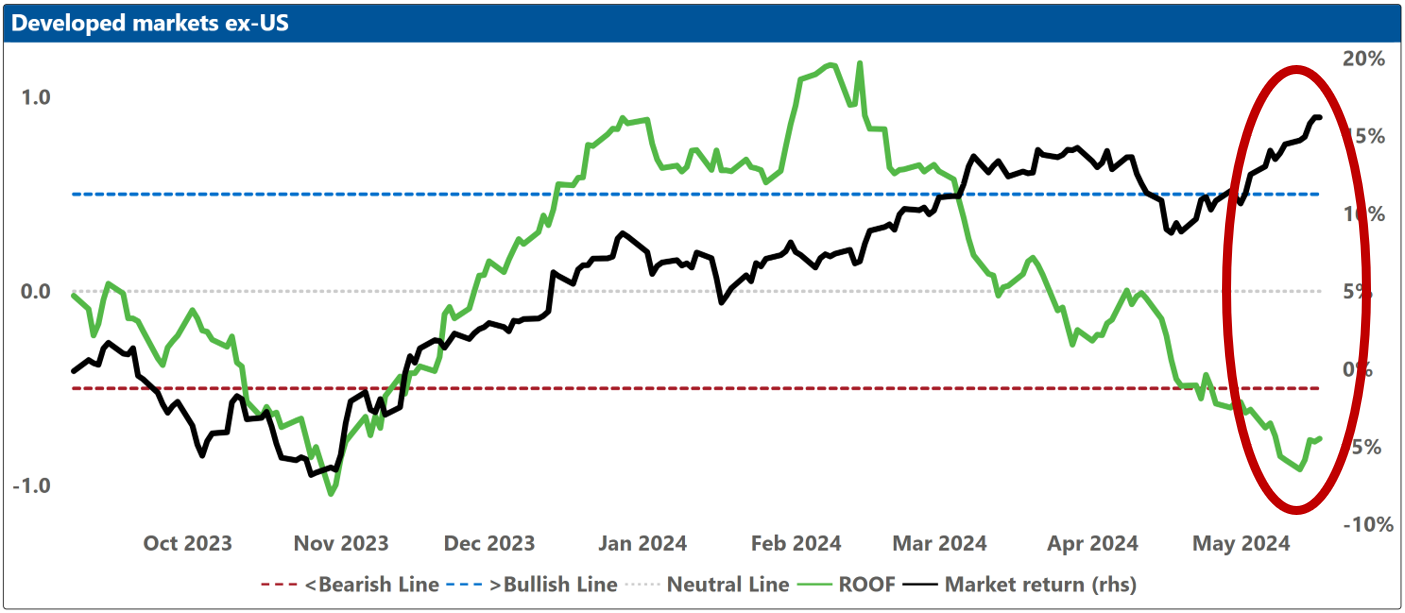
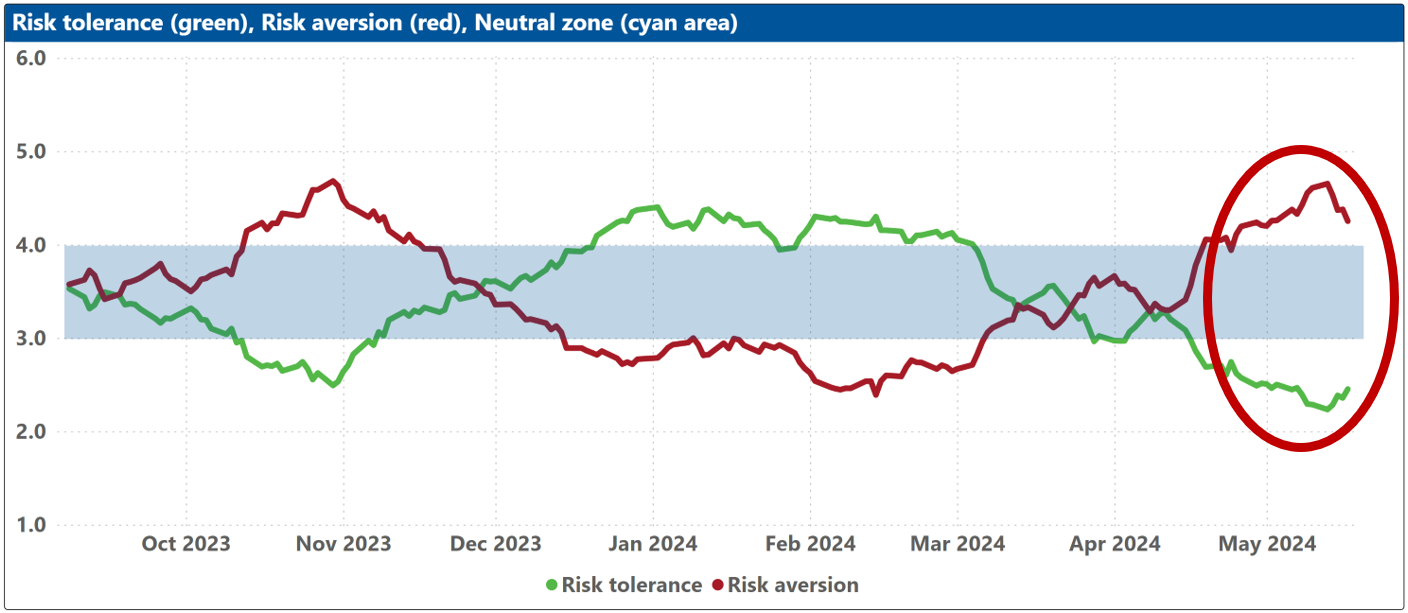
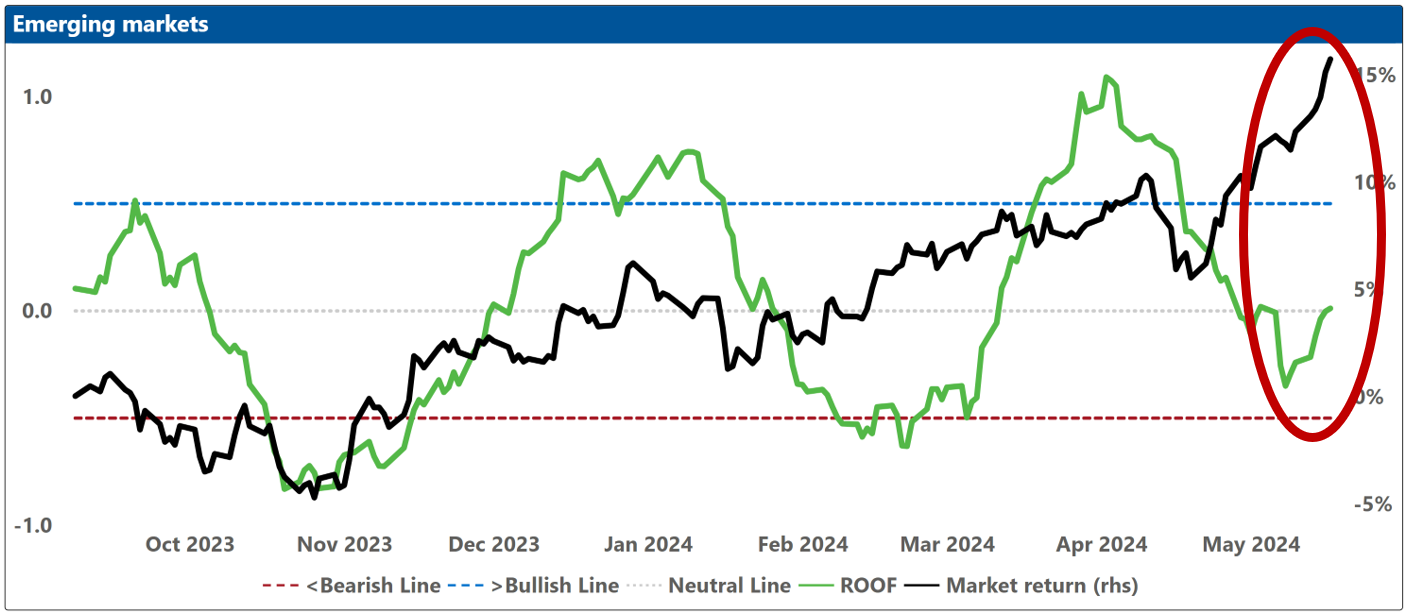
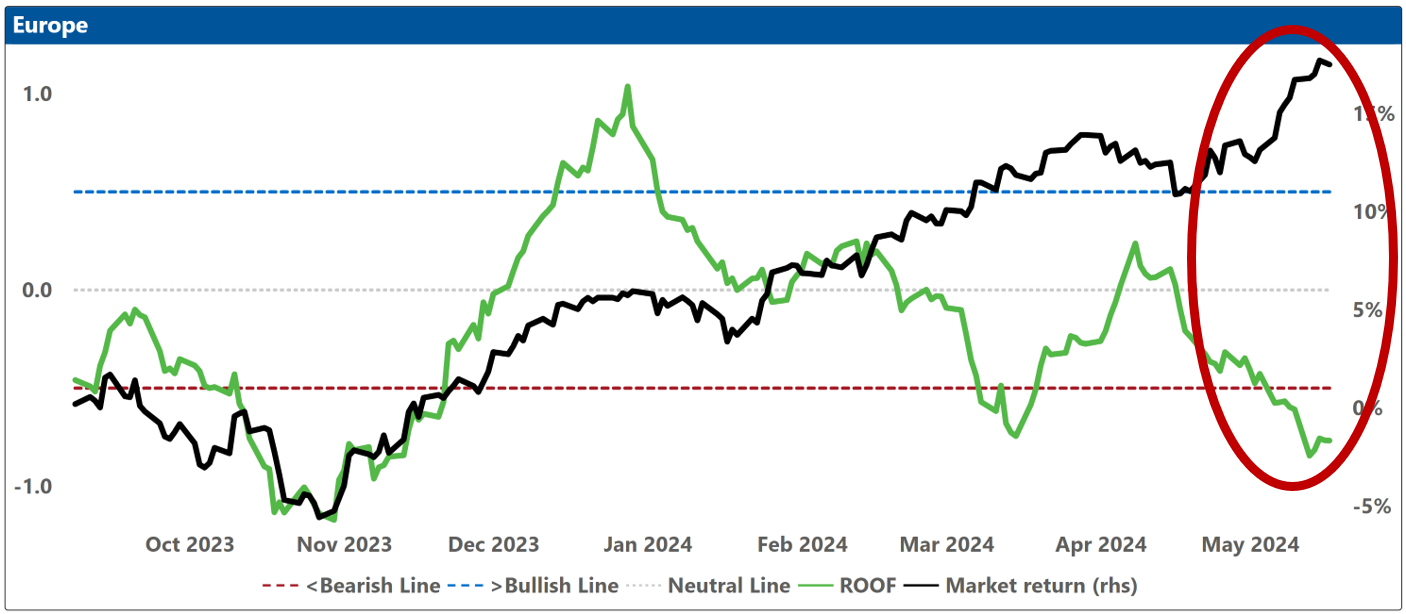
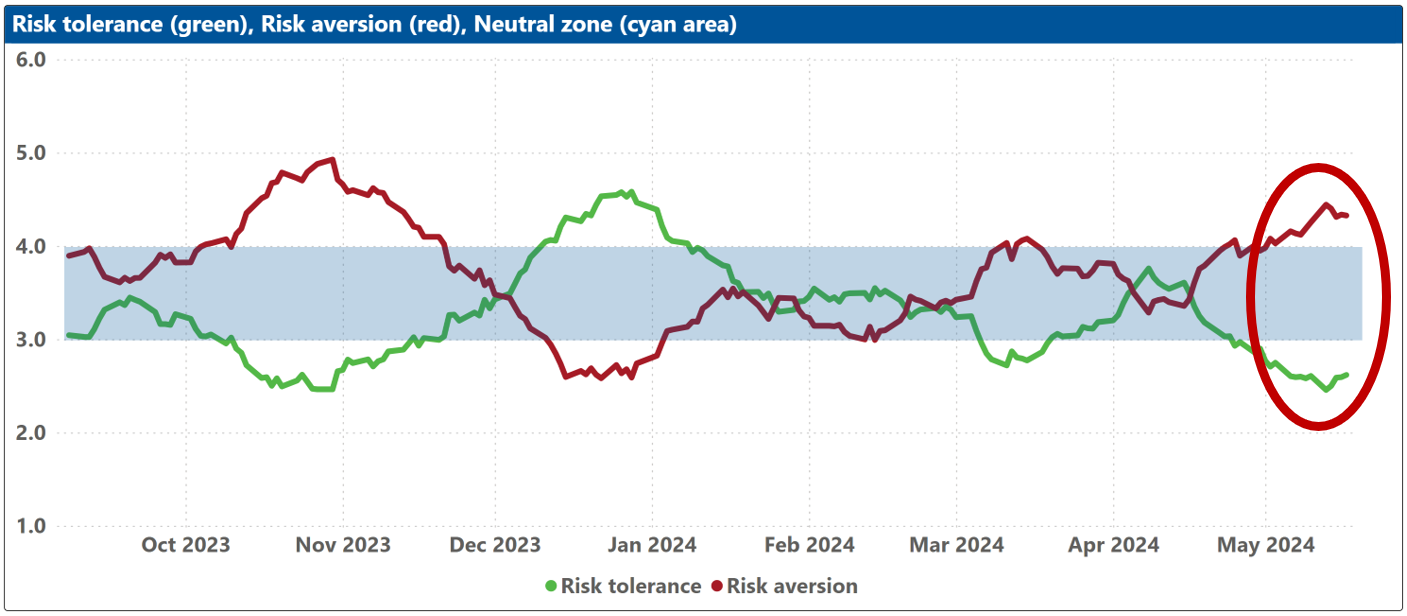
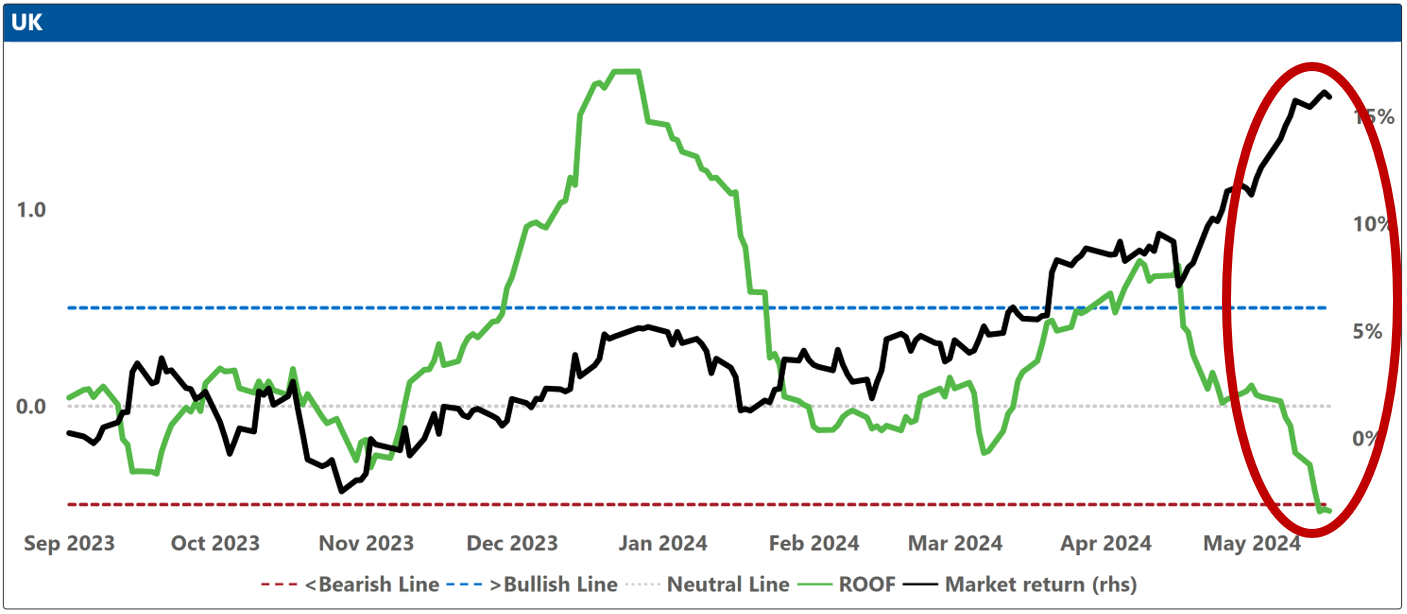
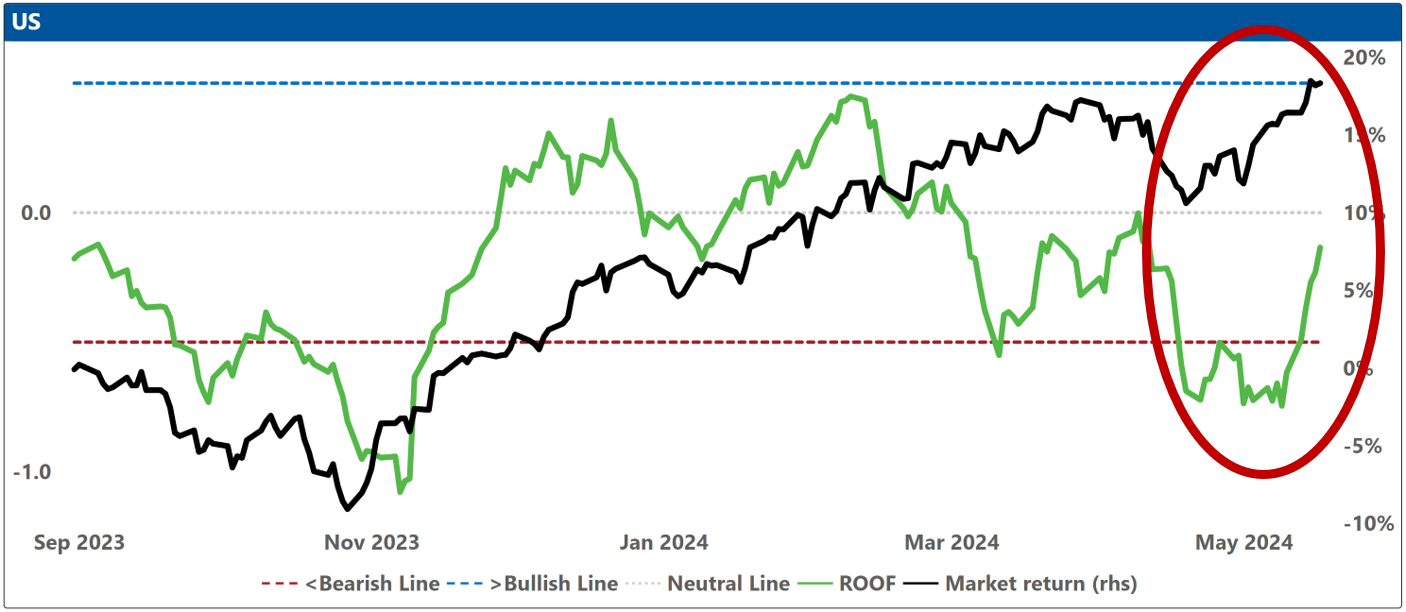
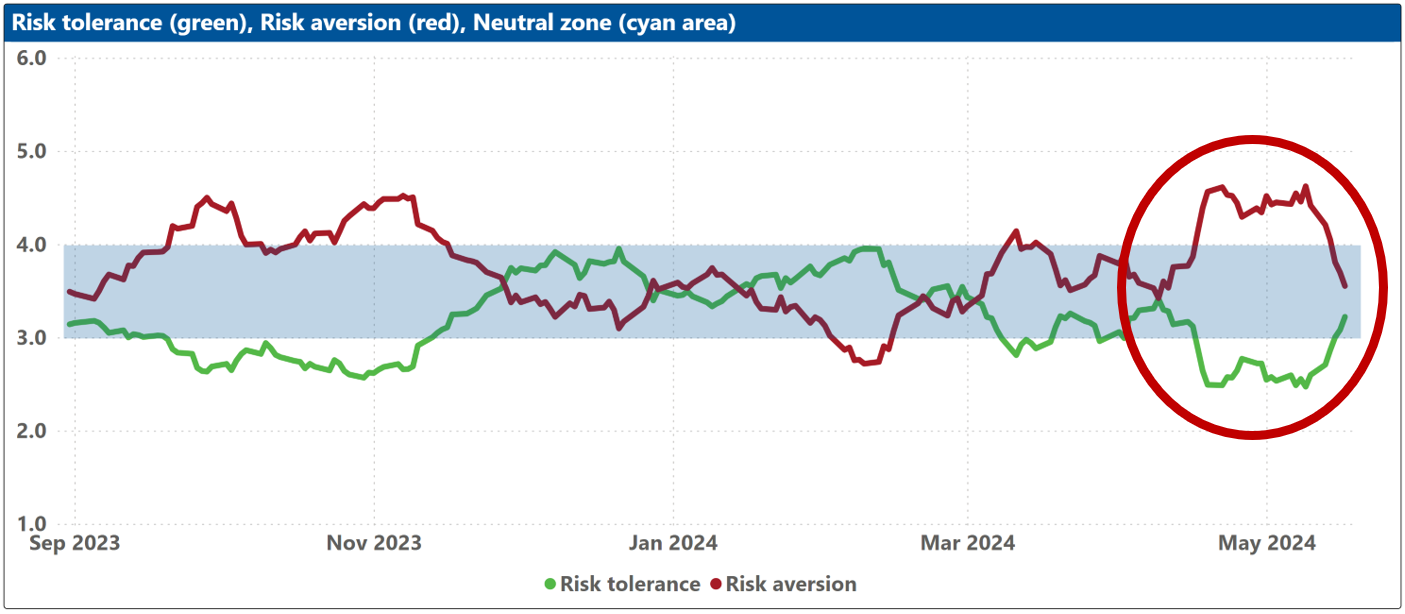
Investor sentiment seems to have bottomed-out last week, with a modest rebound observed in certain markets, including Asia ex-Japan, Global Developed Markets, Global Developed Markets ex-US, and the US itself. Conversely, Europe stood out as an area where investor confidence stayed low, and in the United Kingdom, investor sentiment deteriorated further, turning bearish for the first time since April 2023! The biggest improvement in sentiment was among US investors, where it now looks like the beat down of April was just a build up for May.
For a decade and a half, quantitative easing has lived in that neighborhood of investors’ collective consciousness called Ubiquitous, at times displacing valuation and profitability. Central banks have been perceived as a reliable safety net, poised to intervene when needed. However, the current economic landscape does not call for such intervention. The stock market and corporations, with earnings growth of 8.4% according to Bloomberg, have outpaced expectations, and are not in need of rescue. Investors will need to learn that ubiquity does not connote a timeless classic and that while inflation may now matter less to lots of them, it still matters lots to a few central bankers.
As the earnings reporting season concludes, the focus of media coverage will shift towards geopolitics, macroeconomic developments, and domestic political affairs. In Europe, the forthcoming EU elections on June 6 will unfold against the backdrop of the ongoing war in Ukraine, rising popularity of right-wing parties, and security concerns (e.g., Slovakia). In the United States, the presidential campaigns of Biden and Trump have consented to two debates, scheduled for June on CNN and September on ABC and while this will not be a spectator sport, rules of engagement had to be put in place to avoid open conflict and partially so the networks can claim innocence in the event of the finger.
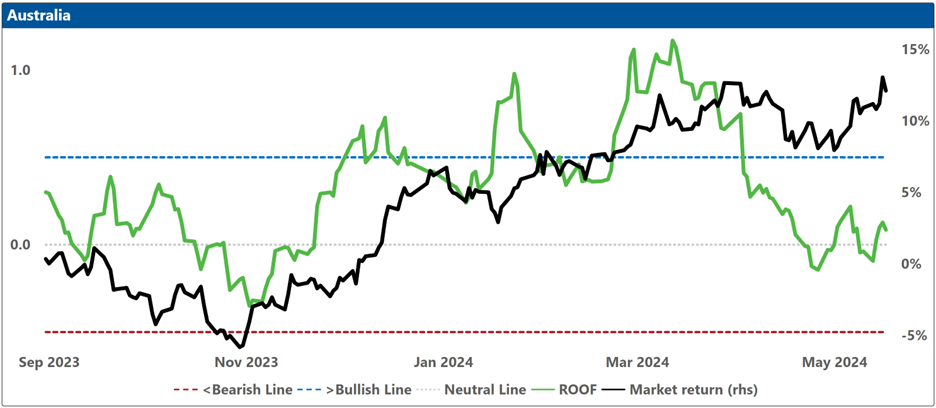
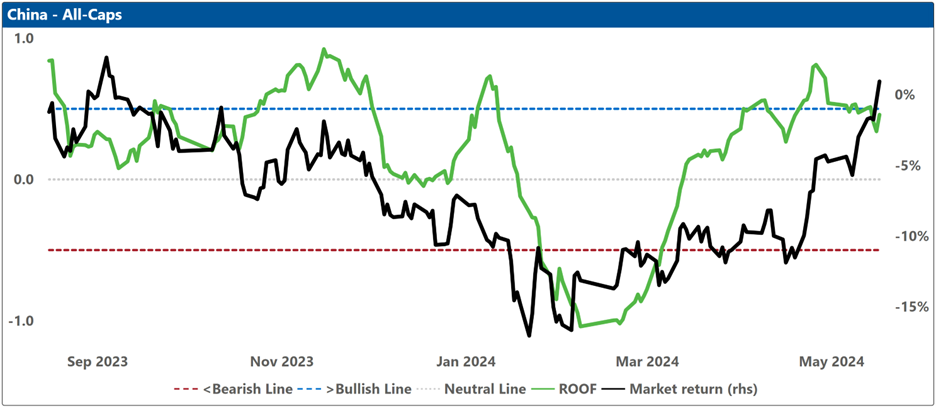
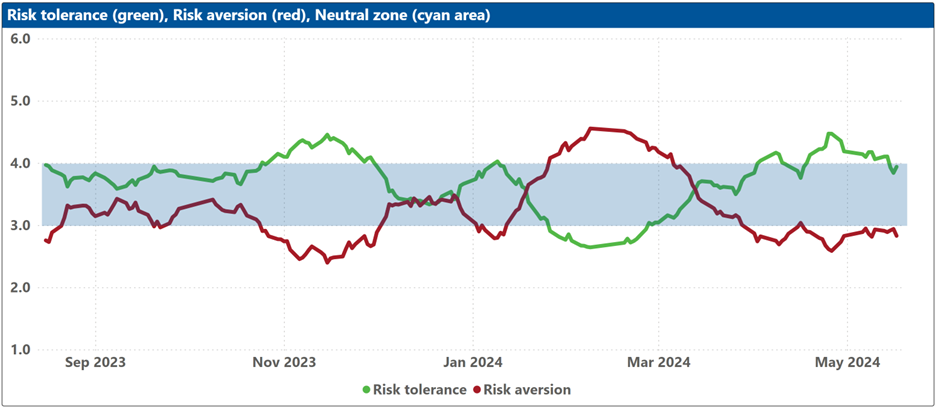
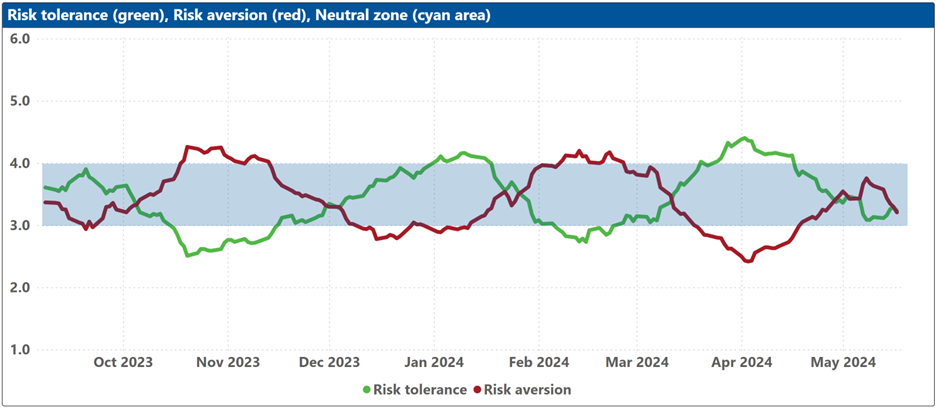
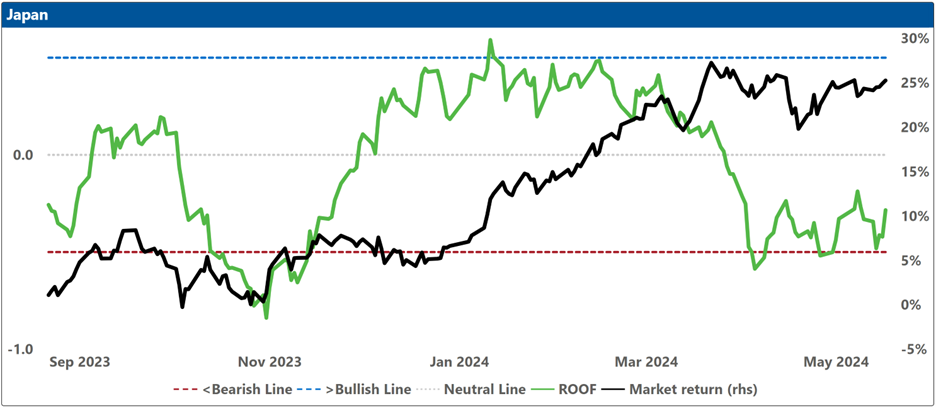
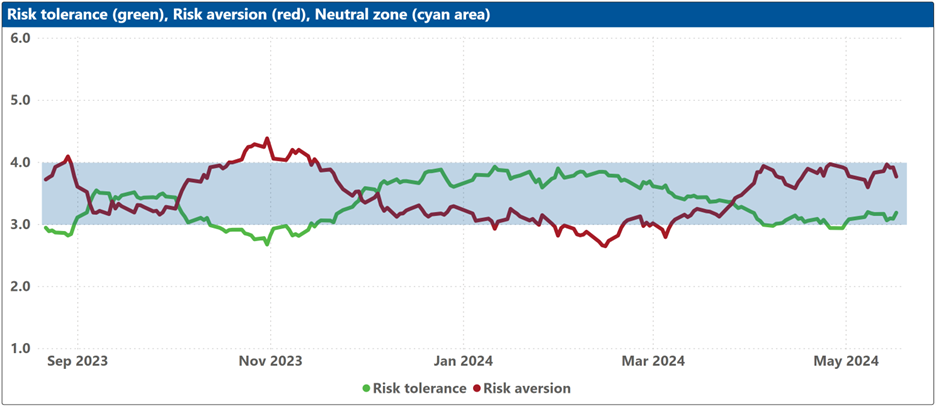
Despite a recent decline in investor sentiment, markets have been experiencing an upward trend. The ROOF Scores, which gauge the risk appetite of investors based on their strategic implementations over the past 20 days, suggest a preference for more risk-averse assets, contributing to the current market-sentiment divergence. The exception is China, where discussions of a substantial government intervention to support the struggling real estate sector have led to both a market and sentiment uplift. However, attention should be paid to major government-linked developers like Vanke, as their fate could significantly impact markets (if Vanke goes the way of Evergrande and Country Garden, it all goes).
Investors have seen their faith in a robust economy, improved earnings, and a halt in interest rate hikes rewarded by markets in 2024. In the coming three months, however, the news cycle will be dominated by sporting events such as the Paris Olympics and the UEFA 2024 in Germany, political milestones including the EU elections and the first US Presidential debate, and ongoing geopolitical tensions between the US and China, as well as two ongoing wars in Ukraine and Gaza. The Federal Reserve is not anticipated to lower interest rates until possibly their meeting on September 18, with a current probability of just 65%. Considering the many uncertainties that surround these events, don’t expect investors’ risk aversion levels to decline without good reasons. Life is never faster than in the stock market, except when you’re sitting on a loss. Then, life is never slower. And summer is coming.
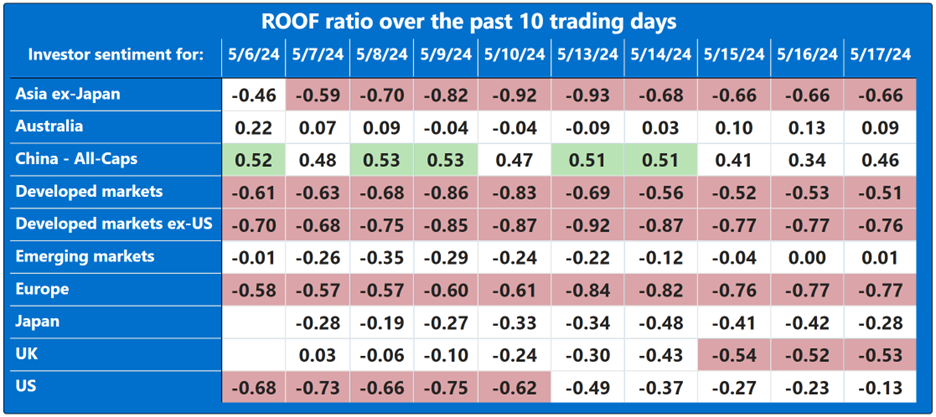
Note: green background = bullish, red background = bearish
Changes to investor sentiment over the past 180 days for the markets we follow:
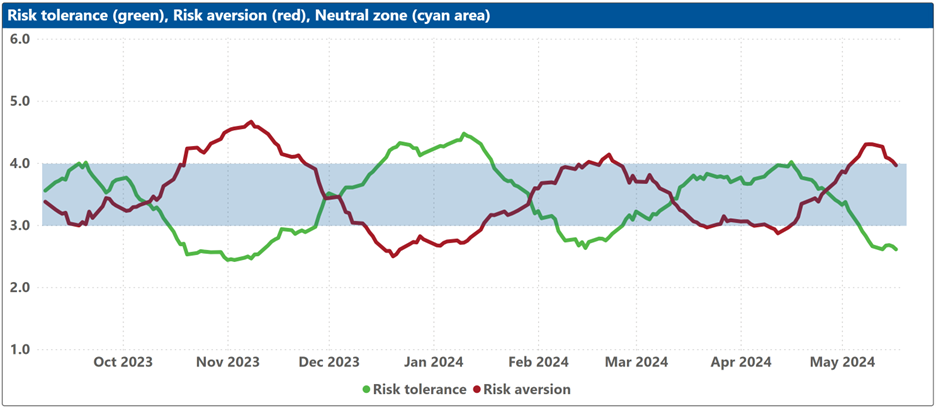
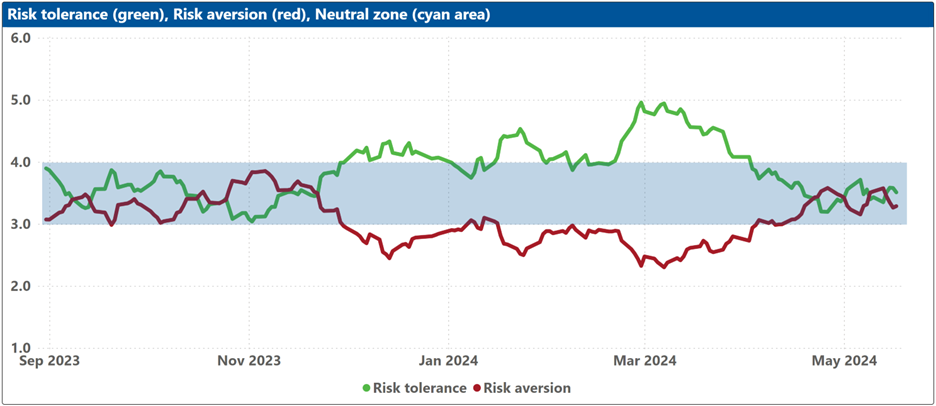
How to read these charts: The top charts show the ROOF ratio (investor sentiment) in green (left axis), against the cumulative returns of the underlying market in black (right axis). The horizontal red line at -0.5 (left axis) represents the frontier between a negative sentiment (-0.2 to -0.5) and a bearish one (<-0.5), and the horizontal blue line at +0.5 (left axis) represents the frontier between a positive sentiment (+0.2 to +0.5) and a bullish one (>+0.5). Around the horizontal grey line at 0.0 (left axis), sentiment can be considered neutral (-0.2 to +0.2).
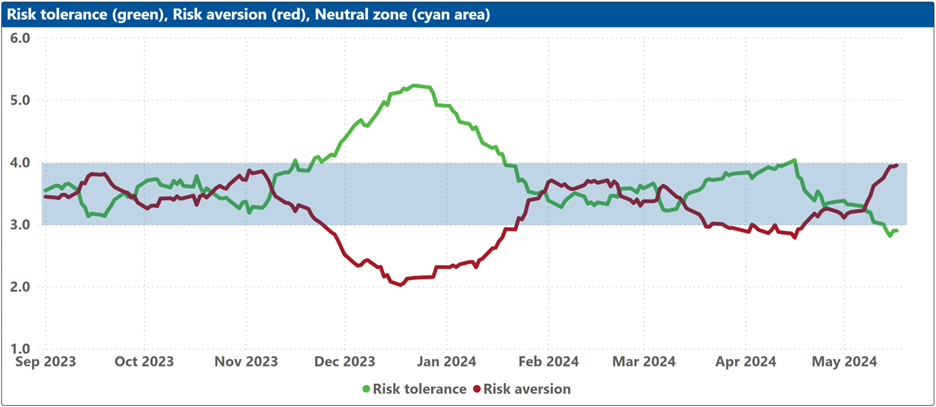
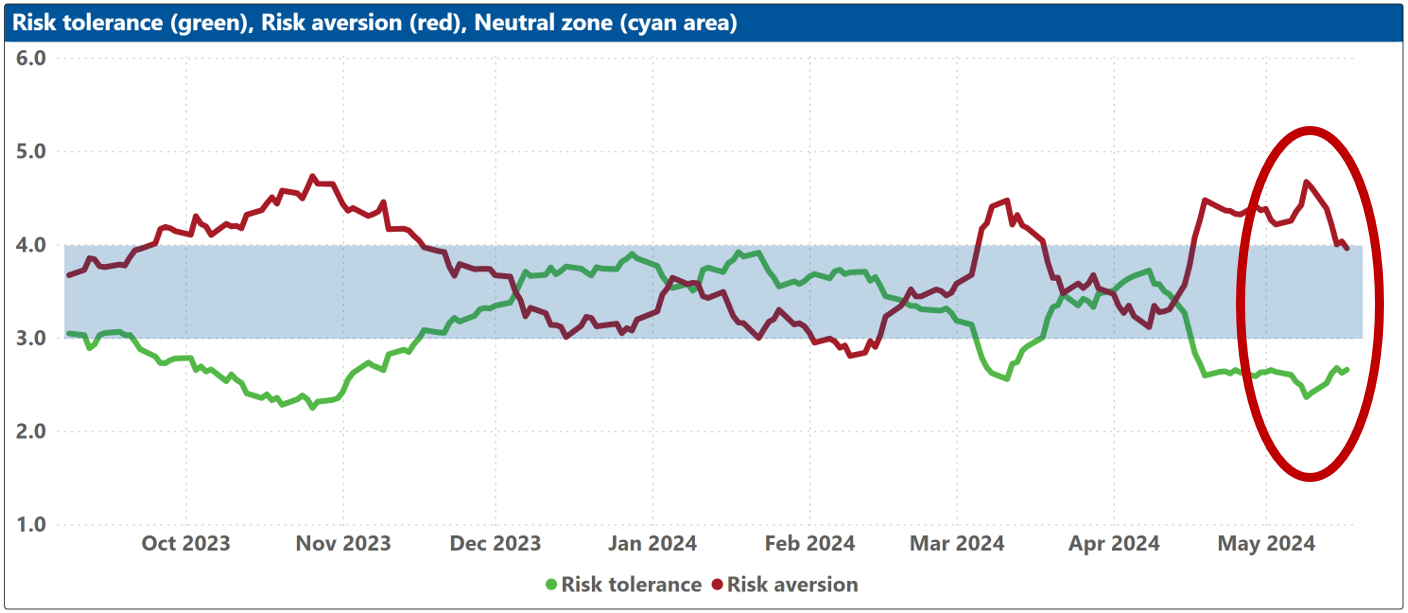
The bottom charts show the levels of both risk tolerance (green line) and risk aversion (red line) in the market. These represent investors’ demand and supply for risk. When risk tolerance (green line) is higher than risk aversion (red line), there are more investors looking to buy risk assets then investors willing to sell them (at the current price), forcing risk-tolerant investors to offer a premium to entice more risk-averse counterparts to take the other side of their trade, which drives markets up. The reverse is true when risk aversion (red line) is higher than risk tolerance (green line). The net balance between risk tolerance and risk aversion levels is used to compute the ROOF ratio in the top charts, representing the sentiment of the average investor in the market.
The blue shaded zone between levels 3-4 for both indicators represents a reasonable balance between the supply and demand for risk in the market. Conversely, when both lines are outside of this blue zone, the large imbalance in the demand and supply for risk can lead to an overreaction to unexpected news or risk events.
