
AXIOMA ROOF™ SCORE HIGHLIGHTS
WEEK OF MAY 27, 2024
- US: PCE Price Index, personal income and spending data, speeches by several Fed officials, consumer confidence index, and the second estimate of Q1 GDP growth.
- Europe: Inflation and unemployment rates for the Eurozone.
- APAC: Manufacturing and Services PMI data for China. In Japan, BoJ Governor speech, consumer confidence, the Tokyo CPI, retail sales, unemployment rate, and industrial production data.
- Global: Inflation will be top of mind this week, but investors will also keep an eye on the volatile situations in Ukraine and Gaza for signs of further escalation.
Insights from last week's changes in investor sentiment:
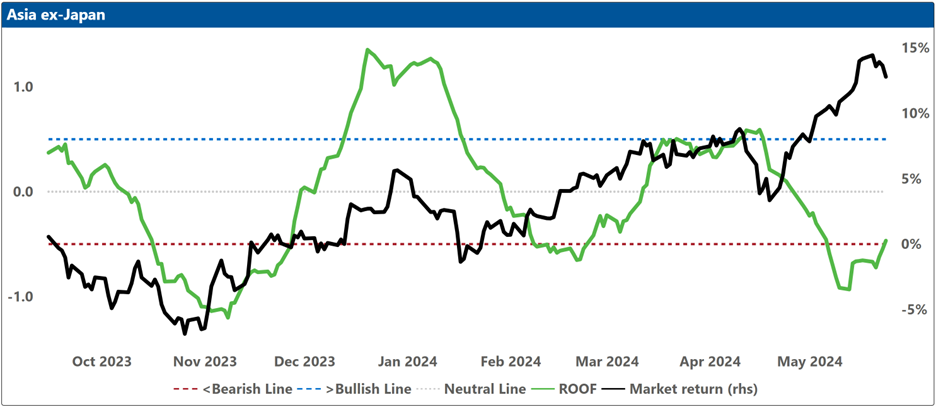
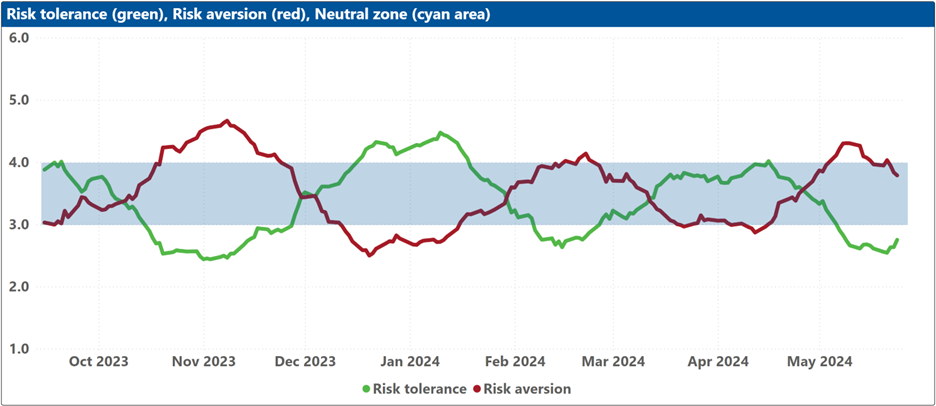
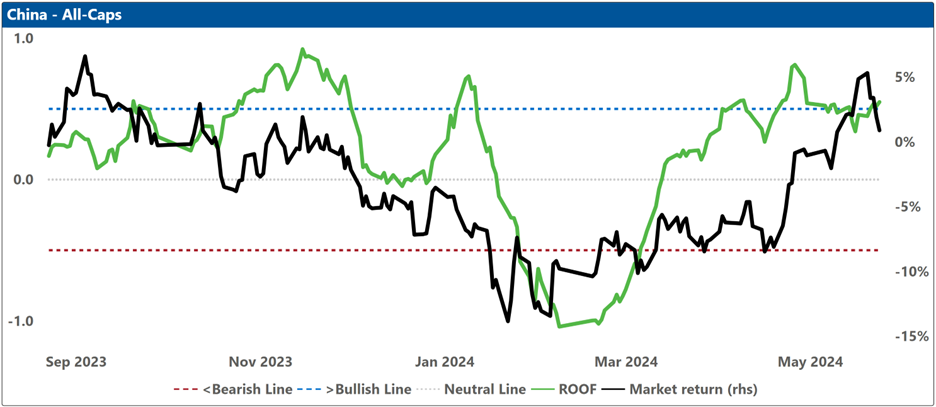
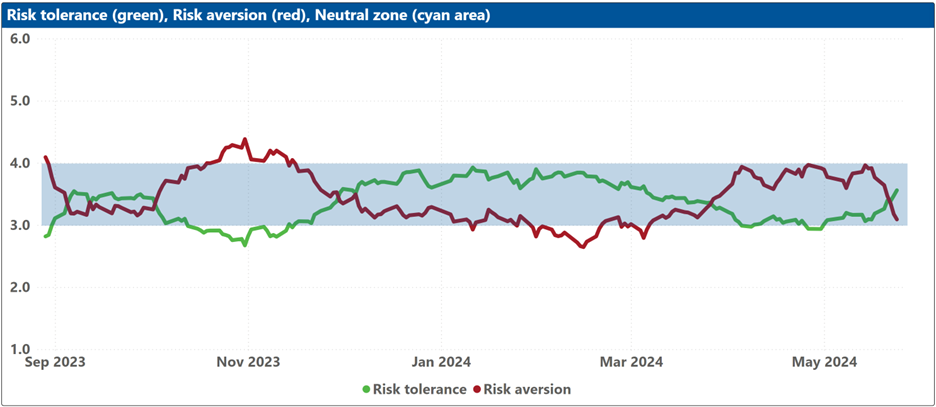
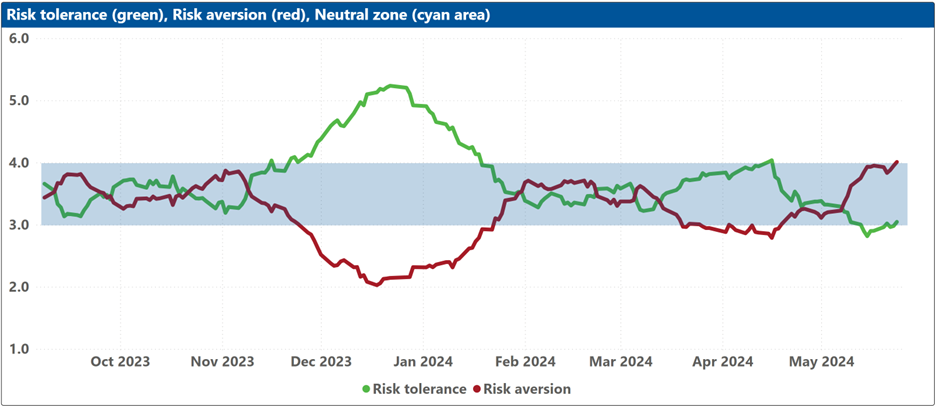
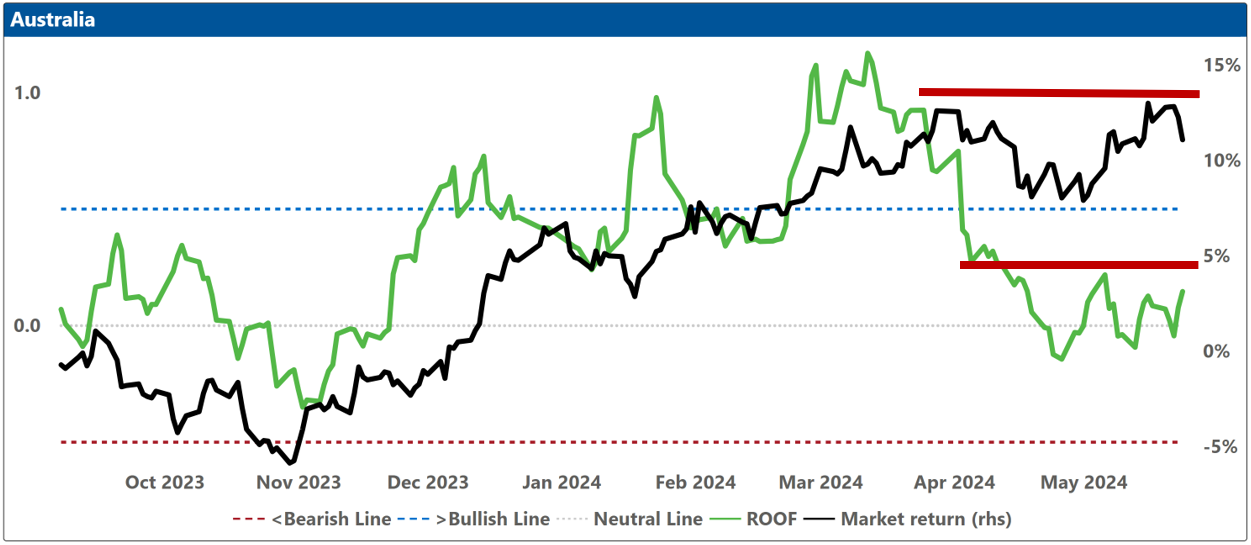
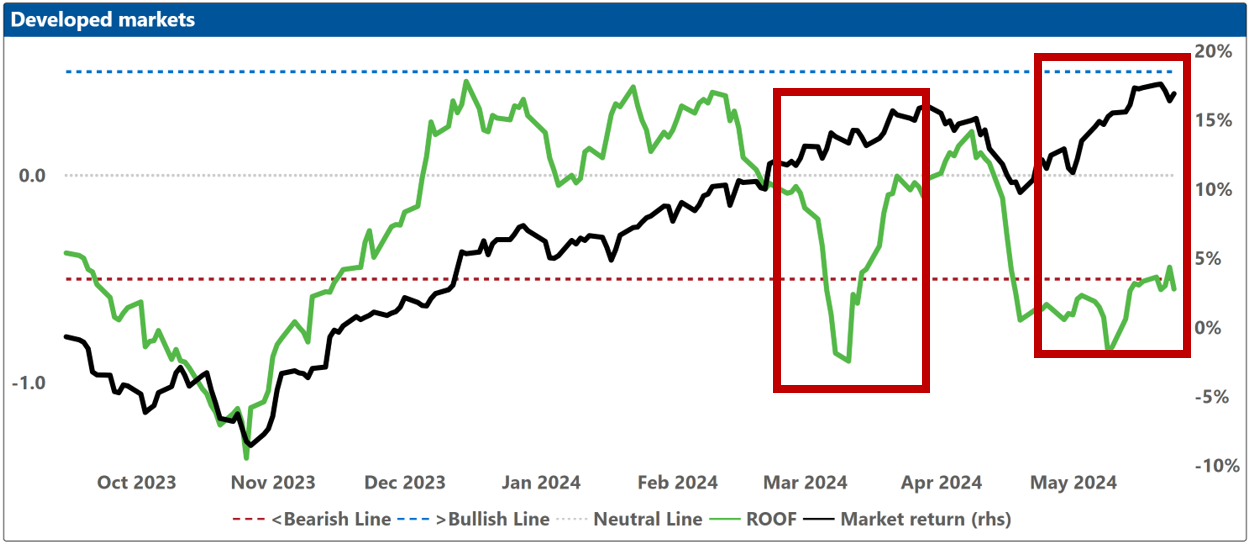
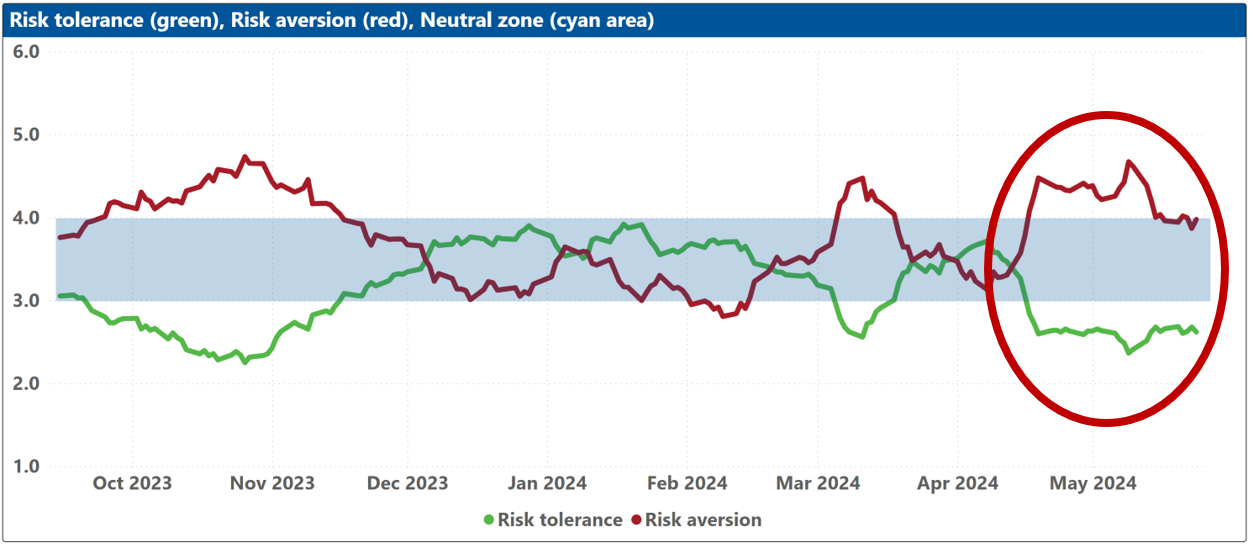
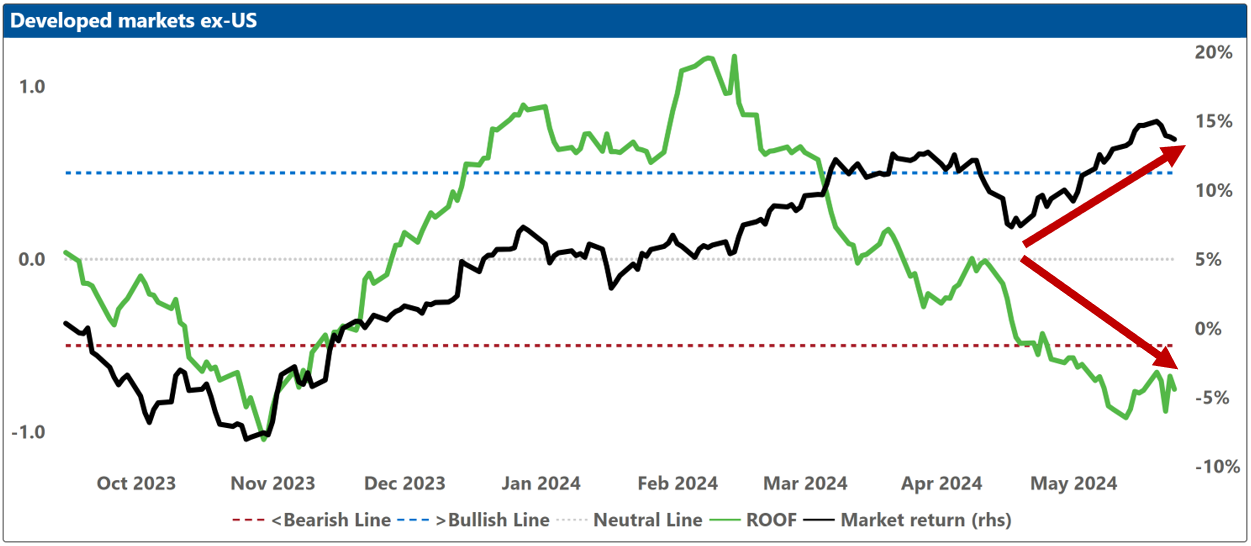
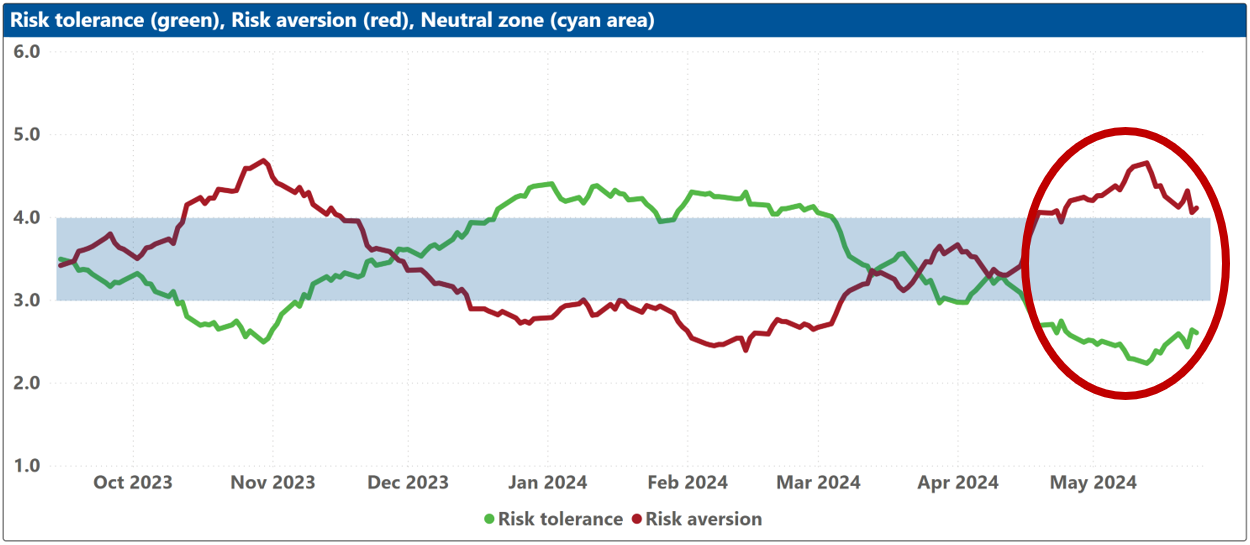
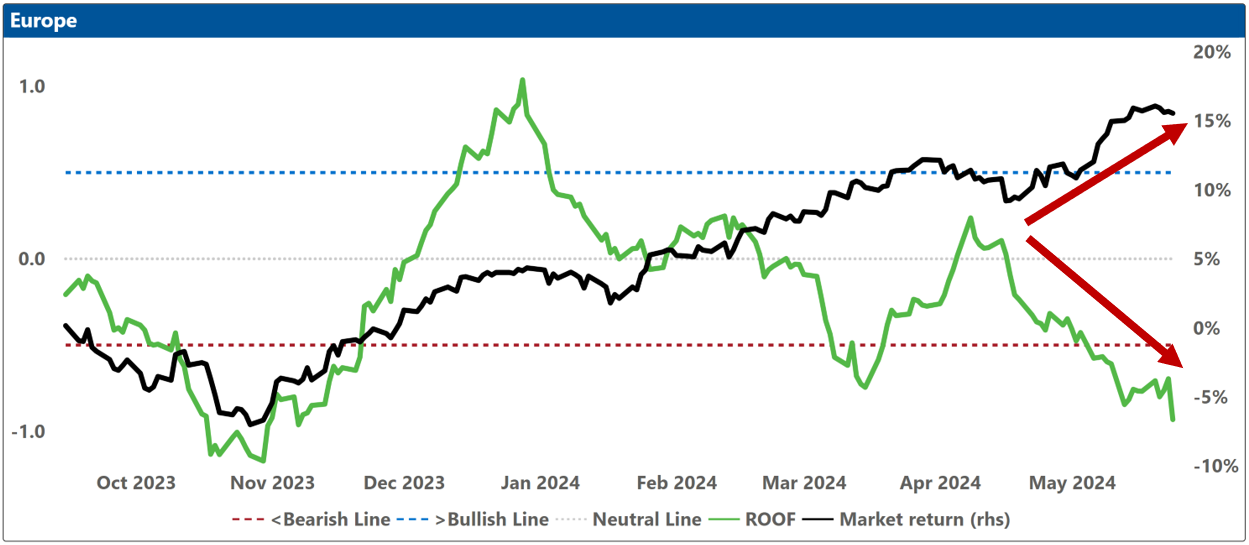
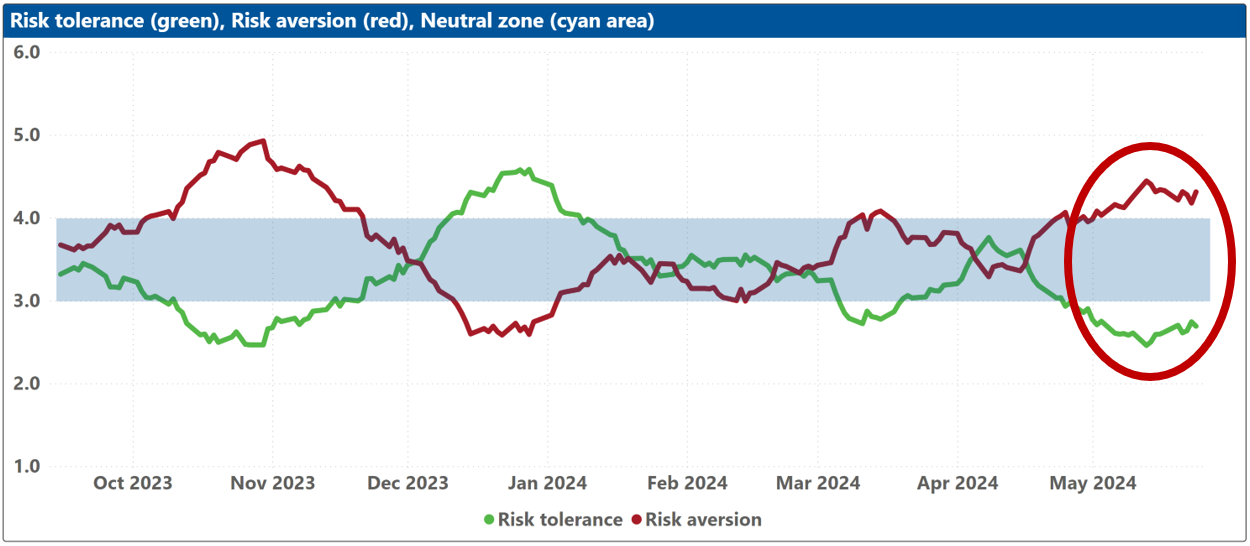
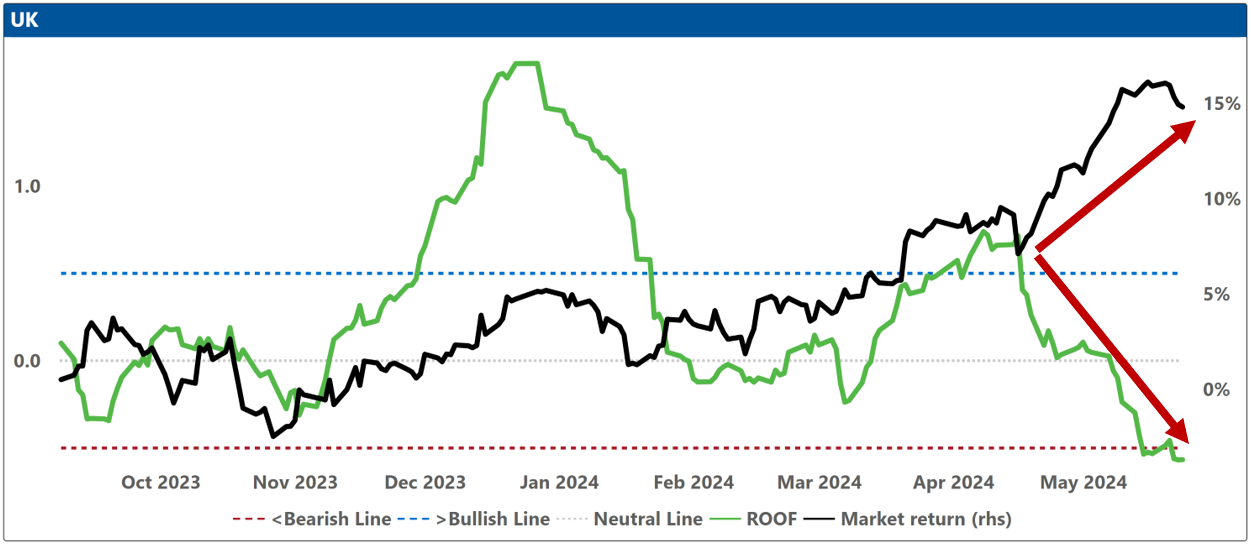
Investor sentiment was mixed last week, improving in Asia ex-Japan, China, Japan, and the US, declining in Europe and the UK, and remaining unchanged in Australia, Global Developed Markets, Global Developed ex-US markets, and Global Emerging Markets. We note that investors in Global Developed ex-US markets, Europe, and the UK remain in denial with markets rising while sentiment declines further. All three have a very negative supply-and-demand balance for risk with high levels of risk aversion and low levels of risk tolerance which increases the probability of a downside risk overreaction in the event of an unforeseen rise in volatility.
Minutes of the last FOMC meeting showed that the Fed wasn’t ready to cut interest rates just yet; expressing this thought was the most consequence-free (no change was expected) consequential (the Dow lost 200 points) action they could have taken. Expectations for rate cuts have been reduced to one now (from six at the start of the year) and its timing to the November meeting (from March at the start of the year) at the earliest. Until then, investors find themselves in a bubble of time that is neither large enough to reverse course nor small enough to ignore (and certainly not uneventful!).
NVIDIA’s earnings made it clear that the AI boom is still, well, booming. Investors can’t seem to get enough of AI’s ‘too muchness’, perhaps forgetting that the only thing markets like more than blowing bubbles, is bursting them. As we head into the summer months, fondly thought of by most investors as one long gentle after-dinner nap interrupted only by one or two unseemly burps, the low-risk-high-returns environment we find ourselves in since mid-November 2023, indicates that leverage has become common but is not yet common knowledge.
European markets seem particularly at risk as we head into a summer filled with large sporting and political events (Paris Olympics, EUFA 2024, EU Parliamentary Elections, UK General elections, two US Presidential debates). Add to these events no less than six central bank (Fed, ECB, and BoE) interest rate setting meetings between June 6th and August 1st, and it becomes even harder to understand why these markets keep rising in defiance of a bearish sentiment and a target-rich environment for a summer volatility spike. So, the question is not whether leveraging low returns from low volatility was a wise decision, but whether investors have pushed this strategy beyond its factory settings?
On the political side, polarization is clearly apparent with expectations for a protest vote across the board. Polls indicate the Far Right will gain seats in the June 6th EU Parliament Election, Labour is expected to win the July 4th UK general election removing the Conservatives after 15 years of (chaotic) rule, and Donald Trump still leads Joe Biden in the US presidential race. The first of two US Presidential debates between the two (presumptive) candidates will be held on June 27th as well as both Pary conventions over the summer, all to help voters decide if they want freedom to, or freedom from.
And then there is geopolitics with the resurgence of hostilities in both Ukraine and Gaza, as well as increased (trade) tensions between the US and China. The latter is also holding threatening military exercises around Taiwan.
In summary, the economy, corporate earnings, inflation, are all positives for markets. Even interest rates should start to come down before the end of the year. So why are investors so gloomy? On the negative side are political events (large protest votes expected), geopolitical events (Ukraine, Gaza, US-China relations), and security concerns surrounding the prolonged and large sporting events all taking part in Europe this summer (Paris Olympics and EUFA 2024 in Germany). Add to this a projected heat wave and you get high uncertainty translating into a large powder keg with a very short fuse.
Yes, the economic and monetary boats are turning around, slowly, but it does not look like there will be a prize for being first. Instead, there could be a lot of downside overreaction risk over the next three months due to high uncertainty, lower volumes, and bearish sentiment. A prudent investor would hedge this summer, reassess in the fall.
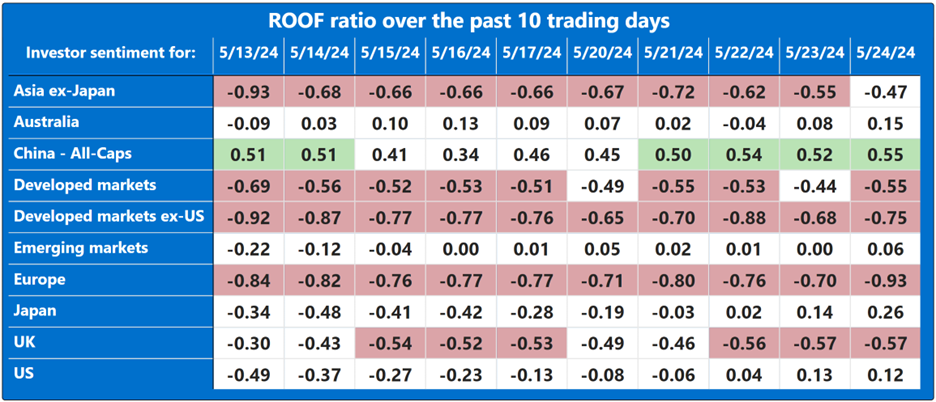
Note: green background = bullish, red background = bearish
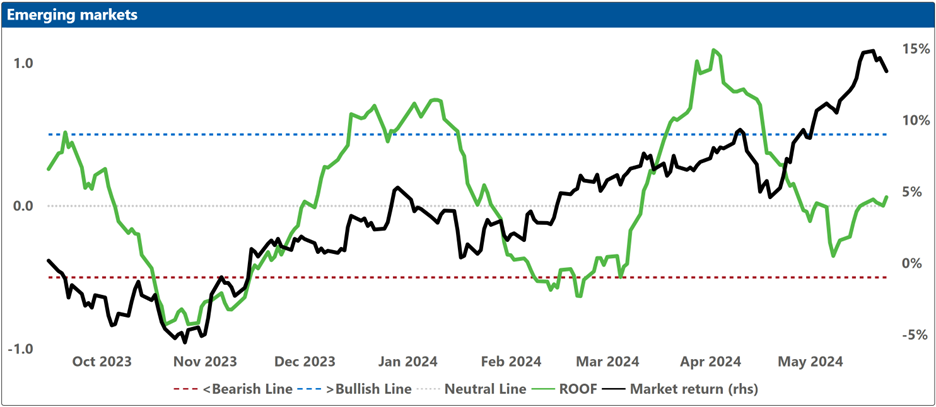
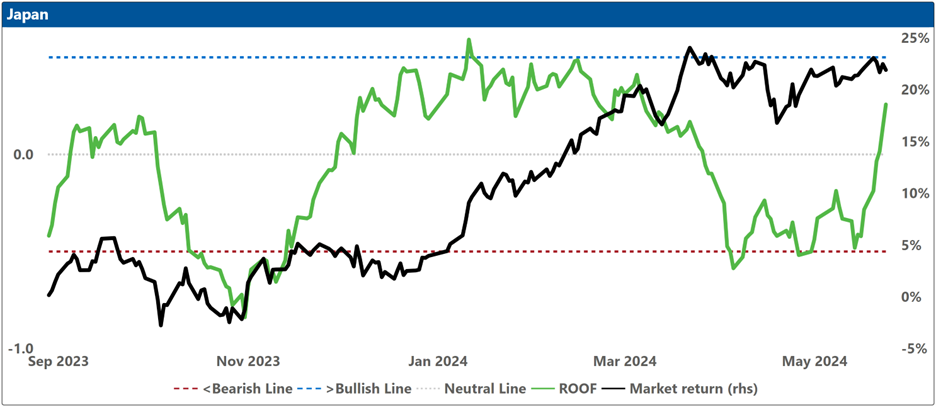
Changes to investor sentiment over the past 180 days for the markets we follow:
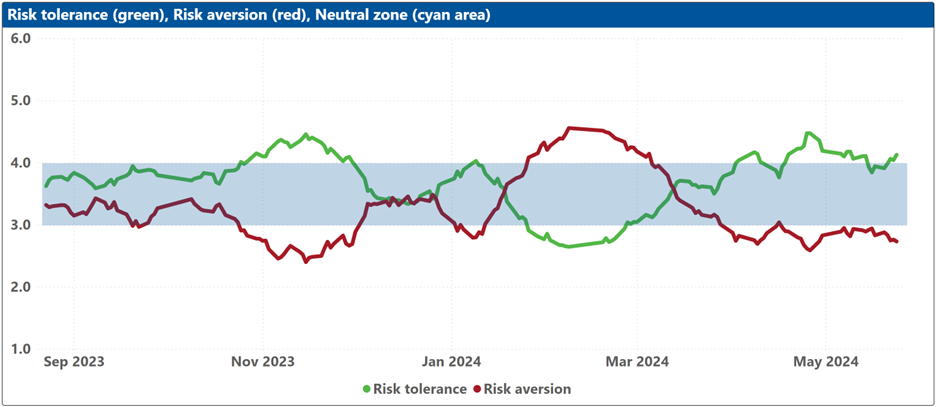
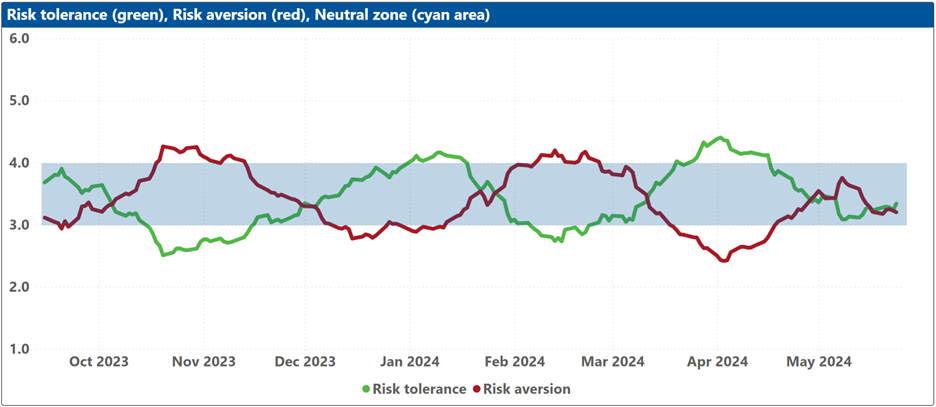
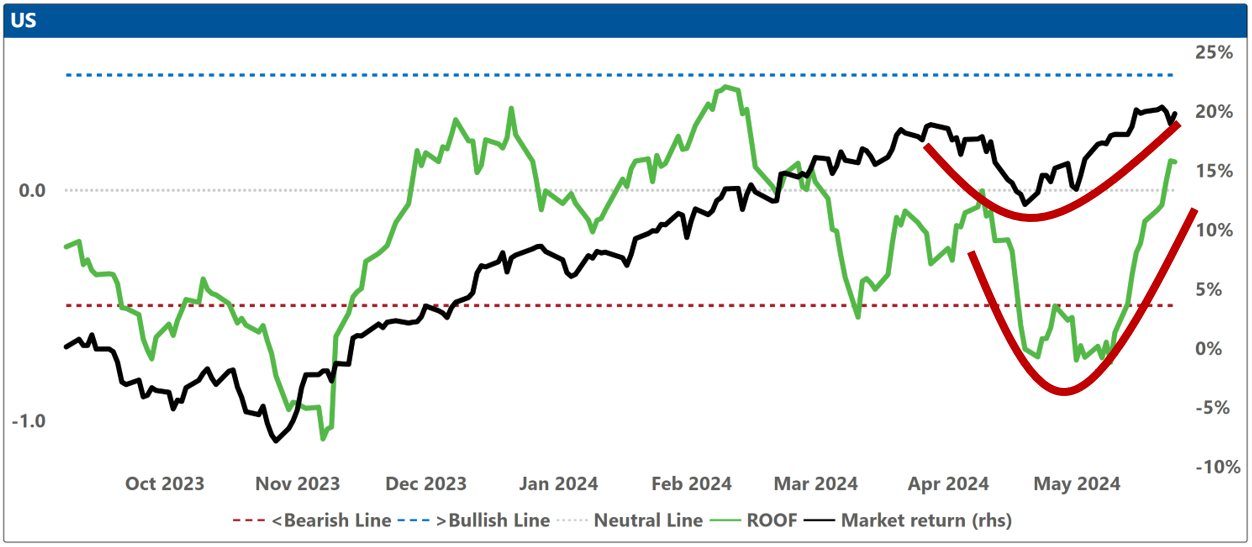
How to read these charts: The top charts show the ROOF ratio (investor sentiment) in green (left axis), against the cumulative returns of the underlying market in black (right axis). The horizontal red line at -0.5 (left axis) represents the frontier between a negative sentiment (-0.2 to -0.5) and a bearish one (<-0.5), and the horizontal blue line at +0.5 (left axis) represents the frontier between a positive sentiment (+0.2 to +0.5) and a bullish one (>+0.5). Around the horizontal grey line at 0.0 (left axis), sentiment can be considered neutral (-0.2 to +0.2).
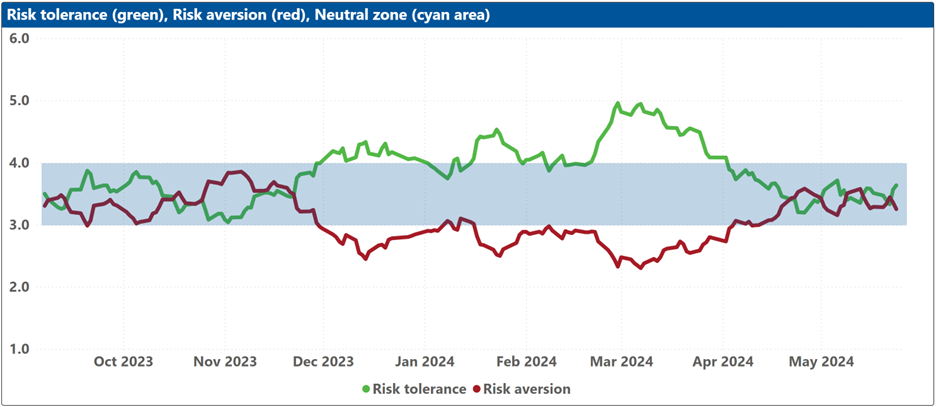
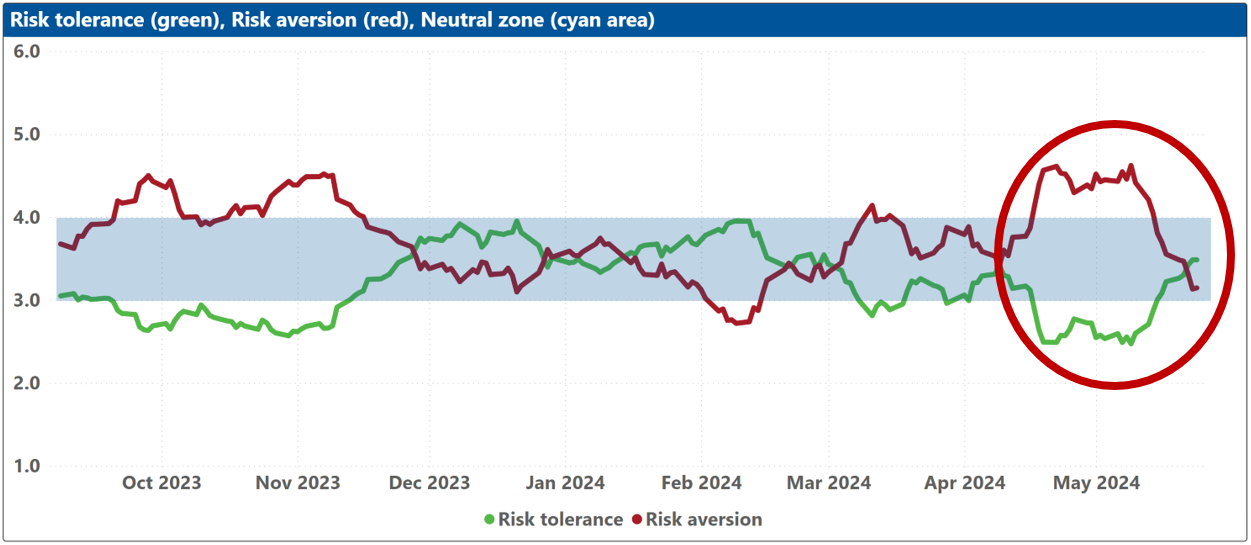
The bottom charts show the levels of both risk tolerance (green line) and risk aversion (red line) in the market. These represent investors’ demand and supply for risk. When risk tolerance (green line) is higher than risk aversion (red line), there are more investors looking to buy risk assets then investors willing to sell them (at the current price), forcing risk-tolerant investors to offer a premium to entice more risk-averse counterparts to take the other side of their trade, which drives markets up. The reverse is true when risk aversion (red line) is higher than risk tolerance (green line). The net balance between risk tolerance and risk aversion levels is used to compute the ROOF ratio in the top charts, representing the sentiment of the average investor in the market.
The blue shaded zone between levels 3-4 for both indicators represents a reasonable balance between the supply and demand for risk in the market. Conversely, when both lines are outside of this blue zone, the large imbalance in the demand and supply for risk can lead to an overreaction to unexpected news or risk events.
