
AXIOMA ROOF™ SCORE HIGHLIGHTS
WEEK OF JUNE 3, 2024
Potential triggers for sentiment-driven market moves this week
- US: Job Openings, manufacturing and services PMIs, factory orders data, and the jobs report.
- Europe: ECB interest rate decision and speech by ECB President Lagarde. Eurozone retail sales data.
- APAC: May manufacturing and services PMIs, and trade data for China.
- Global: Monetary policy remains top of mind for investors, and this week’s ECB rate setting meeting will be keenly watched.
Insights from last week's changes in investor sentiment:
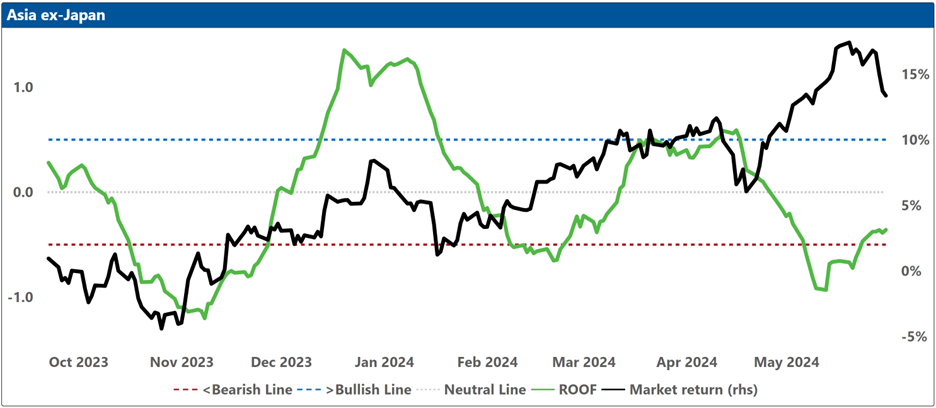
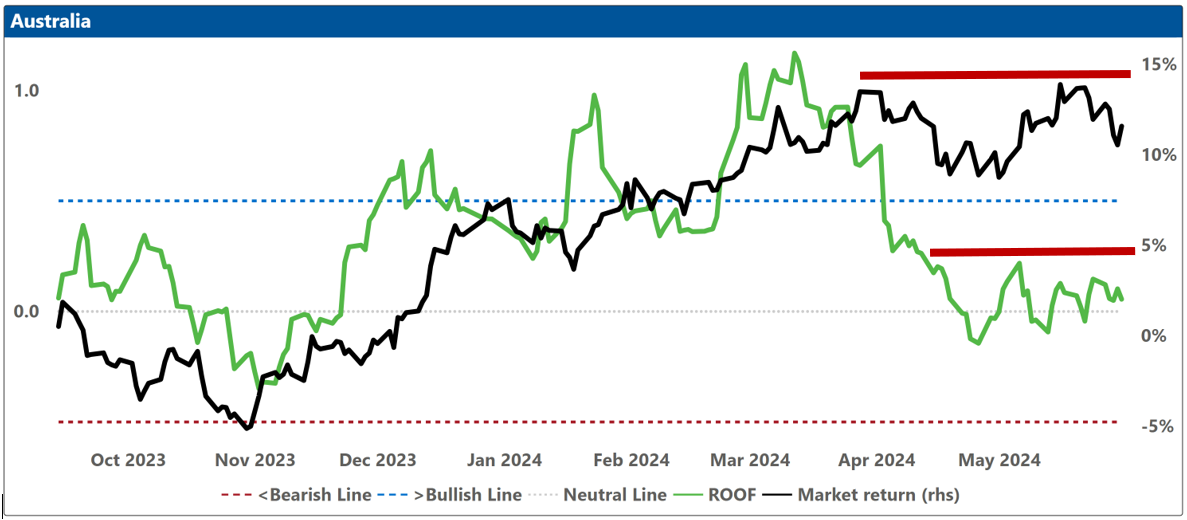
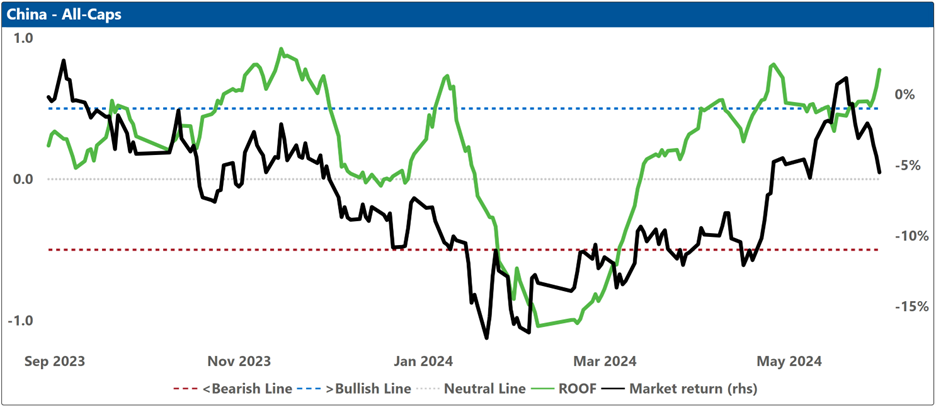
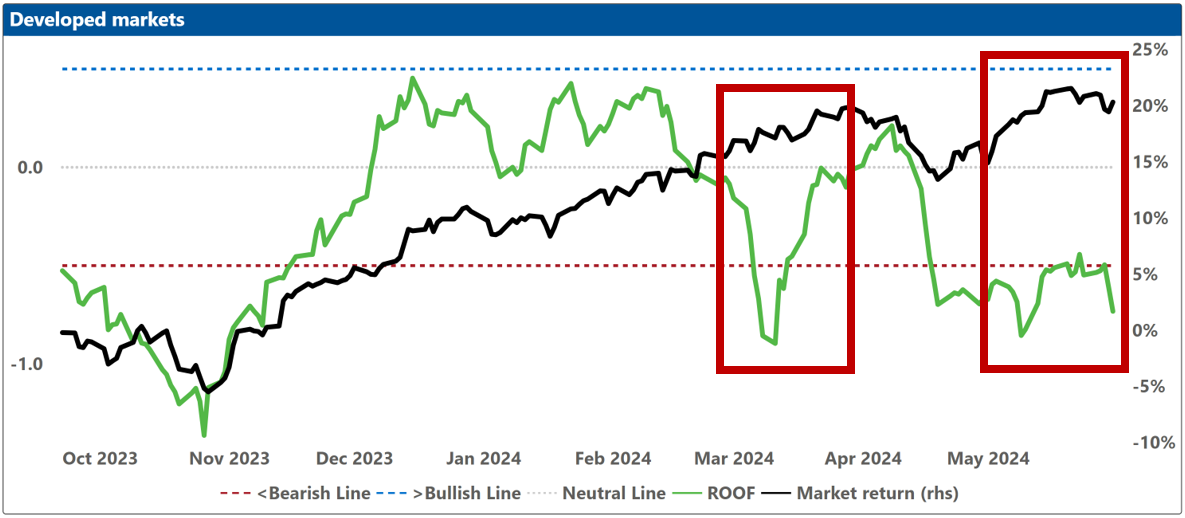
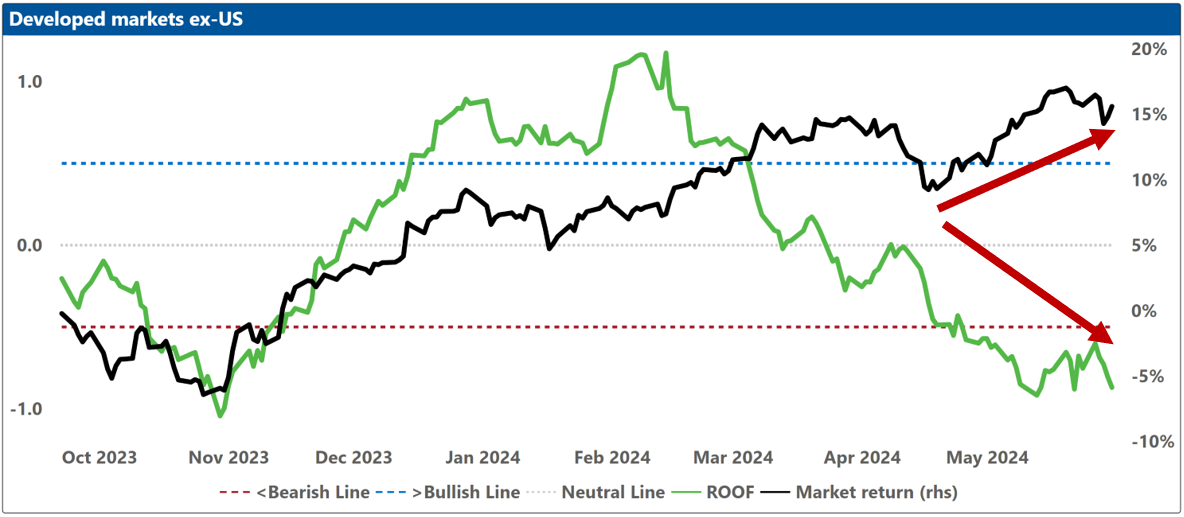
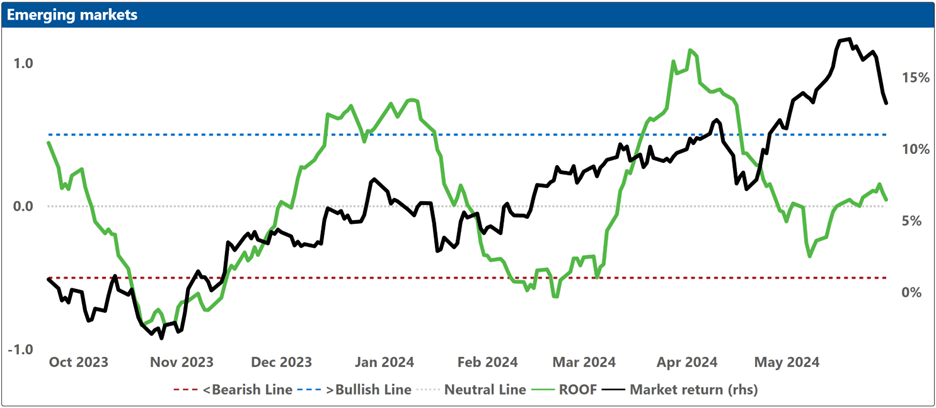
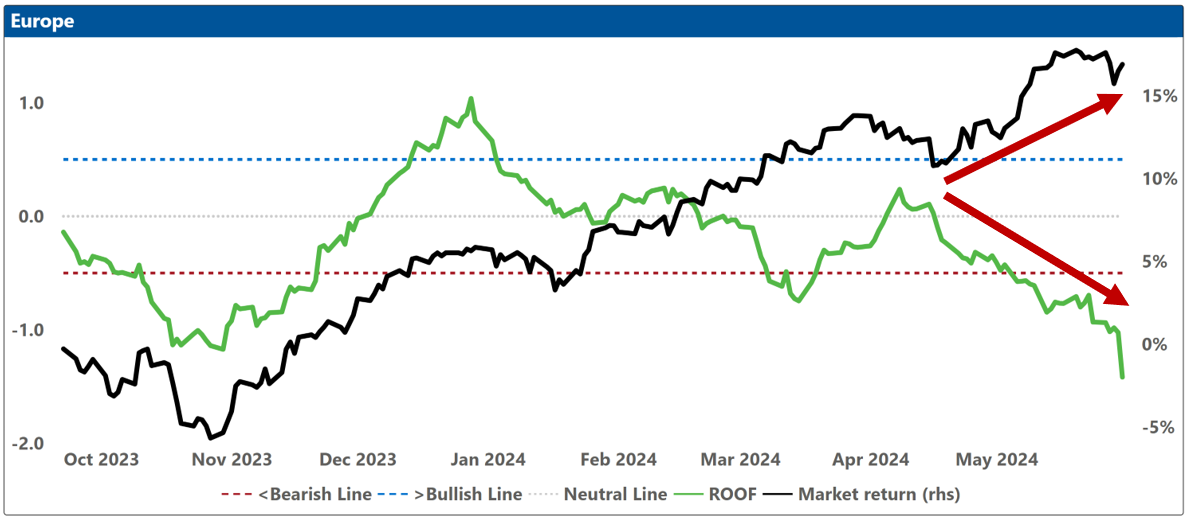
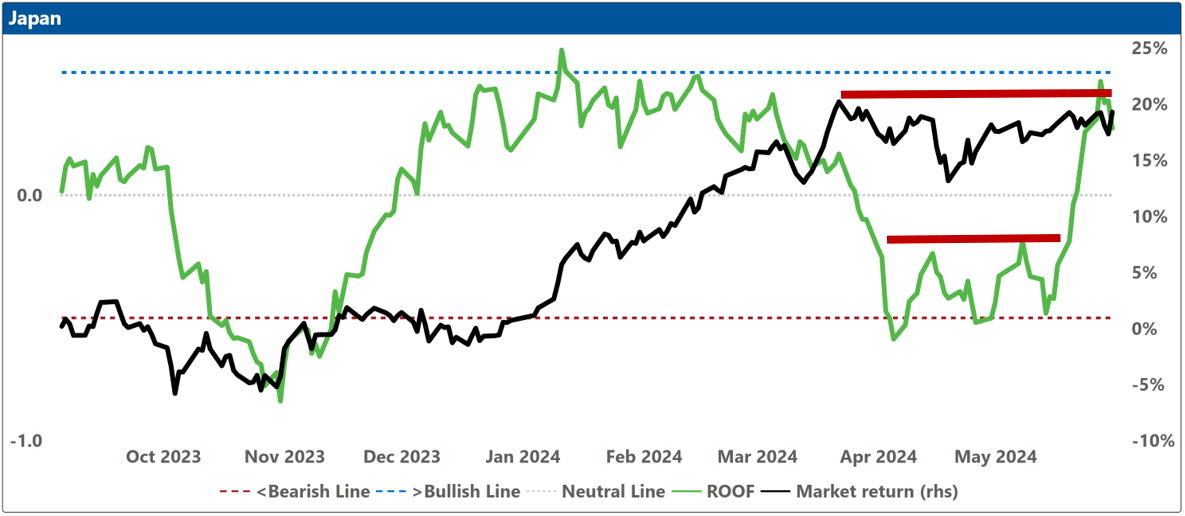
Investor sentiment was mostly unchanged last week and remained divergent across regions with European investors feeling the most bearish and bringing down the mood of Global Developed Markets and Global Developed ex-US markets investors with them. Chinese investors remained bullish, awaiting more details of a property market rescue plan. Elsewhere, sentiment remained negative in Asia ex-Japan, neutral in Australia, Global Emerging Markets and the US, and positive in Japan.
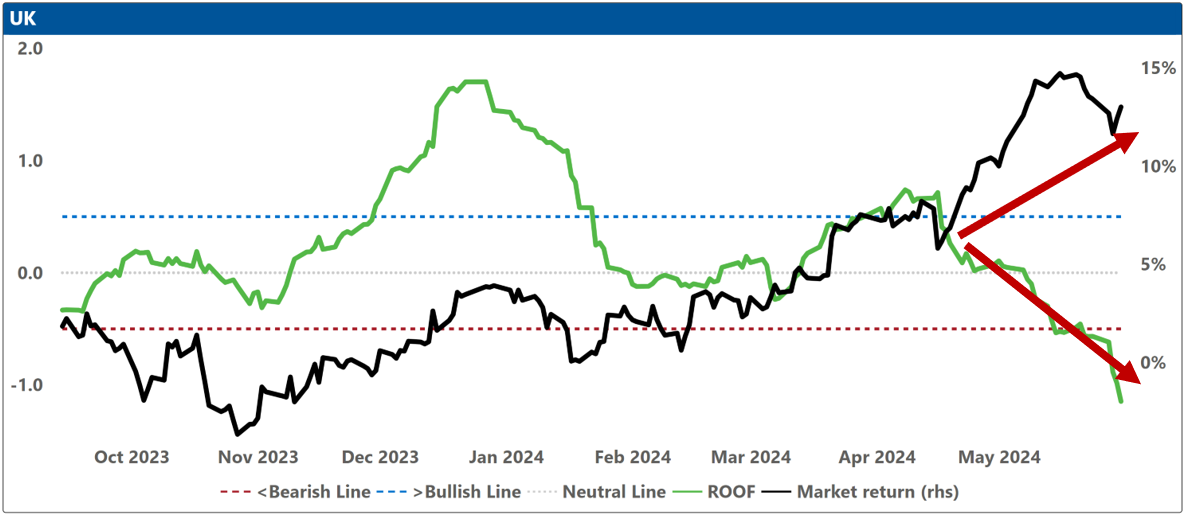
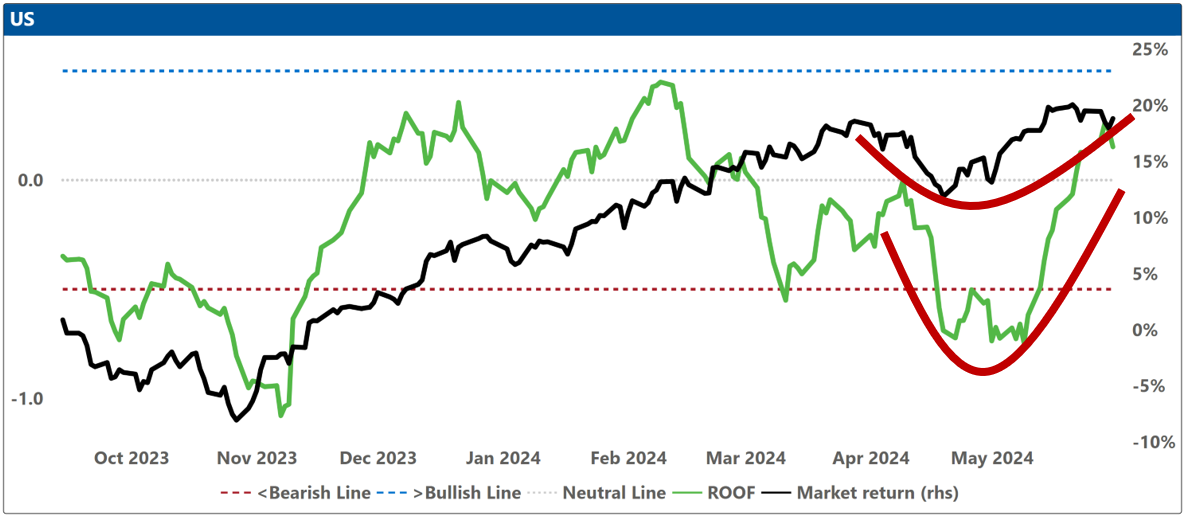
There is a permeable boundary between market performance and investor sentiment. We know there is a connection, we know there is a difference, but there is no stone wall. Presently, a harmony can be observed between certain markets and the dominant investor sentiment within them, including Australia, China, Global Emerging Markets, Japan, and the United States. Conversely, a discord is noted in other markets such as Asia ex-Japan, Global Developed Markets, Global Developed ex-US markets, (and especially in) Europe, and the United Kingdom.
Based on our observations, discord is not sustainable; eventually, convergence is inevitable. Should an incident trigger sentiment into tangible action, market adjustments tend to occur rapidly. Conversely, in the absence of a negative trigger to activate the foreboding sentiment, investors' confidence typically recovers as prospects suddenly appear more promising (or simply not as bad as previously thought).
Last week’s guilty verdict of Donald Trump, has added one more date (July 11 – sentencing) to our already target-rich calendar of potential triggers for a bearish sentiment over the summer. Starting with this week’s (June 6th) ECB interest rate setting meeting, the June-August time frame now includes 13 potential risk events (Monetary decisions (X6), International Sporting events (X2), Political events (X5), not counting the possibility of worsening geopolitics (Ukraine, Gaza, and US-China), or the potential for more extreme weather events.
The five political events include two elections in Europe (EU parliament on June 9 and UK general election on July 4), two national party conventions in the US, and the first of two Presidential debates (June 27), sure to highlight the difference between the ‘Same Old – Same Old’ policies of the Biden administration, and the ‘Year Zero’ approach to government of the Trump White House.
The most impactful triggers on the list, however, are the six interest rate setting meetings by the central banks of the US, EU, and UK (two each between June 6th and August 1st). If any of those decisions turn into a “you think she wants to make up, but she says she wants to break up” moment for investors, it will trigger a downside overreaction in those markets where sentiment was already expecting the worst but still holding on to hopes for the best.
Sometimes, despite being in the minority, markets are driven by the few investors most willing to speculate. Their success appeals to the greedy little Scrooge in the rest of us, that starts whispering in our ear that we too should want more, and more, and more, and, just to top it off, more. But the alternative to “more” after successive historical highs (US, Europe, UK) is not “less”, but “enough”, as in that old folk saying, “sometimes enough is as good as a feast”.
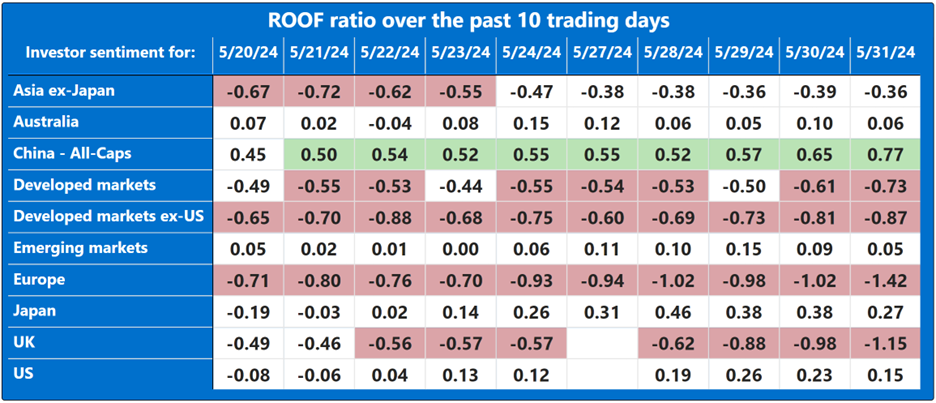
Note: green background = bullish, red background = bearish
Changes to investor sentiment over the past 180 days for the markets we follow:
How to read these charts: The top charts show the ROOF ratio (investor sentiment) in green (left axis), against the cumulative returns of the underlying market in black (right axis). The horizontal red line at -0.5 (left axis) represents the frontier between a negative sentiment (-0.2 to -0.5) and a bearish one (<-0.5), and the horizontal blue line at +0.5 (left axis) represents the frontier between a positive sentiment (+0.2 to +0.5) and a bullish one (>+0.5). Around the horizontal grey line at 0.0 (left axis), sentiment can be considered neutral (-0.2 to +0.2).
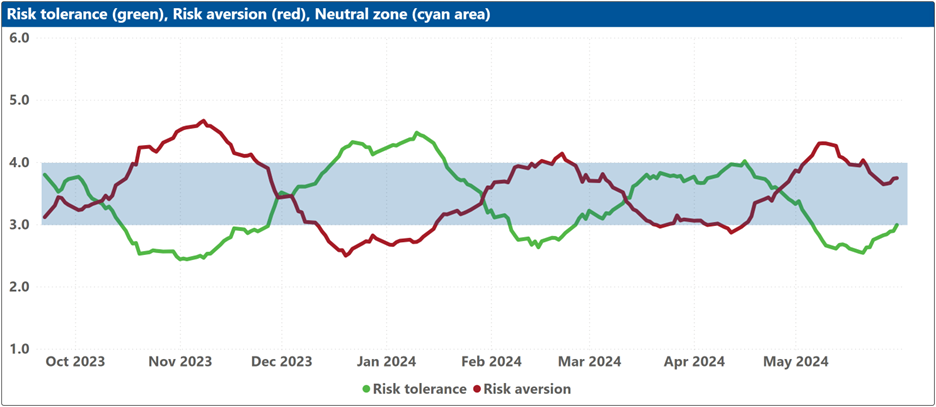
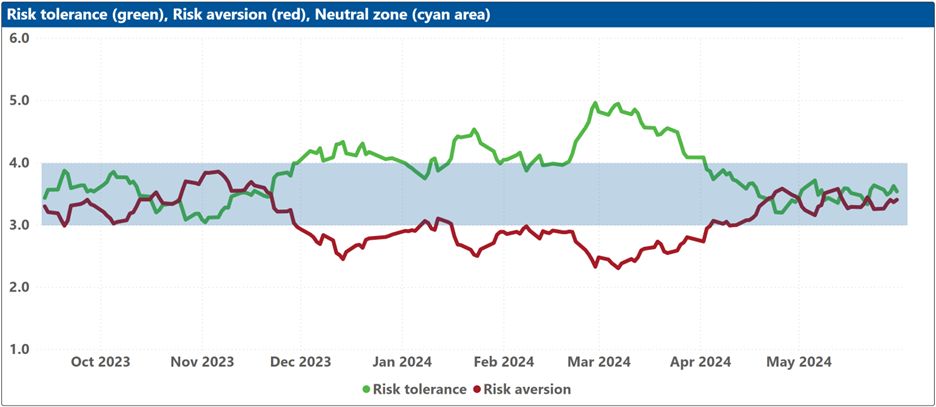
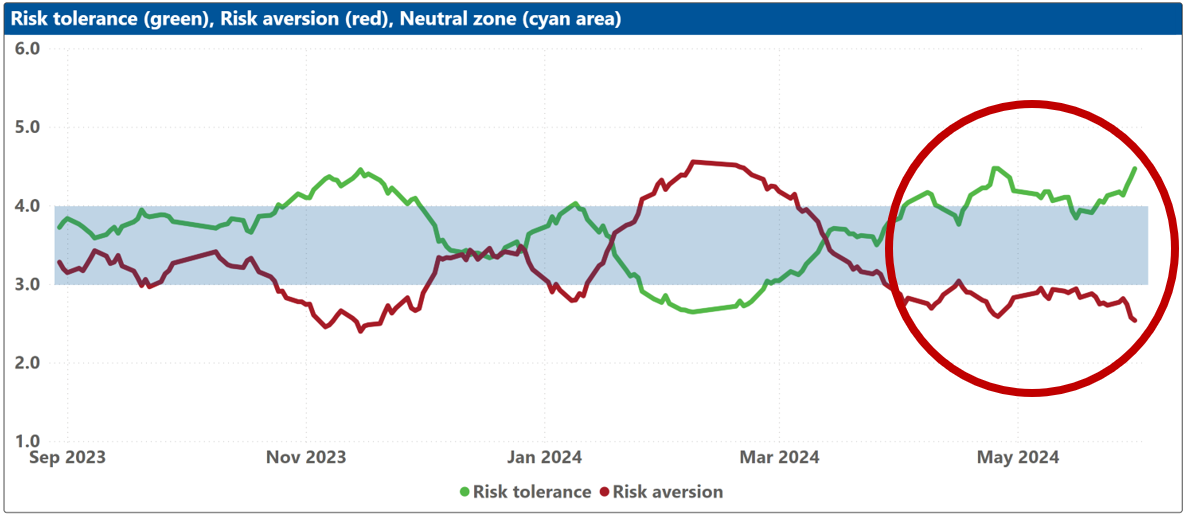
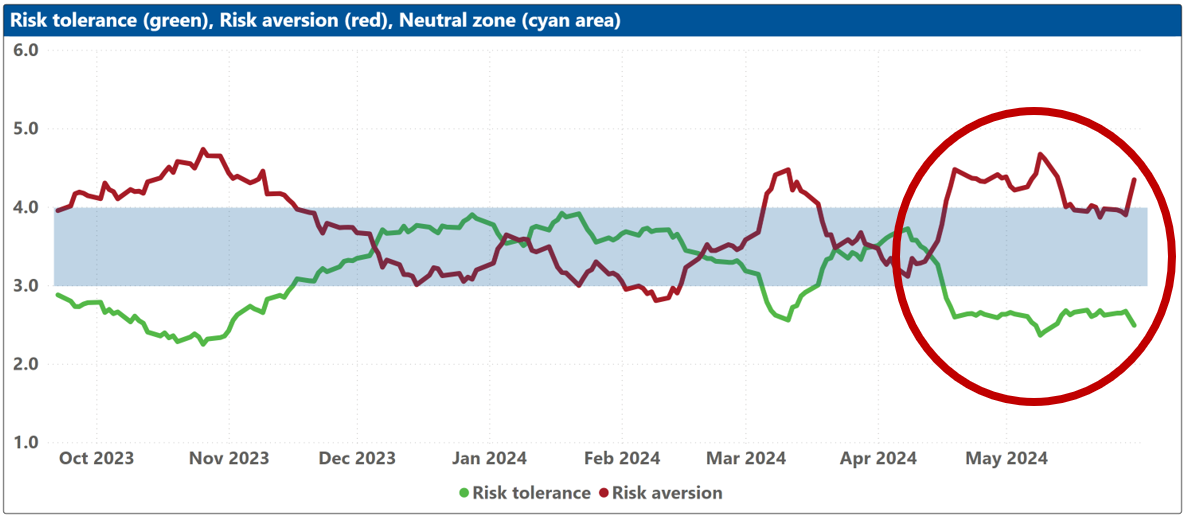
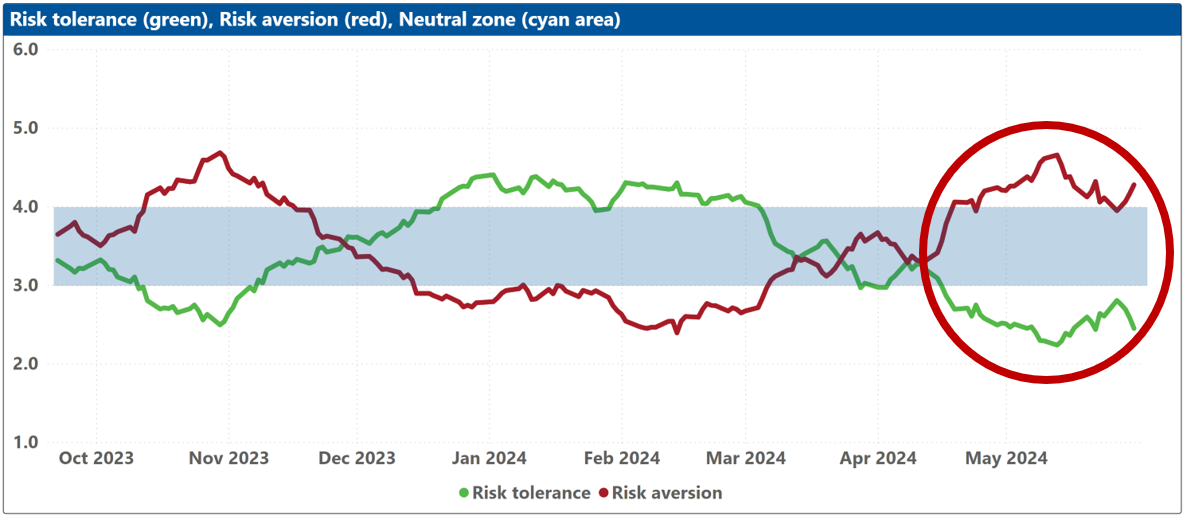
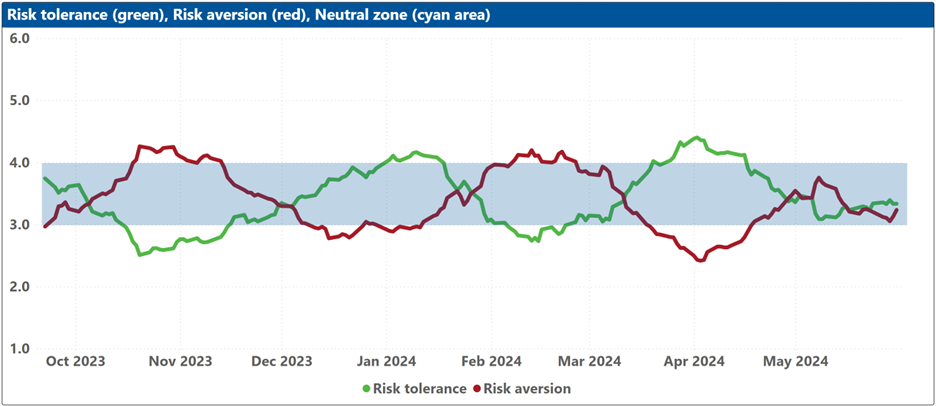
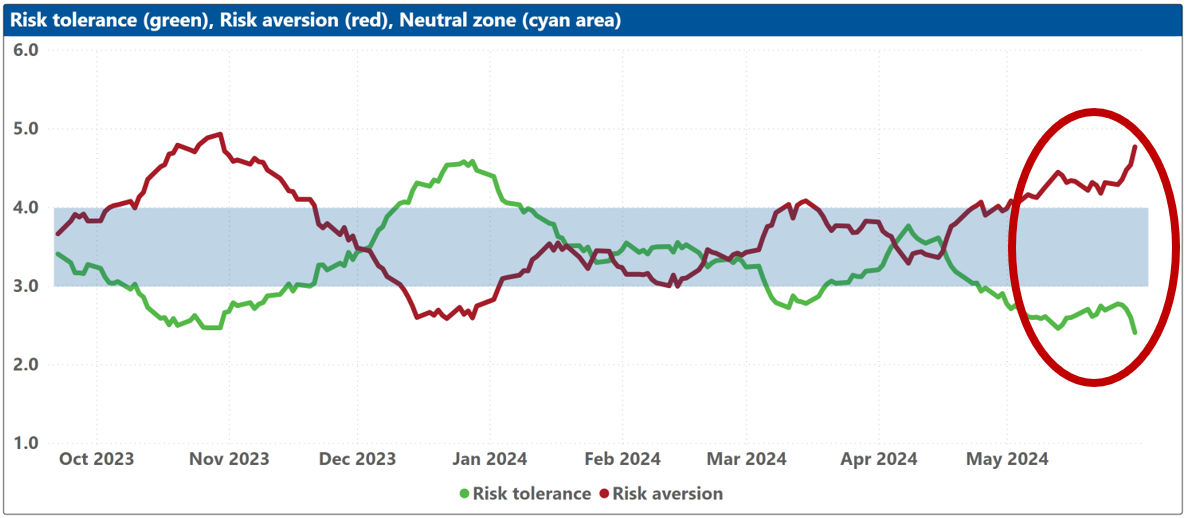
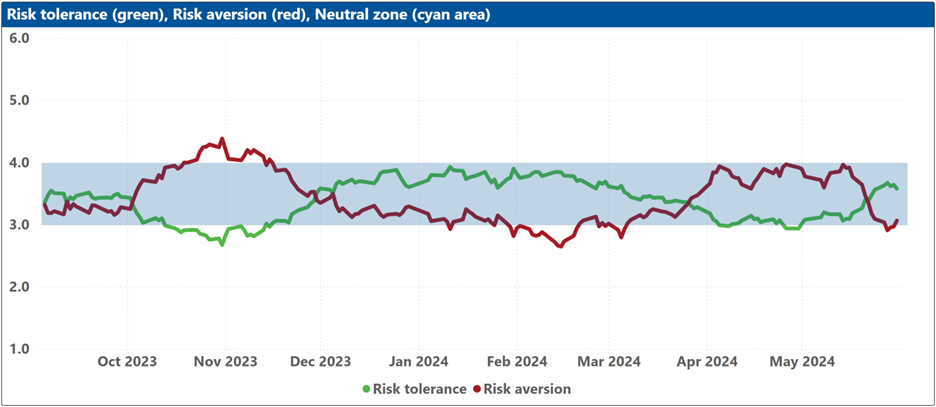
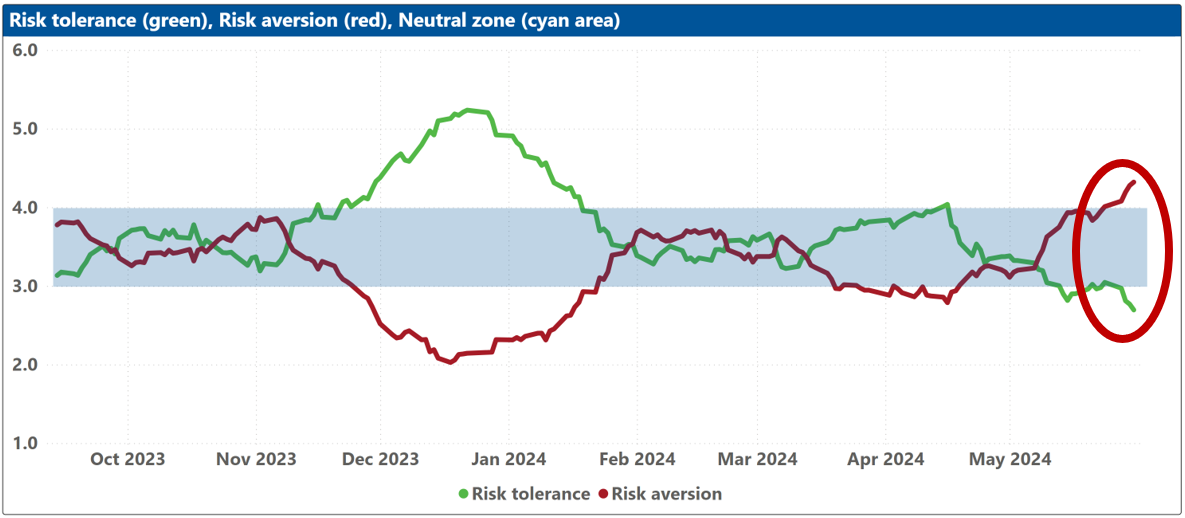
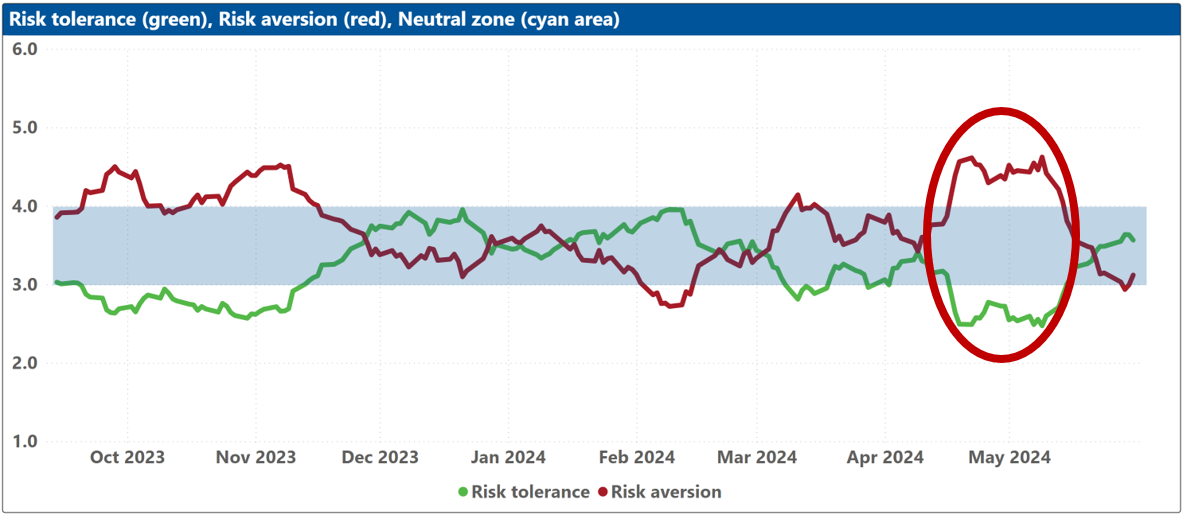
The bottom charts show the levels of both risk tolerance (green line) and risk aversion (red line) in the market. These represent investors’ demand and supply for risk. When risk tolerance (green line) is higher than risk aversion (red line), there are more investors looking to buy risk assets then investors willing to sell them (at the current price), forcing risk-tolerant investors to offer a premium to entice more risk-averse counterparts to take the other side of their trade, which drives markets up. The reverse is true when risk aversion (red line) is higher than risk tolerance (green line). The net balance between risk tolerance and risk aversion levels is used to compute the ROOF ratio in the top charts, representing the sentiment of the average investor in the market.
The blue shaded zone between levels 3-4 for both indicators represents a reasonable balance between the supply and demand for risk in the market. Conversely, when both lines are outside of this blue zone, the large imbalance in the demand and supply for risk can lead to an overreaction to unexpected news or risk events.