AXIOMA ROOF™ SCORE HIGHLIGHTS
WEEK OF JUNE 10, 2024
Potential triggers for sentiment-driven market moves this week
- US: May inflation data, consumer sentiment index, and the Fed interest rate decision meeting (no change expected).
- Europe: UK jobs report, wage growth, monthly GDP, and industrial production data. Germany’s wholesale prices. Eurozone industrial production data.
- APAC: China May inflation data. Bank of Japan interest rate decision (no change expected). Australia consumer and business confidence index, and the jobs report for May.
- Global: US inflation data and European economic strength will be top-of-mind for investors, with any new developments in the Middle East and Ukraine second.
Insights from last week's changes in investor sentiment:
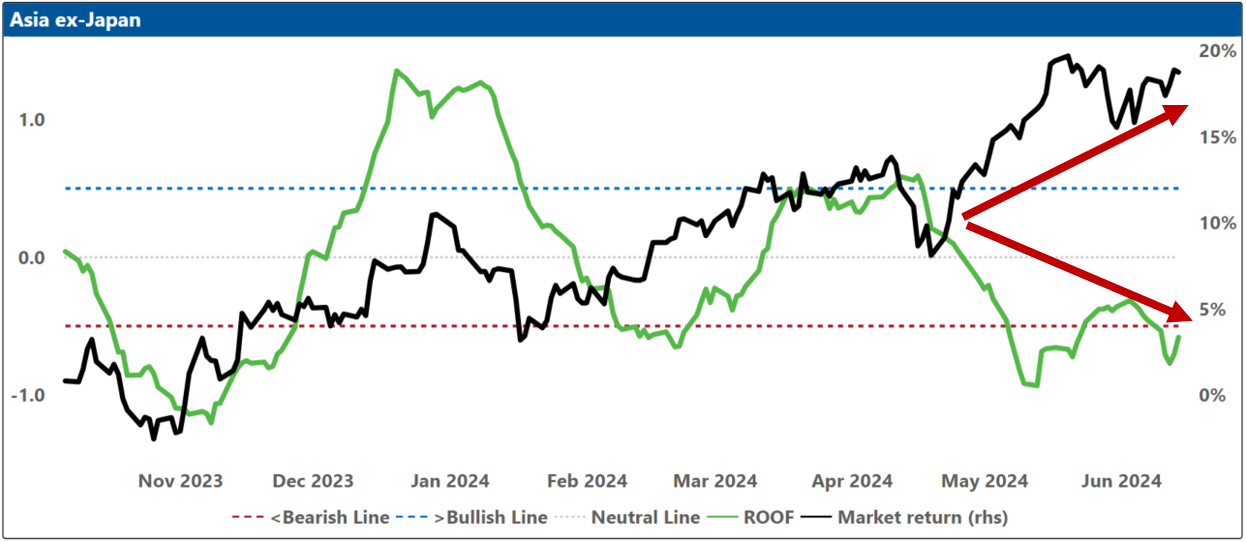
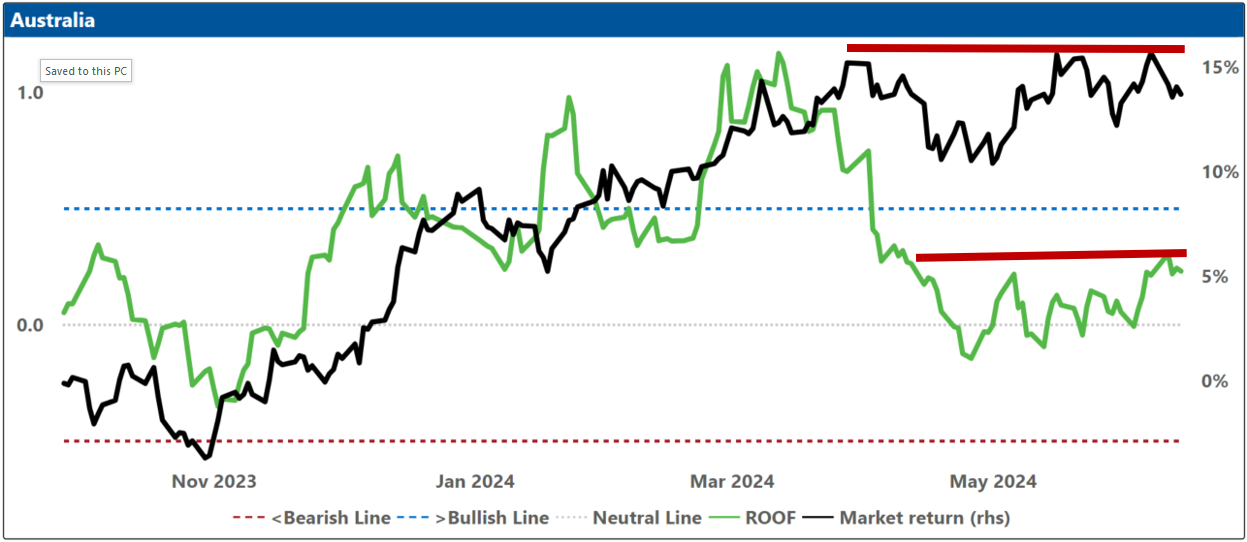
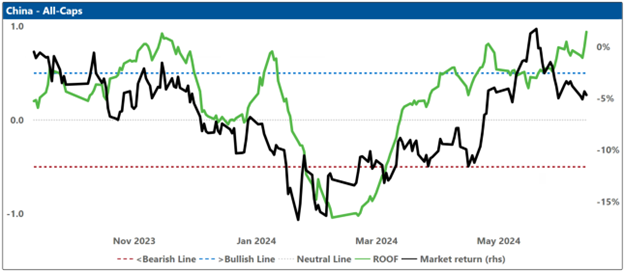
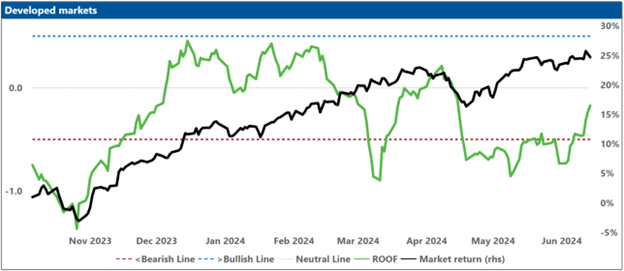
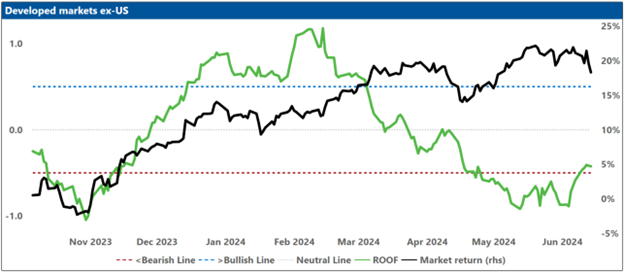
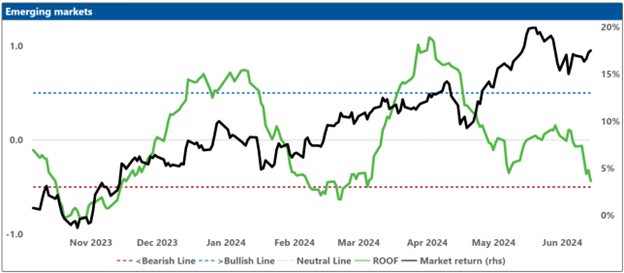
Investor sentiment experienced a recovery last week across almost all markets we monitor, with the exception of Asia ex-Japan, where investors remained bearish. Notably, sentiment among US investors continued to improve, reaching bullish levels for the first time this year. This improvement subsequently elevated the sentiment for Global Developed Markets from bearish to neutral. Additionally, the mood among UK investors rose sharply from bearish ten days ago to neutral now, driven by hopes that the Bank of England will follow the European Central Bank's lead in cutting rates. Although sentiment among investors in Global Developed ex-US Markets, Global Emerging Markets, and European markets remains very negative, it has improved sufficiently to no longer be classified as bearish. Elsewhere, investors in China maintained a bullish outlook, while those in Australia remained neutral.
The divergent paths taken by markets and sentiment across various regions since the beginning of May reflect a degree of wishful thinking among both bulls and bears. Bulls have been actively buying risk assets while bears have been moving to the sideline. Investing is forecasting. Forecasts can take the form of realism or fantasy. They can be true insights and foresights that make investment (relatively) safe, or delusions and follies that bedevil and endanger your portfolios. Markets, for their part, do not provide a happy or sad ending, but an open ending. They are simply the embodiment of the rolling consensus forecast of the near future by those who show up (i.e., the sideline doesn’t get to vote on this one).
In the US, bullish investors remain focused on the robust economic fundamentals and the prevailing low volatility regime, attempting to predict when six five four three two one rate cut could further enhance the investment landscape (a.k.a., going down safe creek with a paddle). Now that the ECB has made its move, investors are desperate to know what will convince the Fed to start cutting its interest rates. Is it core CPI? Core PCE? Unemployment? Wage growth? Any special foods?
If you are in the market, unhedged (a.k.a., swimming naked), then ex-ante exposure analysis offers the best means of understanding how your investment thesis might unfold during the summer, short of watching the market. Actually, better than watching the market because exposures are quantifiable, predictable, and attributable, while the market steamrollers over your portfolio and you understand what happened only days later.
Soon, markets will be entering the Forest of Summer, where it’s awfully easy to get lost. If investors keep focusing on seven companies here (US) and eleven companies there (Europe), they may lose sight of the very big, dark summer woods they’re trying to find a safe way through. Turbulence is likely to start in Europe but could rapidly spread to the US if the June and July inflation reports show renewed strength. Until then, investor sentiment continues to be a headwind in Asia ex-Japan, Europe, Global Emerging Markets, and Global Developed ex-US markets, but is providing tail wind in the US and China for now.
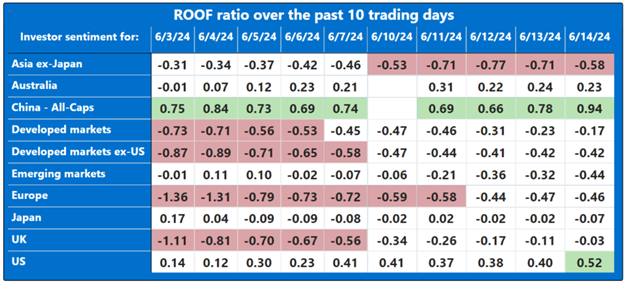
Note: green background = bullish, red background = bearish
Changes to investor sentiment over the past 180 days for the markets we follow:
How to read these charts: The top charts show the ROOF ratio (investor sentiment) in green (left axis), against the cumulative returns of the underlying market in black (right axis). The horizontal red line at -0.5 (left axis) represents the frontier between a negative sentiment (-0.2 to -0.5) and a bearish one (<-0.5), and the horizontal blue line at +0.5 (left axis) represents the frontier between a positive sentiment (+0.2 to +0.5) and a bullish one (>+0.5). Around the horizontal grey line at 0.0 (left axis), sentiment can be considered neutral (-0.2 to +0.2).
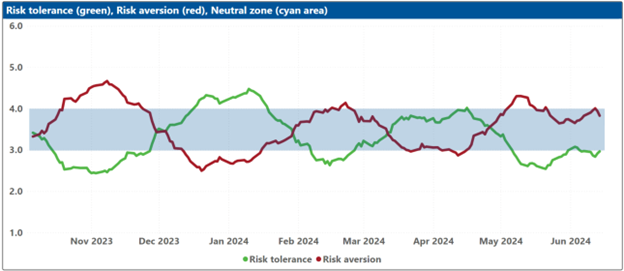
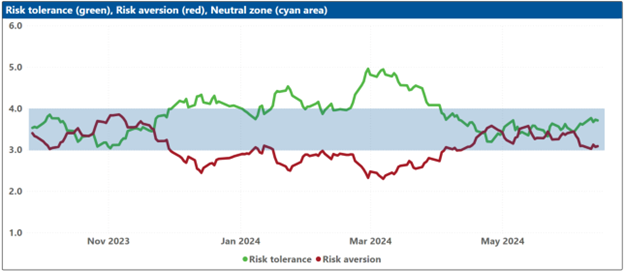
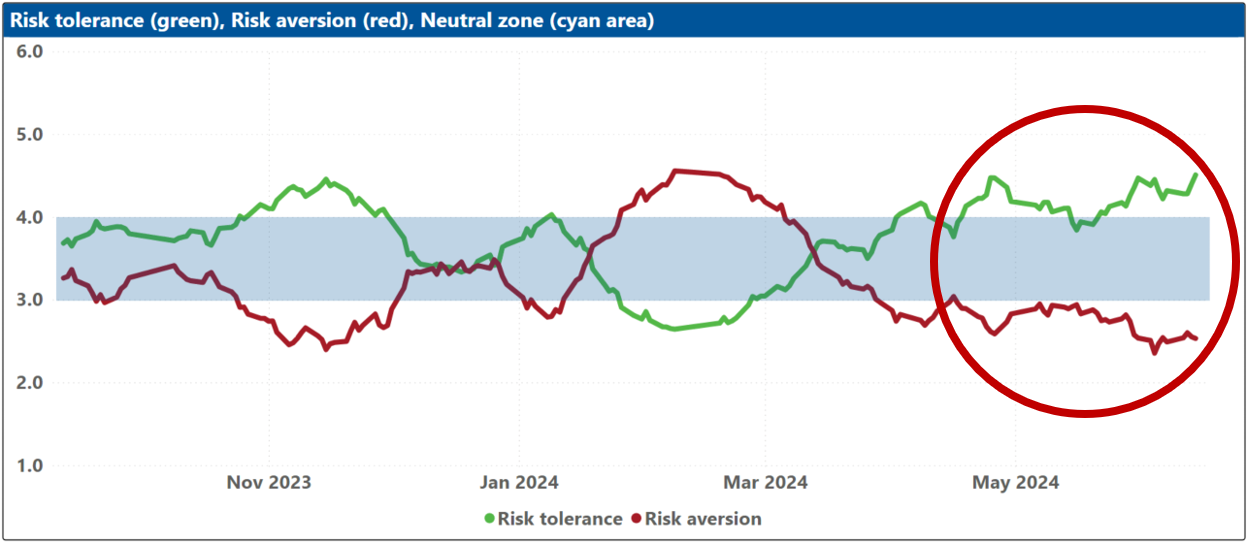
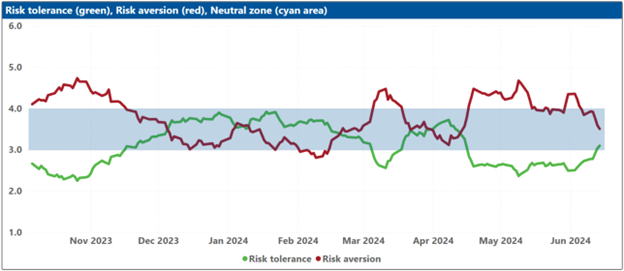
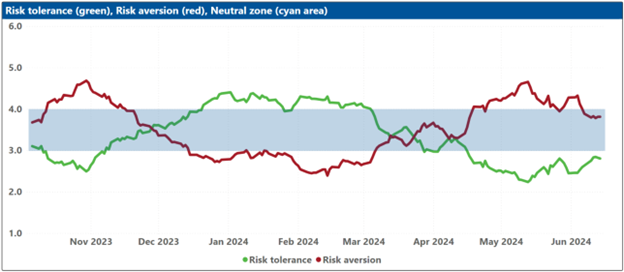
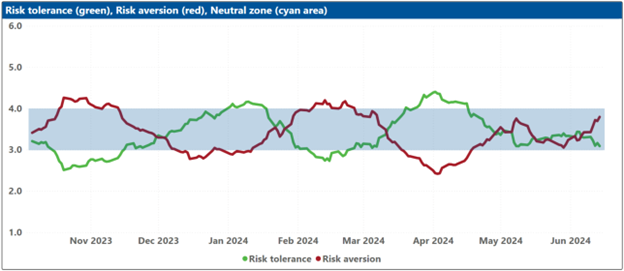
The bottom charts show the levels of both risk tolerance (green line) and risk aversion (red line) in the market. These represent investors’ demand and supply for risk. When risk tolerance (green line) is higher than risk aversion (red line), there are more investors looking to buy risk assets then investors willing to sell them (at the current price), forcing risk-tolerant investors to offer a premium to entice more risk-averse counterparts to take the other side of their trade, which drives markets up. The reverse is true when risk aversion (red line) is higher than risk tolerance (green line). The net balance between risk tolerance and risk aversion levels is used to compute the ROOF ratio in the top charts, representing the sentiment of the average investor in the market.
The blue shaded zone between levels 3-4 for both indicators represents a reasonable balance between the supply and demand for risk in the market. Conversely, when both lines are outside of this blue zone, the large imbalance in the demand and supply for risk can lead to an overreaction to unexpected news or risk events.