
AXIOMA ROOF™ SCORE HIGHLIGHTS
WEEK OF JUNE 24, 2024
Potential triggers for sentiment-driven market moves this week
- US: PCE, and personal income and spending data. Speeches by Fed officials, Final Q1 GDP and durable good orders. First US Presidential Debate.
- Europe: German business and consumer confidence data. French legislative elections (1st round).
- APAC: Japan retail sales, unemployment, and industrial production data. Tokyo inflation data and BoJ opinion notes.
- Global: Domestic politics takes center stage this week but isn’t expected to rattle markets. Meanwhile investors will keep an eye on the situation in Israel for any potential escalation.
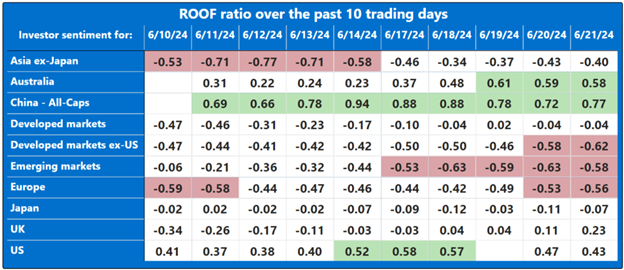
Insights from last week's changes in investor sentiment:
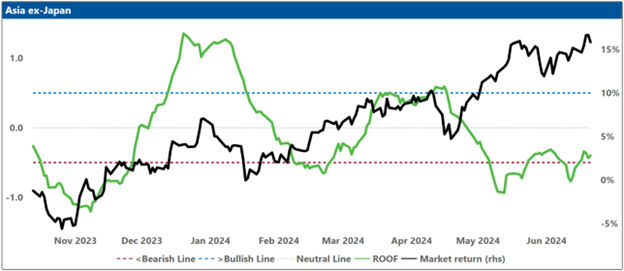
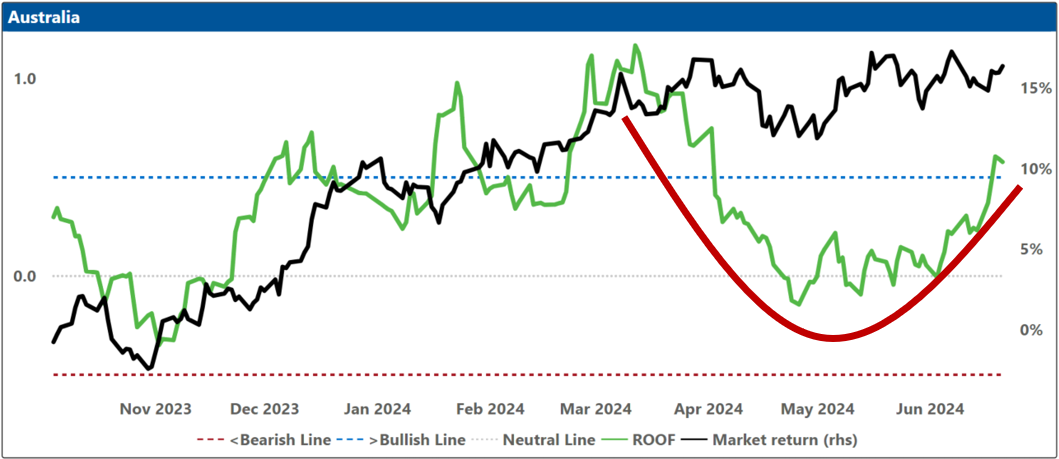
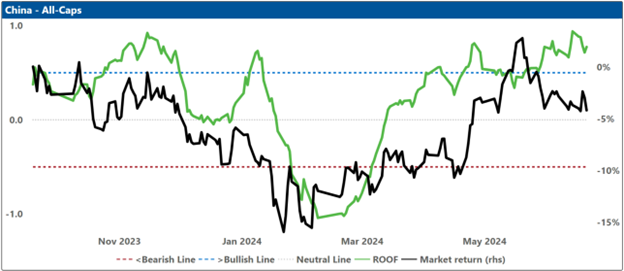
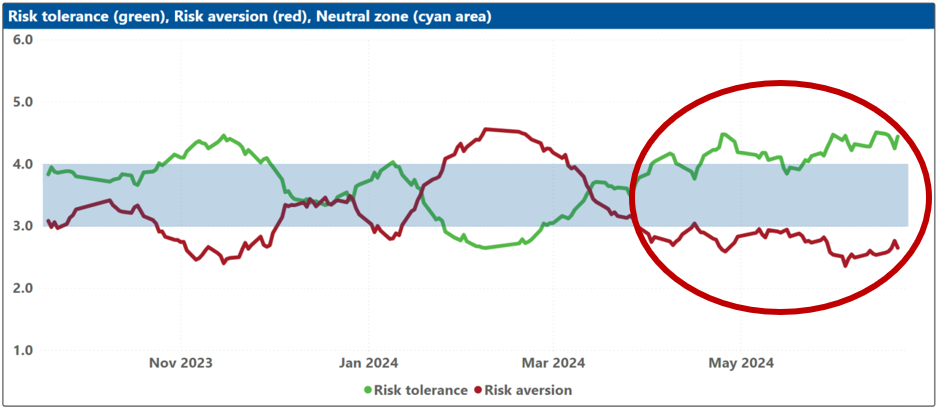
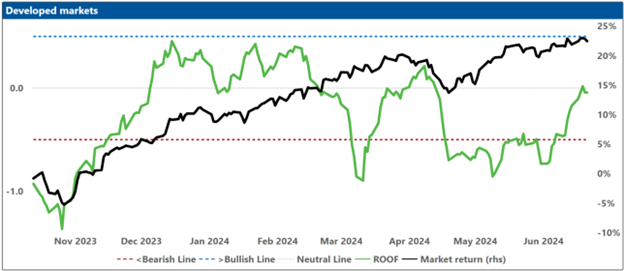
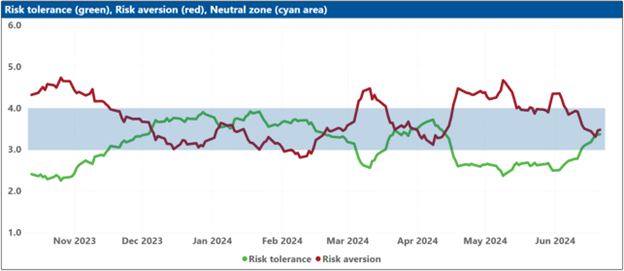
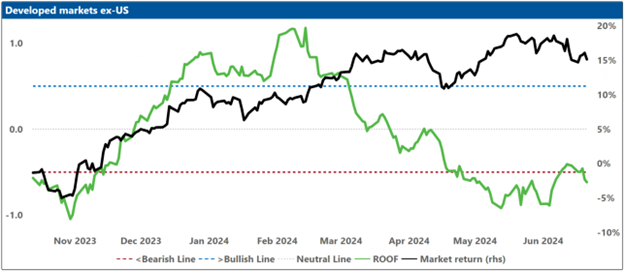
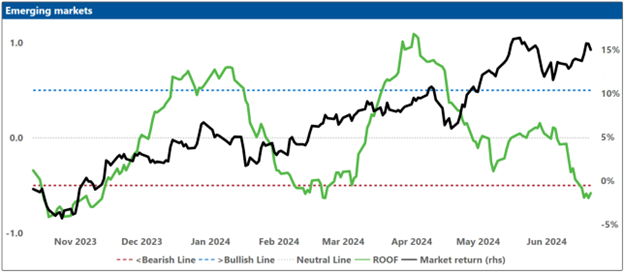
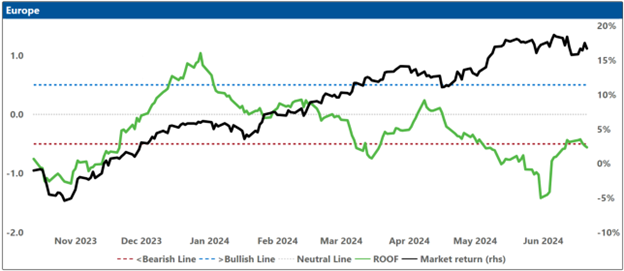
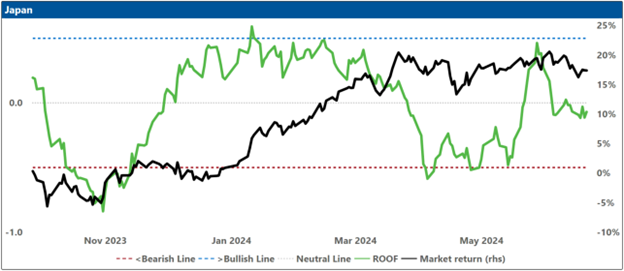
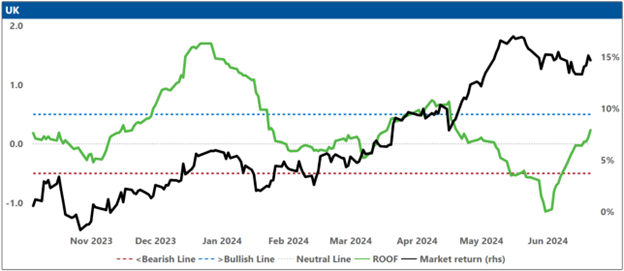
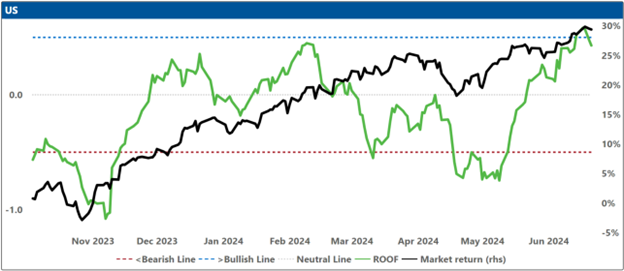
Investor sentiment experienced a slight decline last week across all markets, with the exceptions of Australia, where sentiment improved from positive to bullish, and the United Kingdom, where investors turned positive for the first time since mid-April. The anticipation of a series of political events in the United States, France, and the United Kingdom this week and the next contributed to an apprehensive shift in sentiment, causing investors in Global Developed Markets ex-US, Global Emerging Markets, and European markets to become bearish, compared to their strongly negative stance the previous week. In the United States, sentiment weakened marginally from bullish to strongly positive, driven by continued optimism (65%) regarding a potential Fed rate cut in September. Meanwhile, Chinese investors remained bullish but are still awaiting further details and larger figures concerning the property bailout plan from the authorities.
The geopolitical stalemate in Ukraine and Gaza, coupled with the deteriorating US-China relationship, continues to necessitate a higher equity risk premium for investors. This situation is further exacerbated by the investment alternative offered by persistently high risk-free rates. For now, it seems that only advancements in artificial intelligence or weight-loss pharmaceuticals have the potential to meet these elevated expectations.
In the forthcoming two weeks, France is anticipated to veer sharply to the right, whereas the United Kingdom is expected to veer sharply to the left through two protest votes. The primary concern for investors is the extent of voter discontent and whether they will grant France’s far-right an outright majority to govern the country for the next three years, which would undoubtedly shape the next German federal elections to be held on or before 26 October 2025.
Starting with this week’s inaugural Presidential debate between Joe Biden and Donald Trump, the United States is set to host no fewer than four significant political events this summer. These include two Presidential debates and two national party conventions, all leading up to the pivotal main event on November 5th (and possibly beyond). So much hangs in the balance with this one!
For the past two years, two predominant themes have steered both markets and sentiment: artificial intelligence (AI) and a shift in monetary policy. Investors have now allocated more capital into the former, exemplified by Nvidia ($3.36T), than the markets of either the United Kingdom ($3.25T), France ($3.15T), or Germany ($2.2T). Regarding the latter, the Fed seems on track to deliver the goods in September, approximately three months from now. In the interim, the realms of sports and politics will captivate the headlines, striving to keep investors entertained; the former by showing the heights to which humans can rise, the latter, in that principle-free, whatever-gets-me-elected way, the depth to which they can sink.
Note: green background = bullish, red background = bearish
Changes to investor sentiment over the past 180 days for the markets we follow:
How to Interpret These Charts:
Top Charts:
The top charts illustrate the ROOF ratio, which represents investor sentiment. This ratio is depicted in green on the left axis, while the cumulative returns of the underlying market are shown in black on the right axis. Key reference lines include:
- A horizontal red line at -0.5 (left axis), marking the threshold between negative sentiment (-0.2 to -0.5) and bearish sentiment (< -0.5).
- A horizontal blue line at +0.5 (left axis), indicating the boundary between positive sentiment (+0.2 to +0.5) and bullish sentiment (> +0.5).
- A horizontal grey line at 0.0 (left axis), around which sentiment is considered neutral (-0.2 to +0.2).
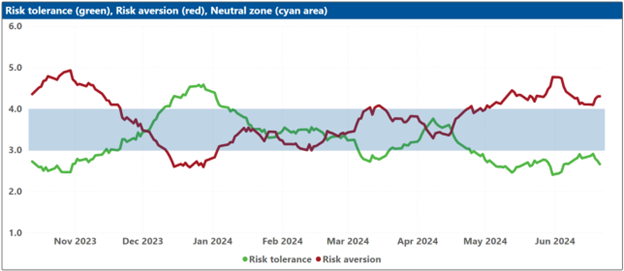
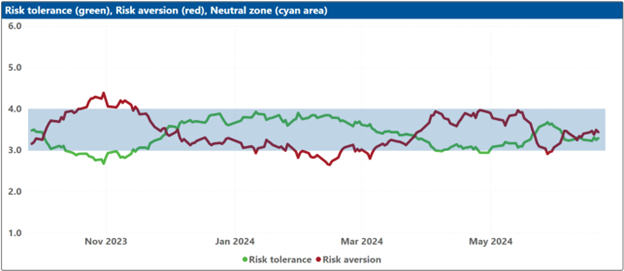
Bottom Charts:
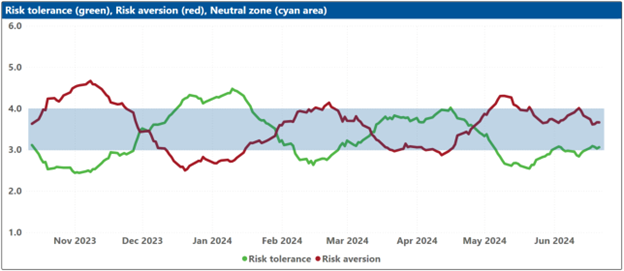
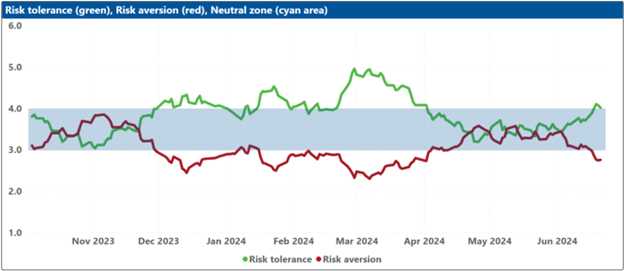
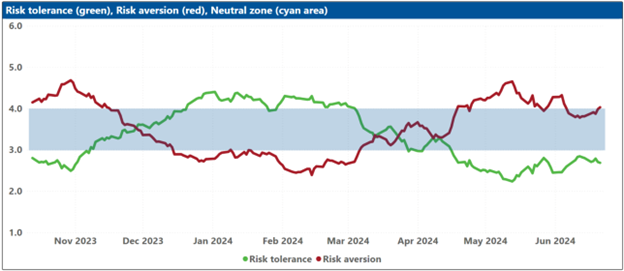
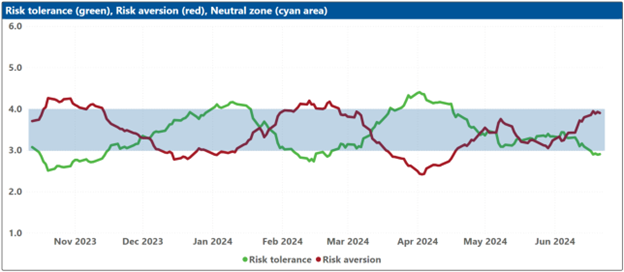
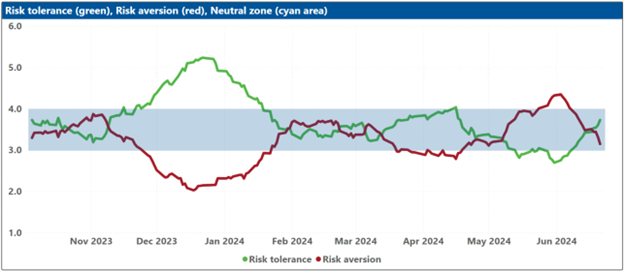
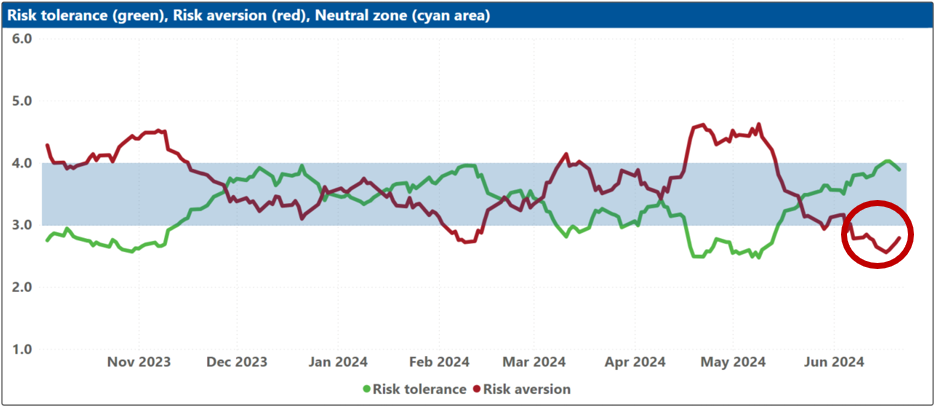
The bottom charts display the levels of risk tolerance (green line) and risk aversion (red line) within the market, representing investors' demand and supply for risk, respectively. Key insights include:
- When risk tolerance (green line) exceeds risk aversion (red line), more investors are willing to buy risk assets than there are investors willing to sell them at the current price. This scenario forces risk-tolerant investors to offer a premium to entice more risk-averse investors to trade, thereby driving markets upward.
- Conversely, when risk aversion (red line) surpasses risk tolerance (green line), the market dynamics reverse.
The net balance between risk tolerance and risk aversion levels is used to compute the ROOF ratio shown in the top charts, reflecting the sentiment of the average investor in the market.
Blue Shaded Zone:
The blue shaded zone between levels 3 and 4 for both indicators signifies a reasonable balance between the supply and demand for risk in the market. When both lines remain within this blue zone, the market is considered stable. However, when both lines move outside this zone, the significant imbalance in demand and supply for risk can lead to overreactions to unexpected news or risk events.