

Fighting uncertainty with sentiment
Author
Olivier d’Assier
Head of Applied Research, APAC
Investors have been worried about inflation since the start of 2021. At first, the worry was about rising inflation. Then it became about the monetary policy response and the damage this could eventually do to the economy. However, the ‘traditional’ model of rising inflation, the Fed reacting swiftly to curb consumer spending, the economy slowing down, and inflation returning to below target, were all nullified by a combination of factors: First, the unprecedented size of the post-Covid monetary and fiscal stimulus and second, the squeeze on the global supply chain from ongoing Covid lockdowns around the world. This resulted in a simultaneous increase in (consumer) demand and a cut in supply, pushing up prices. The post-Covid reopening after a prolonged lockdown only increased the demand for both products and services (a.k.a. revenge spending) making the lack of supply even worse for inflation. So, while consumers were happy to spend, they were hesitant to invest. The combination of a determined Fed and a resilient – almost revolting – economy weighed on investor sentiment.
Caught between a rock and a hard place? Sentiment tracking may be the answer
In times of high uncertainty, investors tend to either get out of equities by reducing their allocation to that asset class or hedge out market risk via an expensive derivative overlay. But what about investors who must remain invested during those times, what are their options? Assessing and tracking the sentiment of investors grants an additional layer of market risk analysis, one that emanates from the behavior of surrounding market participants. This practice enables the astute investor to more effectively anticipate the anticipations of others by constructing portfolios that align more closely with the sentiment behind their own investment thesis. Over the past 2.25 years, the sentiment premium paid by the US market for holding a portfolio that was aligned with sentiment was a cumulative 23.3%.
Who said it doesn’t pay to be emotional?
One of the ways a manager can use the Axioma risk models is as a sentiment indicator. Derived from the Axioma US short-horizon fundamental factor risk model (AXUS4-SH), our research team has compiled what we call ROOF (Risk-On Risk-Off) Scores. Based on exposures to the eight style factors (Dividend Yield, Growth, Leverage, Market Sensitivity, Profitability, Size, Value, and Volatility), these scores provide investors with an insightful tool to not only measure the sentiment of the average investor in the market, but also to construct portfolios that are demonstrably aligned with either a risk-averse or risk-tolerant investment thesis. In this note, we analyze the US market behavior from January 3, 2021, through to March 28, 2024 in order to determine if a strategy aligned with the prevailing sentiment in the market would better navigate this uncertain period than a sentimentally contrarian strategy.
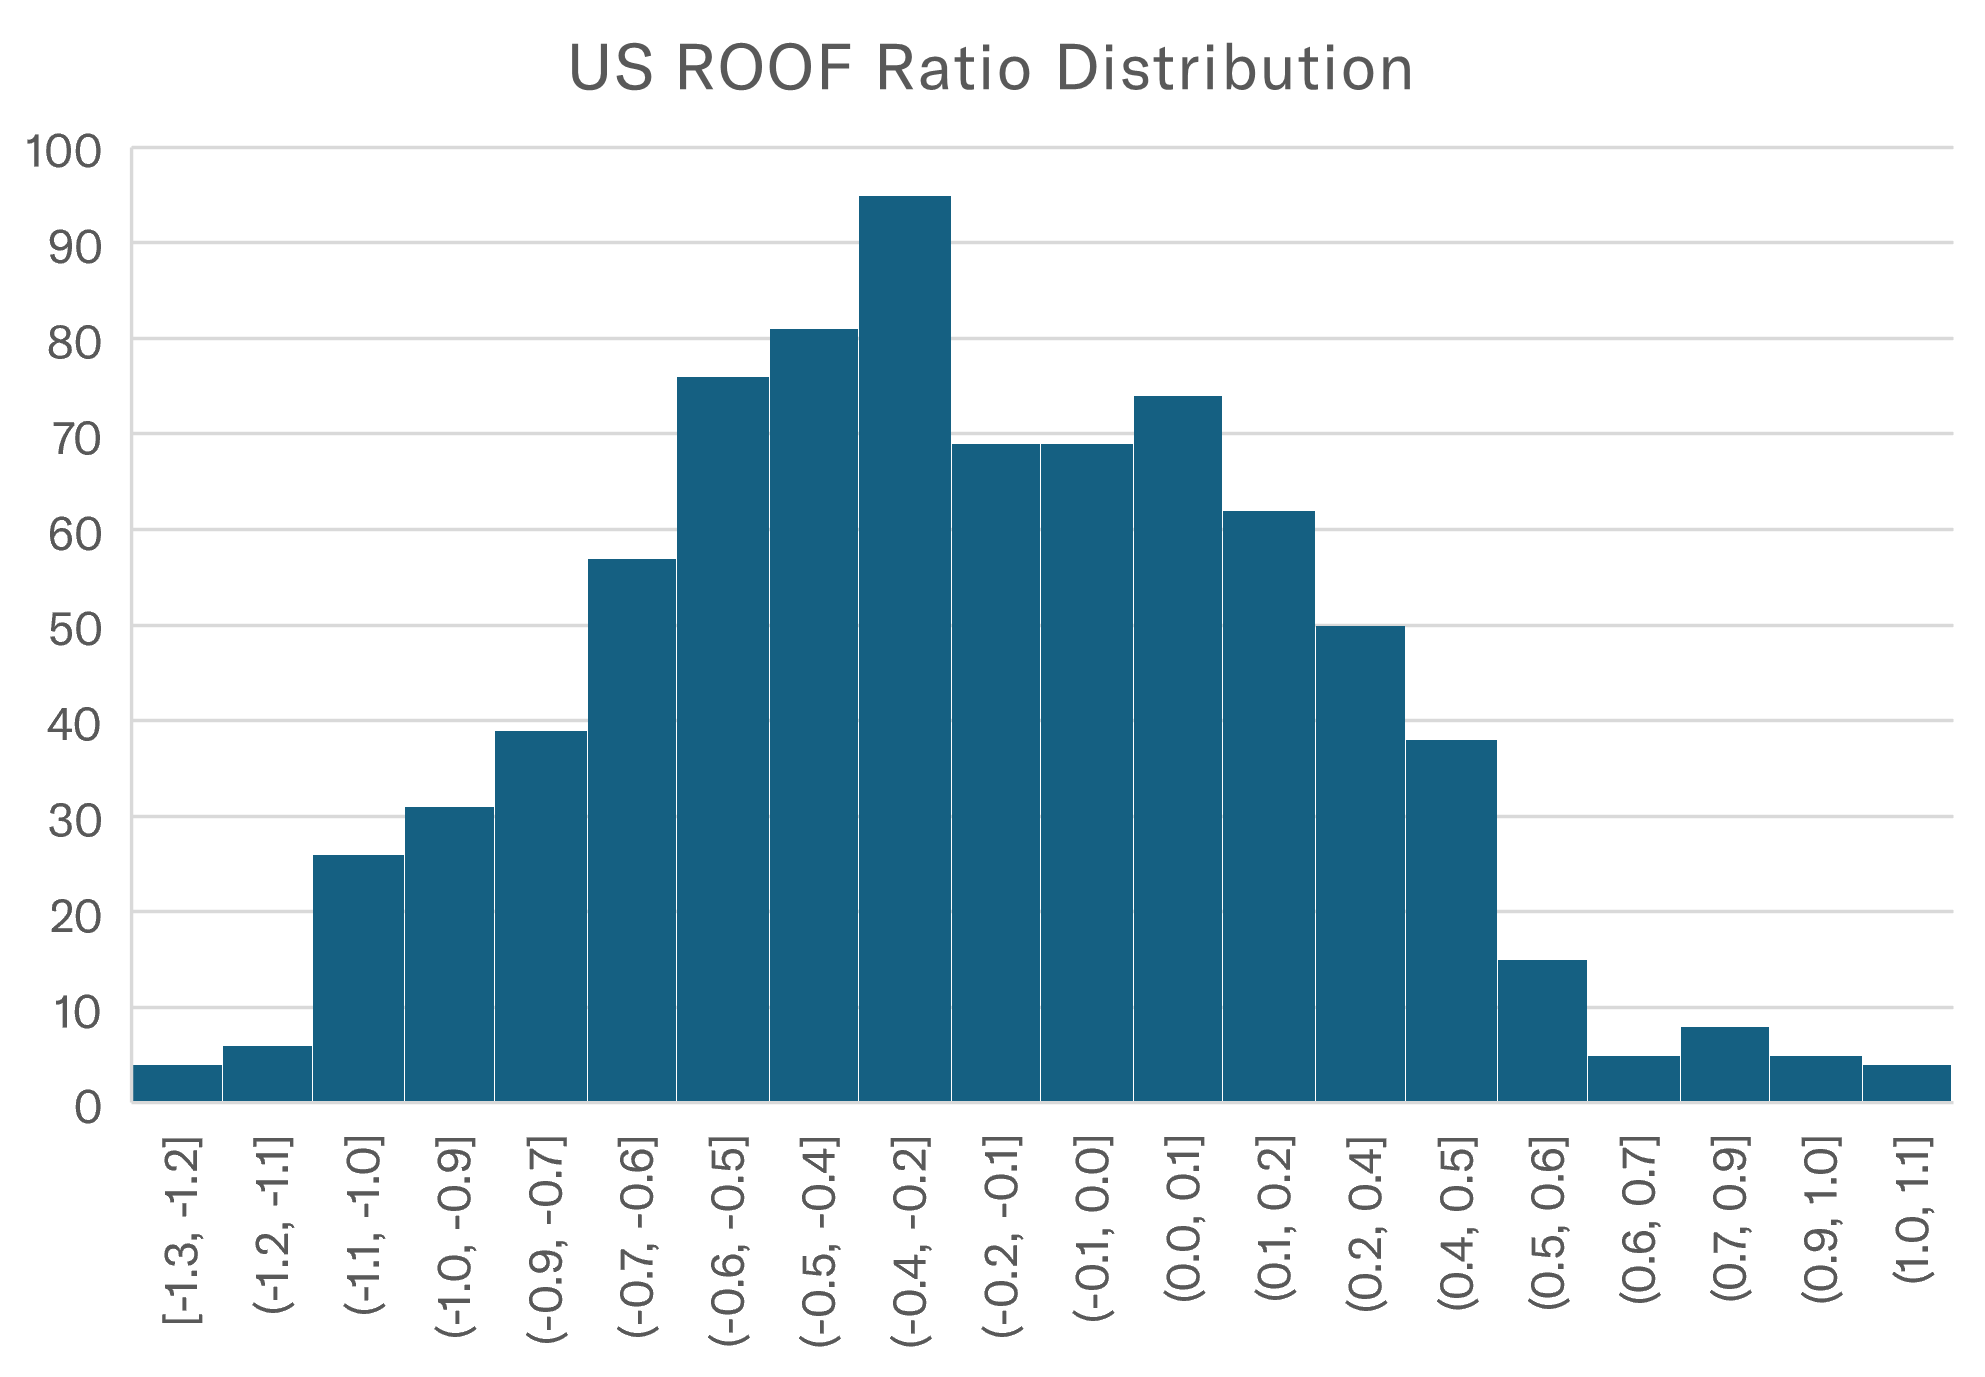
Figure 1 below shows the distribution of our ROOF ratio between January 3rd 2021, and March 28th 2024, which covers the period during which investors have consistently worried about inflation. The mean and median of the distribution, -0.21 and -0.24 respectively, reflect the fact that investors were negative most of the time during this period1. Over the 814 trading days under review, investors were bearish (a ROOF ratio below -0.5) for 219 (27%) days, negative (a ROOF Ratio between -0.2 and -0.5) for another 211 (26%) days, neutral (a ROOF ratio between +/-0.2) for 237 (29%) days, positive (a ROOF Ratio between +0.2 and +0.5) for 115 (14%) days, and bullish (A ROOF ratio above +0.5) for only 32 (4%) days.
Figure 1. Distribution of ROOF Ratio for US-LMS: 01/03/2023-03/28/2024
Source: Axioma ROOF™ Scores
The reasons for this mostly negative sentiment are not hard to guess. Uncertainty about the macroeconomic situation and the start of the Ukraine war in February 2022 have combined to sharply reduce investors’ confidence in any forecast that came out of their alpha models. Lower confidence-adjusted returns, higher market risk from geopolitical events and the banking crisis of March 2023, together with attractive higher risk-free interest-bearing alternatives during the period forced investors on the defensive. In 2022, FOMO (fear of missing out) turned into JOMO (joy of missing out) for those investors sitting on the side lines.
ROOF Portfolios
To measure the returns that the market pays for risk-taking, we developed an additional methodology that uses the Sector ROOF scores to construct two variants of a benchmark portfolio representing the strategy of a risk-averse investor with a bearish investment thesis (Risk-Off) and of a risk-tolerant investor with a bullish investment thesis (Risk-On).
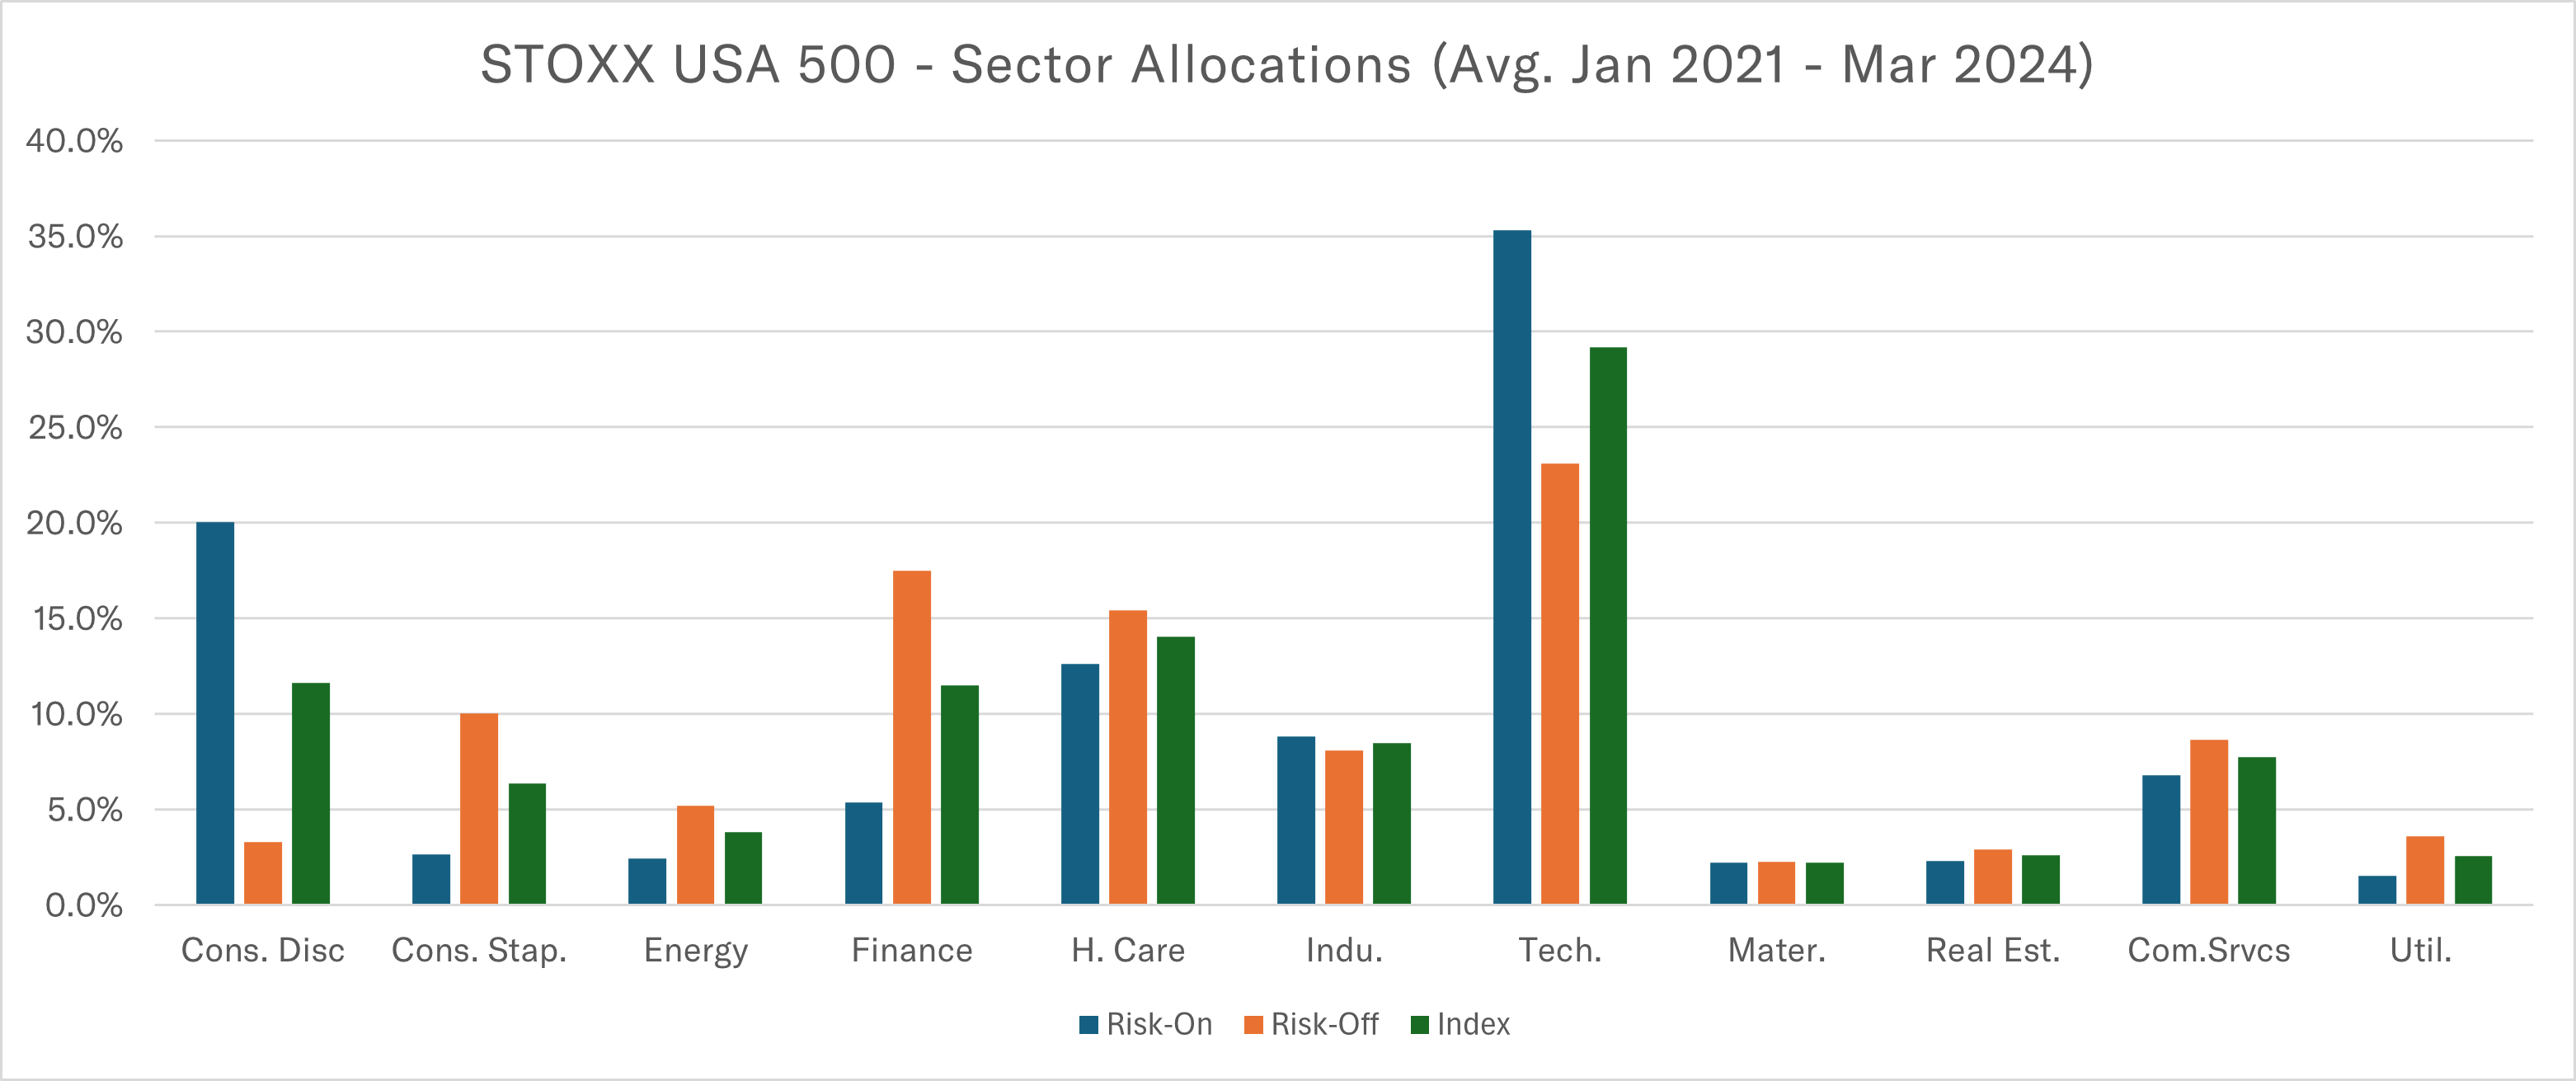
Figure 2 below shows the average sector allocation for both portfolios and the parent index in during the 2.25-year period. As anticipated, the Risk-On portfolio has an overweight position in the Technology and Consumer Discretionary sectors while the Risk-Off portfolio underweights them. Conversely, the Risk-Off portfolio has an overweight position in Consumer Staples, Financials, and Health Care sectors, while the Risk-On portfolio underweights those.
Figure 2. Cumulative Returns of STOXX USA500 and ROOF Portfolios
Source: Axioma ROOF™ Scores
Cumulative Results
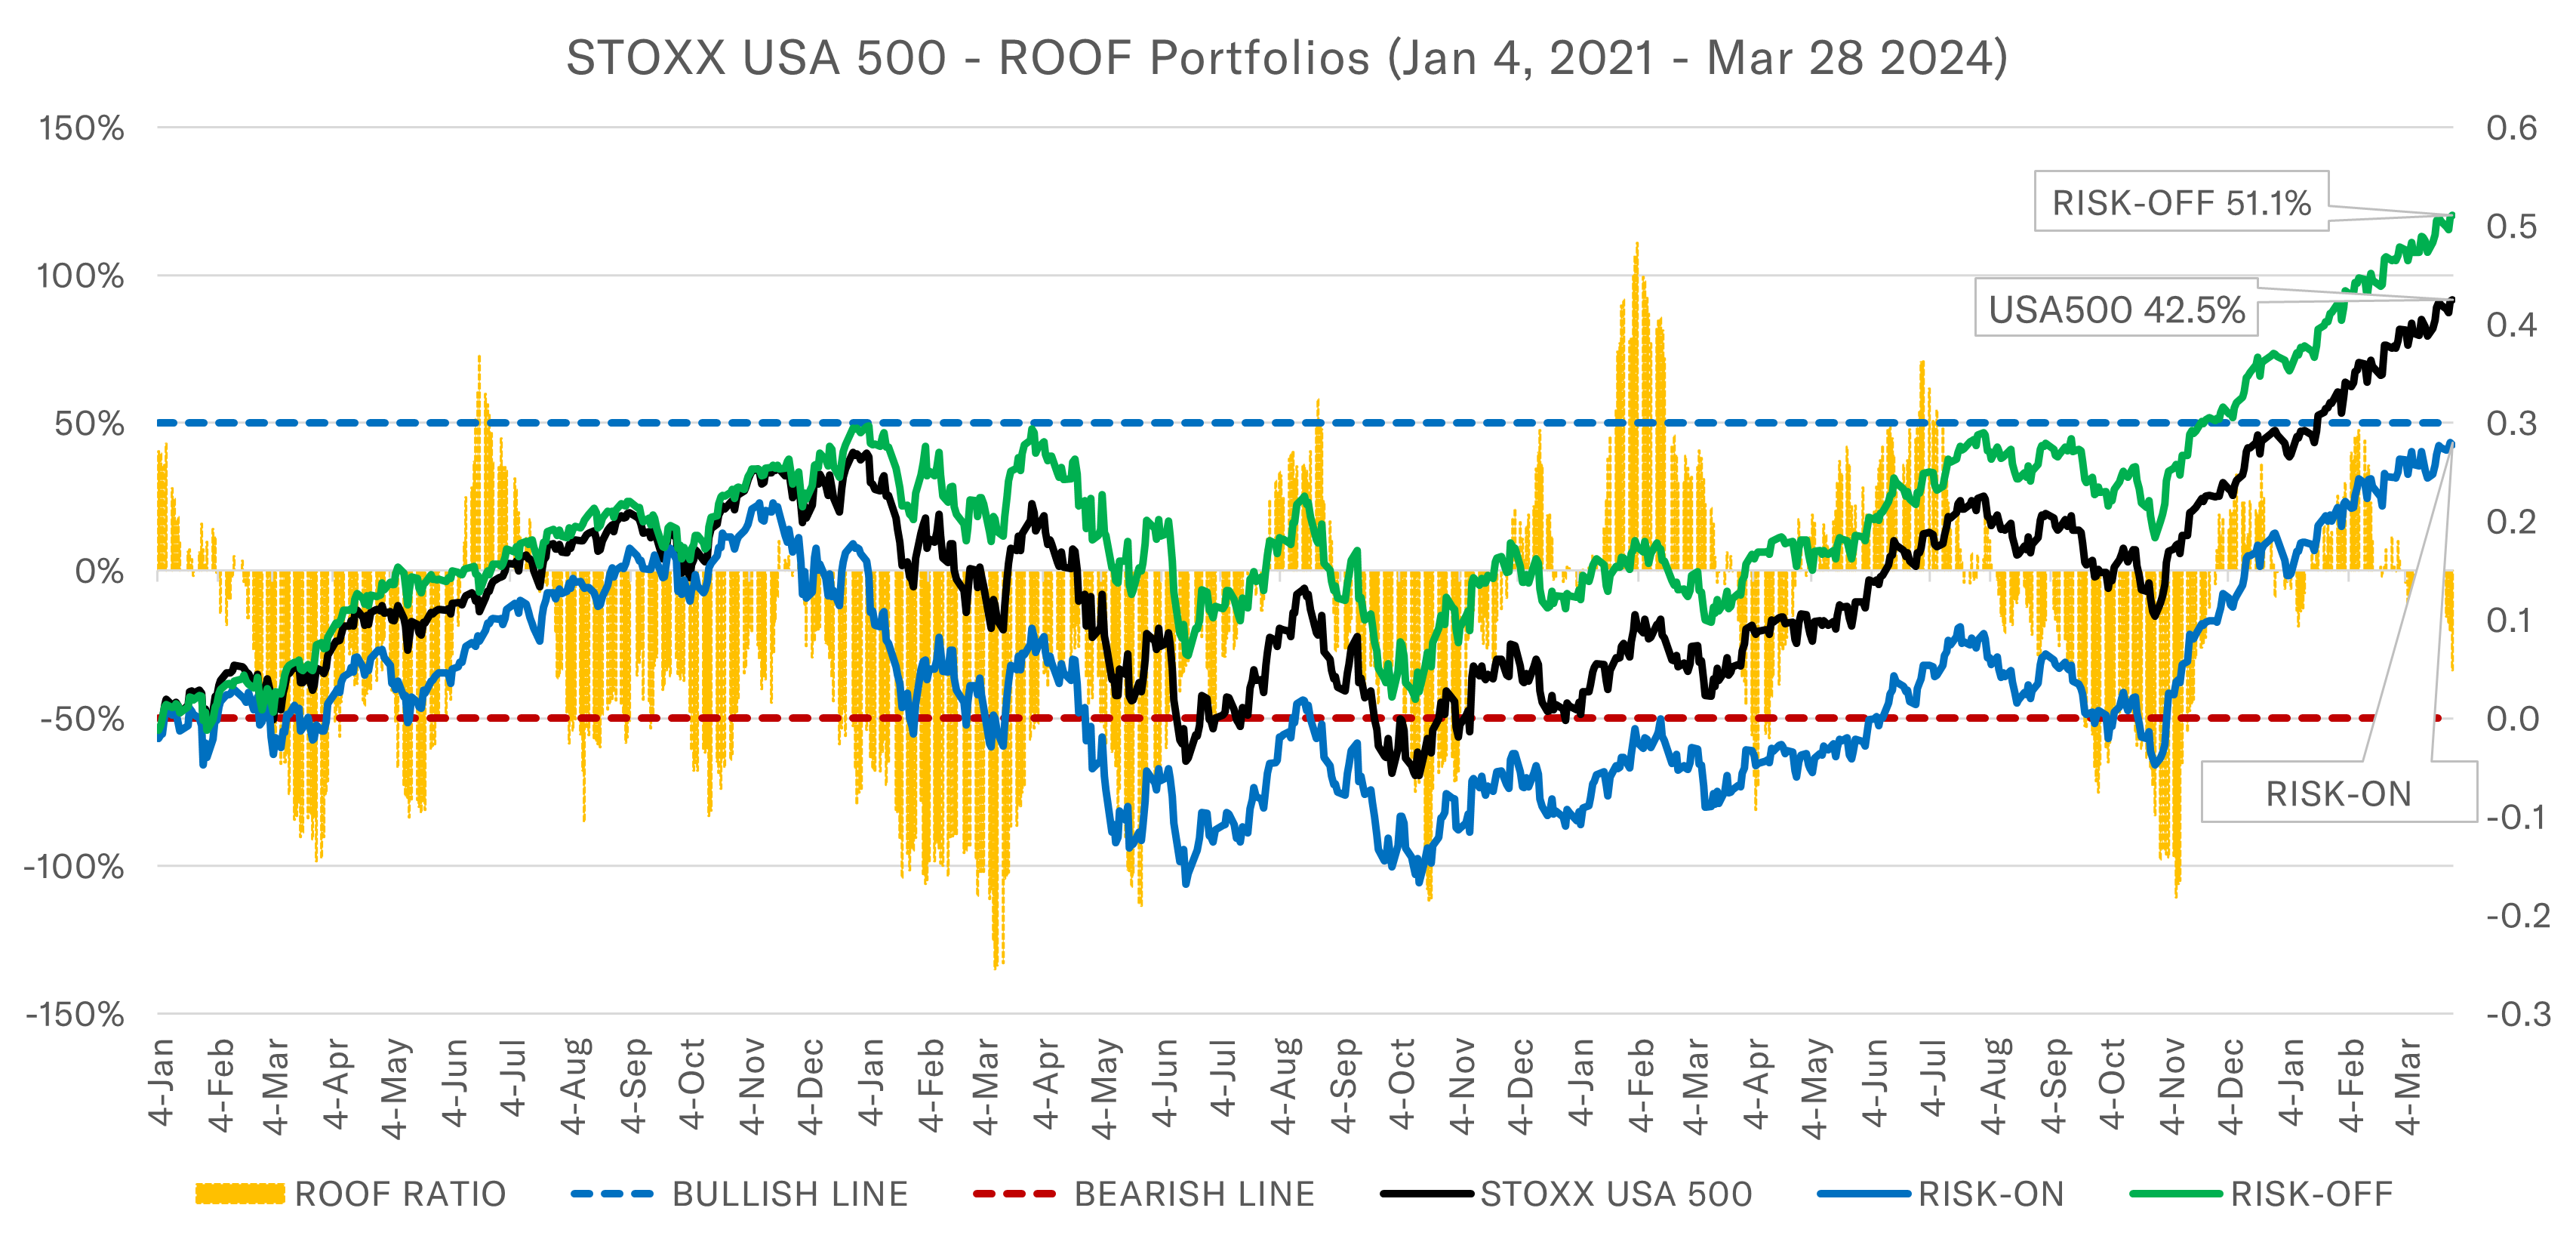
In Figure 3 below, we plot the cumulative returns of the three portfolios: STOXX USA 500 benchmark (in black), Risk-On variant (in blue), and Risk-Off variant (in green) between January 4, 2021, and March 28, 2024. We can see three distinct periods during the last 2.25-years. The first period is the full year 2021, as investors worried about inflation and therefore stayed away from risk taking. During that year, the Risk-Off portfolio closely matched the benchmark returns, outperforming it by less than 3% (29.0% vs 26.2%) but the poor performance of the Risk-On portfolio (16.7%) shows that the market was not rewarding risk-taking in 2021. In fact, you could say it punished risk-taking to the tune of 10% (26.7% - 16.7%).
Figure 3. Cumulative Returns of STOXX USA 500 and ROOF Portfolios
Source: Axioma ROOF™ Scores
The second period was a down-market of 2022 when investors were decidedly bearish, and the market again rewarded portfolios designed to protect the downside and punished those designed to speculate on the upside (if any). By the end of 2022, despite the down market for the year, the Risk-On portfolio was still up 12.4% since January 4th, 2021, while the benchmark was up only 1.3% after two years. The Risk-On portfolio was now down a cumulative -9.6% since inception on January 4, 2021. The sentiment risk premium (Risk-On minus Risk-Off) was now a whopping 22% at the end of 2022, up from just 12.3% at the end of 2021.
The third period covers 2023 and Q1 2024. During this period, the pivot theory was a key feature of markets and provided investors with multiple rallies (especially after October 2023) on the hope for an always elusive Fed rate cut. This on-again / off-again environment created many sudden and short-lived changes in sentiment (see orange bars in figure 3) but we note that the disappointments were deeper than the satisfactions in absolute ROOF ratio values, signifying a cautiously optimistic sentiment rather than a full-on committed bullish one. By the end of March 2024, the Risk-On portfolio was back to moving in parallel with the other two but could not make up for the underperformance of the past two years. By March 28, 2024, the Risk-Off portfolio was up a strong 51.1% over the full period, while the benchmark STOXX USA 500 was up 42.5% and the Risk-On portfolio up only 27.8%.
What does this mean for investors?
The ongoing relative outperformance of the Risk-Off portfolio, even during the last six months reflects a lack of conviction about the Fed’s pivot, which keeps getting postponed with each monthly macro data release, showing a more resilient economy and a stickier inflation than fits the pivot thesis of an early rate cut. In essence, while markets are no longer punishing risk-taking, they are still rewarding patience, which is more aligned with a risk-averse strategy than a risk-tolerant one. Absent an actual first rate cut and given the ongoing risks to inflation from the potential impact on oil prices of an escalation of the Israel-Hamas war, markets are likely to keep rewarding patience over anticipation. When uncertainty is high, and conflicting data results in multiple false starts, there is no first-mover advantage. Add to this equation a big unknown in the form of the US Presidential election results, and a still high yielding alternative to equities in money market funds, and we are likely to continue to see Risk-Off portfolios outperform Risk-On ones in 2024.
ROOF Scores & Portfolios Methodology
The market ROOF Scores are computed using the daily active returns of each of the eleven sector portfolios to determine if investors ‘preferred’ more risk-tolerant or more risk-averse sectors each day. We then use the 20-day average scores to derive the market ROOF Score. This is done to both smooth out the noise from daily data and to capture the rebalancing decisions of as many investors as possible through this one-month window. Finally, we adjust the smoothed ROOF Scores by dividing them by the rate of change in daily ROOF scores (i.e. we divide the 20-day average ROOF score by their standard deviation over the last 20 days). This is done to ensure the ROOF Scores reflect the courage of investors’ convictions. We call this final iteration the ROOF Ratio. This is the metric used in the weekly ROOF highlight reports which summarize investment insights from the past week’s change in investor sentiment.
The ROOF portfolios are constructed by starting with each sector’s weight in the parent benchmark (STOXX USA 500) and overweighting sectors aligned with the strategy’s sentiment (i.e., overweight risk-averse sectors and underweight risk-tolerant sectors for the Risk-Off portfolios and vice versa for the Risk-On portfolio). Asset selection in each portfolio is done by the Axioma Portfolio Optimizer with a constraint to ensure that the stocks selected tilt the portfolio towards the strategy’s style factor assignment. For the Risk-Off portfolio, this means tilting towards Dividend Yield, Profitability, Value, and Size, and tilt away from Growth, Leverage, Market Sensitivity, and Volatility factors. And vice versa for the Risk-On portfolio. The portfolios are rebalanced monthly, using the then-current sector ROOF scores, and have a maximum tracking error of 5% to the benchmark, leaving enough room for the optimizer to capture as much of the ROOF signal as possible while not deviating dramatically from the benchmark portfolio.
Learn more about the ROOF Scores and get the weekly highlights delivered to your inbox.
Related content