

"Liberation Day” Frenzy
When linear factors miss the full story
Non-linear factor analysis revealed hidden investor preferences
Author
Melissa Brown, Head of Investment Decision Research1
The potential imposition of high tariffs on every US trading partner announced on April 2, 2025 was clearly destined to have a substantial impact on the global economy. For many of our readers, equally important questions are what was the impact on factor returns, and does the latest global risk model provide us with additional insights?
Spoiler alert: we found that most factors saw larger-than-expected returns, but while they were quite volatile over time they were generally in the “right” direction. Factors (at least for those who did not constantly rebalance just to get whipsawed) were therefore unlikely to lead to substantial underperformance. We did gain some interesting insights from the behavior of the non-linear factors, however, and conclude that managing that factor risk was critical.
It is no secret that equity markets had a dramatic reaction, with global equities falling more than 11% and the short-horizon fundamental risk forecast according to our newest risk model (Axioma WW5.1) almost doubling over the subsequent three days. The increase in risk was one of the biggest proportional increases we have seen over such a short period of time in the history of the WW5.1 model. As tariff postponements to give countries more time to negotiate were announced, the global equity market recovered. While predicted volatility drifted down slowly, by the end of May, risk remained well above its level of just two months prior (Exhibit 1).
Exhibit 1. Post-Liberation Day return and risk, STOXX Developed Markets Index
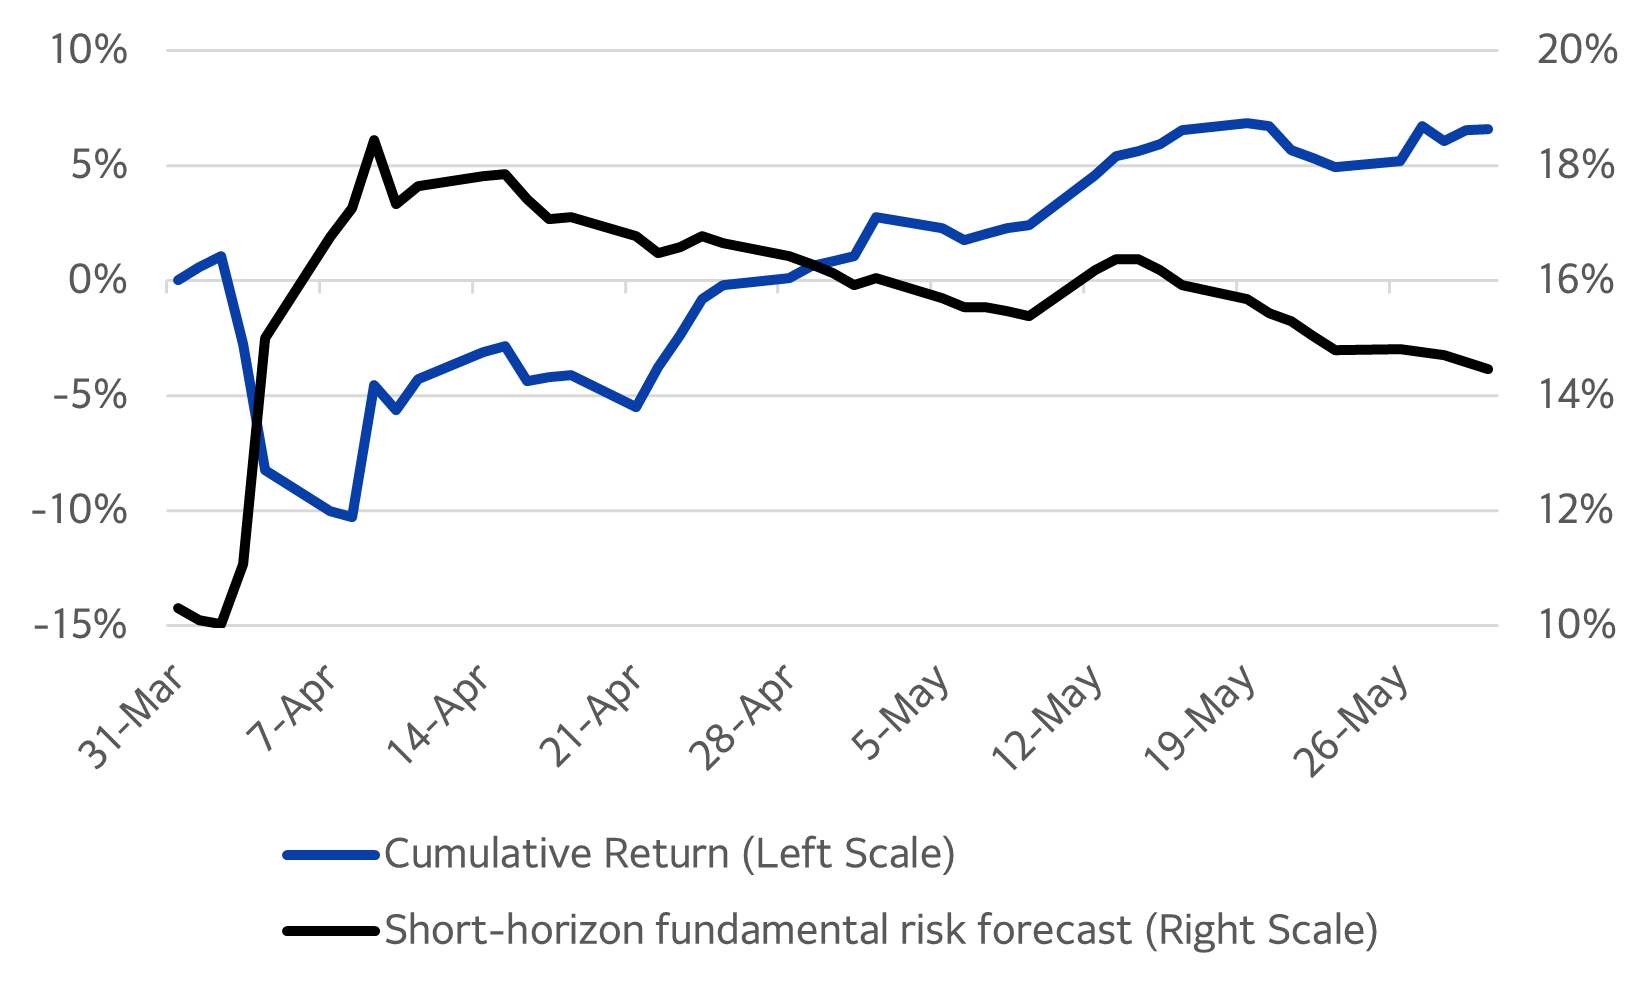
Source: STOXX, Axioma Worldwide Equity Factor Risk Model (WW5.1)
Style returns were large, but mostly in the expected direction in April…
Over the same period most style factor returns as defined by the WW5.1 model saw higher-than-average magnitudes not only in the period immediately following “Liberation Day” as benchmark risk was rising, but also throughout the rest of April, despite the downward drift in overall risk (Exhibit 2). In most cases returns were in the “expected” direction, where expectations were based on long-term average returns. Therefore, while active portfolio returns may have been of higher magnitude than expected owing to the market risk increase, in many cases they should have been in the “right” direction.
Still, exposure to non-linear factors may have caused some angst. In the immediate aftermath of the announcement (April 3 – April 9), the Developed ex-US and Emerging Markets Non-linear Structure factors produced among the most negative returns of all model factors. We also compared these returns to other historical periods of sudden volatility jumps, and found returns in this recent period were the highest five-day returns for these factors among all periods after the initial onset of other historical crises such as COVID, the Global Financial Crisis and the bursting of the internet bubble (Exhibit 3).
On April 10, as tariffs were paused and overall volatility stopped rising the fortunes of these two factors reversed as well, and their returns through the end of April were among the highest of all model factors, as well as being the highest for those factors relative to other crises. Note that the non-linear terms had not changed; the reaction to them did.
Exhibit 2. WW5.1 factor returns, immediately post “Liberation Day” and from then until the end of April
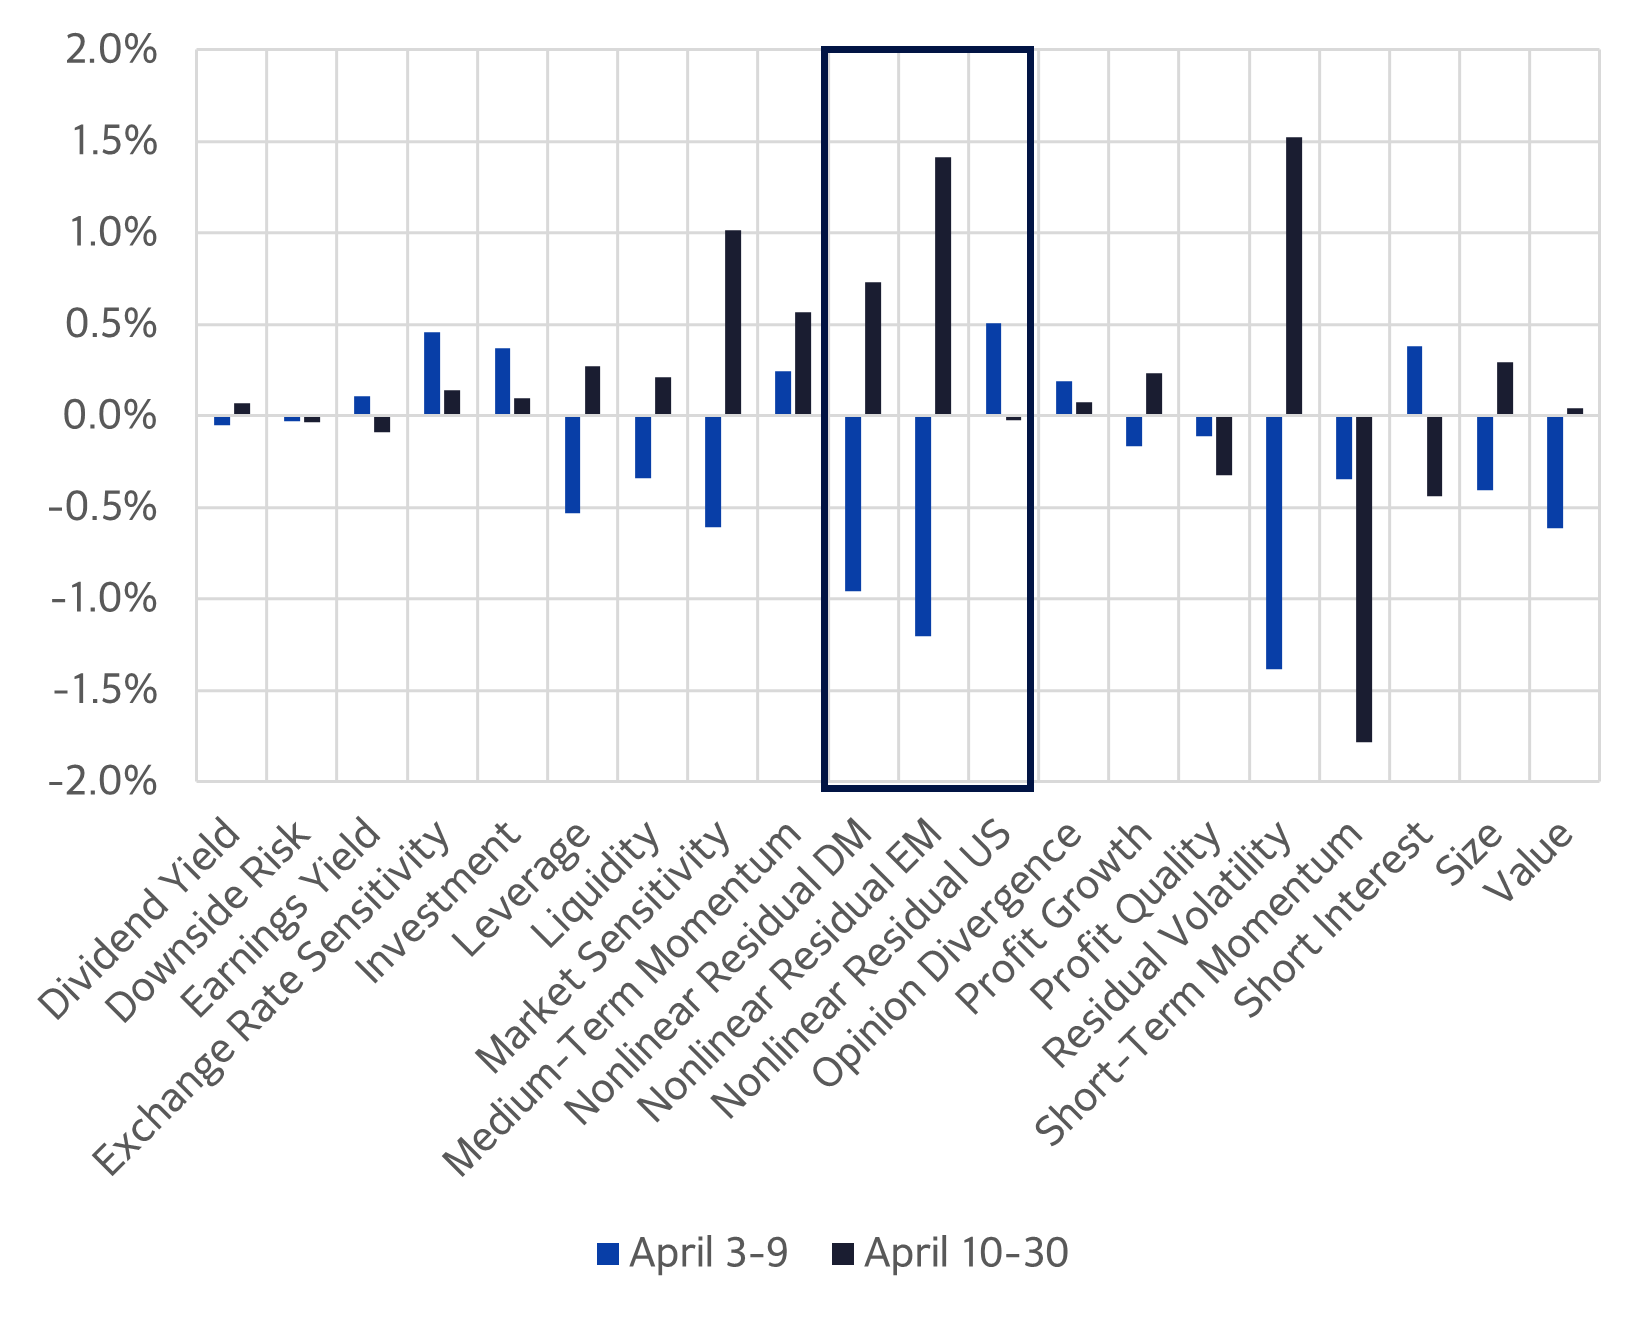
Source: Axioma Worldwide Equity Factor Risk Model (WW5.1)
The magnitude of these non-linear factor returns led us to dig more deeply into what they meant, and helped provide even more granularity on which types of stocks investors were seeking or avoiding.
How do we interpret them? The most significant factor pair for each non-linear factor at the beginning of April was Downside Risk x Size, and the model exposures were negative. The Non-linear Residual Structure factor in our risk model is based on the expectation that non-linearities will persist in the short term, and that they are region-specific. The negative non-linearity exposure meant that investor preference in the period preceding April was for low Downside Risk in large cap names, and/or high Downside Risk in small caps. That was not realized in the first five days of our study, and therefore the non-linear factor returns were negative.
At the same time the return to Downside Risk alone was slightly below zero (the pattern was two highly negative days followed by three flat to up days), and the return to Size was also negative. Combining those with the negative non-linear factor returns tells us that investor preference – at least in those first two days – was for smaller stocks, but only those with low Downside Risk.
When the non-linear factor returns turned positive after April 9, the return to Downside Risk was still slightly negative but Size produced a positive return. That tells us that investors still preferred low Downside Risk, but now it was for larger stocks with low Downside Risk.
US provides a different perspective
The return to the non-linear factor for the US in the five days post Liberation Day was also large versus that of other factors during the same period as well as versus its own long-term average. In this case, and in contrast to the other non-linear factors, the return was quite positive. At the end of March the US non-linear factor was dominated by Size^2 and Size^3, both of which impact the very largest and very smallest names relative to the middle of the size range. Other factor cross-terms, such as the one we described above, were small in magnitude.
The positive non-linear return combined with the negative performance of the standard Size factor means that investors were distinctly avoiding the very largest and smallest names in the index while favoring the mid-caps. After the first five days the Size return turned positive and the non-linear US return was close to zero, indicating a renewed interest in the mega-caps.
For a more detailed description of the Non-linear Residual Structure factor, please see this paper.
Exhibit 3. Non-linear factor performance versus historical periods in which risk jumped
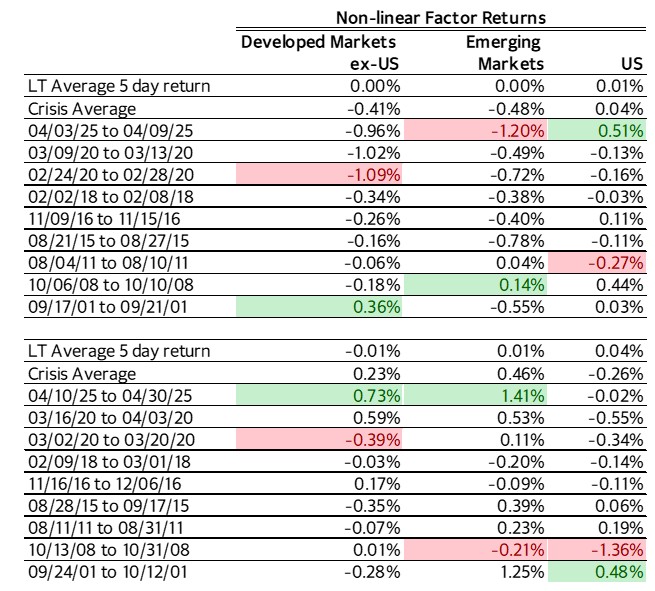
Source: Axioma Worldwide Equity Factor Risk Model (WW5.1)
Note: Shading indicates highest (green) and lowest (pink) returns of the various crisis periods. In periods chosen, risk jumped at least 50% over a five-day period. Starting date on the first panel indicates first day of risk increase.
Managing non-linear behavior
The original announcement of global tariffs sent the global stock market into a tailspin as volatility soared. Stocks fell dramatically and investment style factors see-sawed from day to day as investors tried to determine the implications on company earnings, management strategy, Fed policy, bond market reaction, etc. Trying to maintain a disciplined investment strategy through this period was fraught with uncertainty. Luckily, the subsequent pause calmed markets down, volatility eased (although it remained substantially higher than it was just a few days prior) and for the most part day-to-day factor performance returned to normal. Cumulative returns for a number of style factors were still higher in magnitude than expected, reflecting continued volatility “under the surface”, but fortunately most were not likely to have surprised style-based investors or caused undue underperformance.
As this was happening, returns to the Non-linear Residual Structure factor 1) were large in magnitude relative to other factors, 2) were higher than they have been in most periods when risk rose substantially in a short period of time and 3) flip-flopped as tariff threats eased temporarily, similar to what we saw for many other model factors. These high-magnitude returns, especially outside the US, were an indication of distinctly non-linear investor behavior, and highlight the importance of managing the risk associated with that behavior.
References/footnotes
1 Many thanks to my colleague Bob Stock for answering my endless questions about the inner workings of the non-linear factors.