A step-by-step guide for hedge funds
Author
Saboor Zahir
Senior Director, Solutions Engineering - Americas
Why sophisticated risk analytics are more important than ever
In Q2 2025 alone, hedge fund asset inflows reached $24.8 billion¹, marking the largest quarterly inflow since 2014, but this capital isn't being distributed evenly. It's flowing to managers who can answer the hard questions about risk.
Sophisticated allocators evaluate managers through a risk lens first, seeking partners who can provide granular transparency into portfolio construction, factor exposures, and downside protection. The opportunity is huge but also straightforward: demonstrate granular risk transparency, robust governance, and institutional-grade infrastructure or watch capital flow to another fund.
How do I assess my portfolio risk management system?
The Key Risk Indicator assessment below helps you evaluate whether you have the necessary analytics across four crucial areas and to discover the specific gaps that could limit your ability to attract institutional capital. Rate your firm’s capabilities for each question, allowing one point for a ‘yes’ answer.
Part 1: Exposure analytics
Leading managers need to quantify specific positions and identify how well hedged portfolios actually are. Exposure analytics enable managers to compare and aggregate across many hedge funds and being able to isolate and quantify asset class level exposures is key.
- Equity Beta Exposure: Can you simplify equity exposure into beta exposures to give allocators confidence that they are truly paying for alpha?
- 10-year Equivalent: Can you measure interest rate exposure to a familiar asset class to quantify the duration risk being taken?
- Delta Adjusted Notional (Equity/FX/Commodities): Can you account for the leverage of options to understand risks across asset classes?
- Sensitivities (DV01, CS01, Inflation01): Can you offer a clear and intuitive view of key exposures that can be aggregated across multiple sources?
Part 2: Value-at-Risk (VaR)
Value-at-Risk (VaR) provides the unified risk picture allocators need for portfolio construction. Value-At-Risk allows clients to unify risk across asset classes while simultaneously focusing on losses. The most common forecast for VaR is a 1-day 99% confidence level with a 1-year lookback using historical simulation.
- Can you provide a unified risk picture that allows allocators to aggregate exposures across asset classes for portfolio construction?
Part 3: Factor analysis
Allocators increasingly evaluate managers based on factor exposure transparency and diversification quality. Historically, factor analysis has been focused on equity strategies but new models in credit have given fund managers similar tooling in credit. It’s important to be able to demonstrate transparency into your return sources and factor exposures rather than operating on intuition alone.
- Systematic vs. Idiosyncratic Risk Breakdown: Can you prove you're generating alpha from genuine security selection rather than disguised factor bets?
- Industry and Country Attribution: Can you demonstrate conscious sector positioning versus accidental concentration?
- Style Factor Tilts: Can you quantify exposure to Quality, Value, Momentum, volatility or leverage factors?
- Crowding Analysis: Can you hone in on crowding factors to protect against diving into crowded hedge fund favorites and short squeeze candidates?
Part 4: Stress testing
Ultimate diversification comes from the ability for portfolio positioning to withstand losses during extreme market events. Stress testing allows firms to find blind spots in their current positioning while also testing resiliency.
- Historical Scenario Analysis: Can you run historical stress tests like the Lehman Crisis and Covid to quantify the downside protection offered through real market crises?
- Predictive Stress Tests: Can you run forward-looking scenarios to see the impact events such as increases in inflation have across asset classes?
- Laddering parameter: Can you find breakpoints by applying incremental shocks (e.g., equity markets from extreme negative to extreme positive) to assess portfolio behavior?
- Can you perform such analysis in two dimensions as shown below (e.g., equity and volatility or interest rates and credit spreads)?
Chart 1: Interest Rate Shocks (Bps-X) vs Portfolio Returns (%-Y)
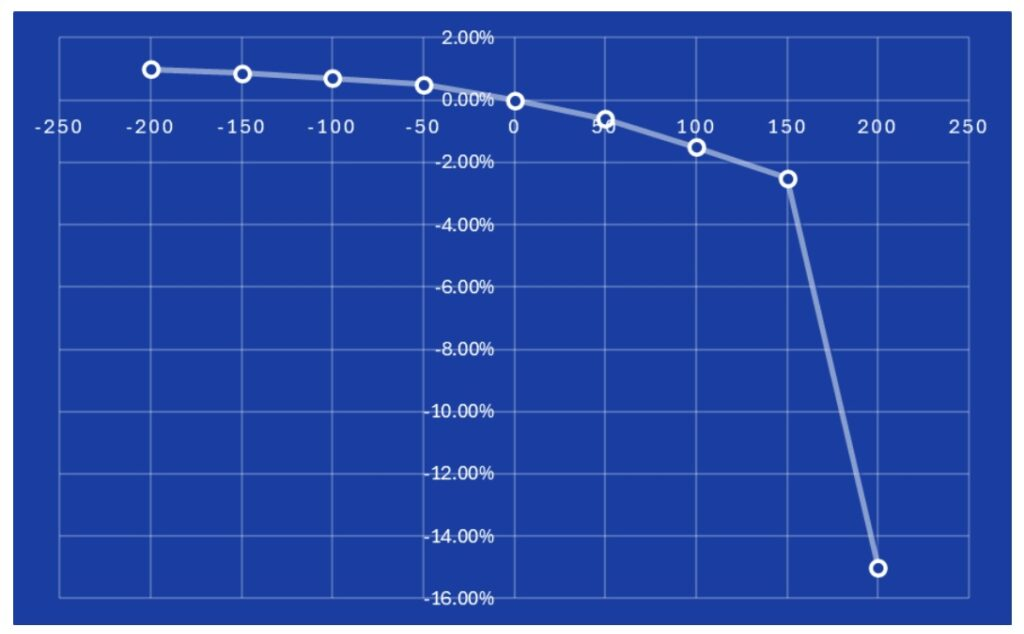
Source: Axioma Risk
The chart above demonstrates how applying a range of stress tests enables managers to identify key inflection points in their portfolio.
Chart 2: Equity vs Volatility Stress Grid
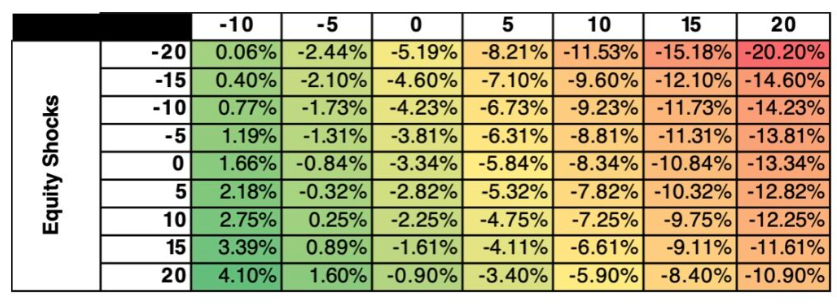
Source: Axioma Risk
The chart above goes a step further and looks at a two-dimensional range of equity and volatility shocks for an options portfolio. You can clearly see that the portfolio is quite susceptible to poor performance when equities are down and volatility is up.
How sophisticated is your risk platform?
- Basic: 0-3 points: Critical gaps exist that may limit institutional investor confidence
- Developing: 4-7 points: Foundational capabilities in place but significant room for improvement
- Established: 8-10 points: Competitive risk analytics approaching the gold standard
- Leading: 11-13 points: Leading risk capabilities that provide true competitive advantage
So what is the best risk management system?
The best risk management system is one with granular, flexible analytics to meet the needs of your current strategy but built on cloud-native technology to meet your future needs. If your assessment revealed gaps in any of these four critical areas, the question is: how can you elevate risk governance and transparency to investors?
Delivering this level of risk transparency requires institutional-grade technology. Manual processes and basic spreadsheet analysis cannot provide the real-time, multi-dimensional risk insights that sophisticated allocators demand. If your current risk system is unable handle asset-specific risk measures with a top-down or full revaluation approach, you may need to reassess.
To learn more about how to improve your risk analytics, learn more about Axioma Risk.
Related Content