How stress tests predicted the Liberation Day tariff response

Author
Christoph Schon, Investment Decision Research, SimCorp
As markets recover from the tariff selloffs, investors might ask: Could we have foreseen what happened?
Revisiting our trade war stress tests from last year, we find that the answer is: Yes.
In our blog post Stressed out about a new trade war? from early December, we used four periods of heightened trade tensions during Donald Trump’s first presidency in 2018 and 2019 to calibrate a range of transitive scenarios in our Axioma Risk platform. Each stress test modeled the impact of a 10% downward shock in US share prices on a range of regional stock markets, debt instruments, and exchange rates against the US dollar.
In this article, we review what the model predicted back then and compare it to what actually happened when the first round of tariffs was announced at the end of February and after the so-called “Liberation Day” in early April.
Market responses to tariffs: past and present
Figure 1 shows the total return timeseries of the STOXX® USA 900 index and the 10-year US Treasury in 2018 and 2019 on the left and since late 2021 on the right. At first glance, the recent market reaction looks similar to what we observed in past episodes of trade tensions, with share prices and bond yields dropping in unison, as investors moved their funds into the relative safety of government debt. But the stock market selloff was a lot more severe this time around. While share prices plummeted between 3% and 7% seven years ago, the latest tariff announcements were each followed by losses of more than 10%, resulting in a total drawdown of almost 20%.
Figure 1. US share prices versus Treasury yields
.png)
Sources: ISS STOXX, SimCorp
The other notable difference in the current environment is the more subdued reaction of the bond market. In the first Trump presidency, share prices and Treasury yields were firmly positively correlated, meaning that the two asset classes moved in opposite directions, with gains in one usually dampening losses in the other. But recently, long-term borrowing costs have been trapped in a tight range by the opposing forces of tariff-induced inflationary pressures and increased fiscal spending on one side and economic growth concerns on the other. At the short end of the curve, the same conundrum leaves the Federal Reserve trapped in a state of indecisiveness.
How accurate were the stress test predictions?
In our original stress tests, we assumed a US stock market drop of 10%, which was bigger than each of the individual (tariff-related) selloffs in 2018 and 2019, but turned out fairly accurate for the latest events. Figure 2 shows a comparison of predicted US equity sector and country returns from our December stress tests in blue and the realized returns from the two recent selloffs in March and April in red.
Figure 2. Simulated and actual equity returns by US sector and country
.png)
Source: Axioma Risk, SimCorp
Actual US equity sector performance was largely in line with predictions, with cyclical sectors, such as information technology, communication services, and consumer discretionary, underperforming defensive industries like utilities, consumer staples, and health care. Autos & parts are shown separately even though they are part of consumer discretionary to highlight the severe impact of trade barriers on those companies, which rely heavily on cross-border flows. Losses in the energy sector in April this year were exacerbated by a sharp drop in oil prices amid rising fears of the potential economic damage from the steep tariffs that were announced on “Liberation Day.” Real estate also performed worse than in the past, as the sector could not benefit from lower interest rates this time.

Webinar
Market & Investment Risk Insights Webinar (MAC)
How shifting US policies are reshaping multi-asset risk and changing investor strategies globally
REGISTER HEREThe sector returns were also mirrored by country performances. Automobile powerhouses like Germany, Italy, and Japan suffered more than other countries, especially after the announcement of 25% import levies on cars at the beginning of April. Italy, with its large energy sector, got an additional blow from the aforementioned fall in oil prices. Switzerland and the UK with their large pharmaceutical companies performed slightly better in the historical scenarios and the first tariff round this year, when medical supplies were still exempt from import levies.
What is different this time?
One thing the model could not have foreseen, were the infrastructure and defense investment plans announced by the German government in March this year, which boosted the country’s industrial sector and its stock market as a whole. The general increase in military spending on the continent, coupled with a loss of confidence in the United States, also boosted European currencies at the expense of their American rival, which showed much greater losses in March than the model had predicted. But the Norwegian krone and the British pound gave up some of their gains again when oil prices fell in April. The Swiss franc and the Japanese yen benefited in all five scenarios, reaffirming their status as safe havens.
Figure 3. Simulated and actual currency and bond market returns
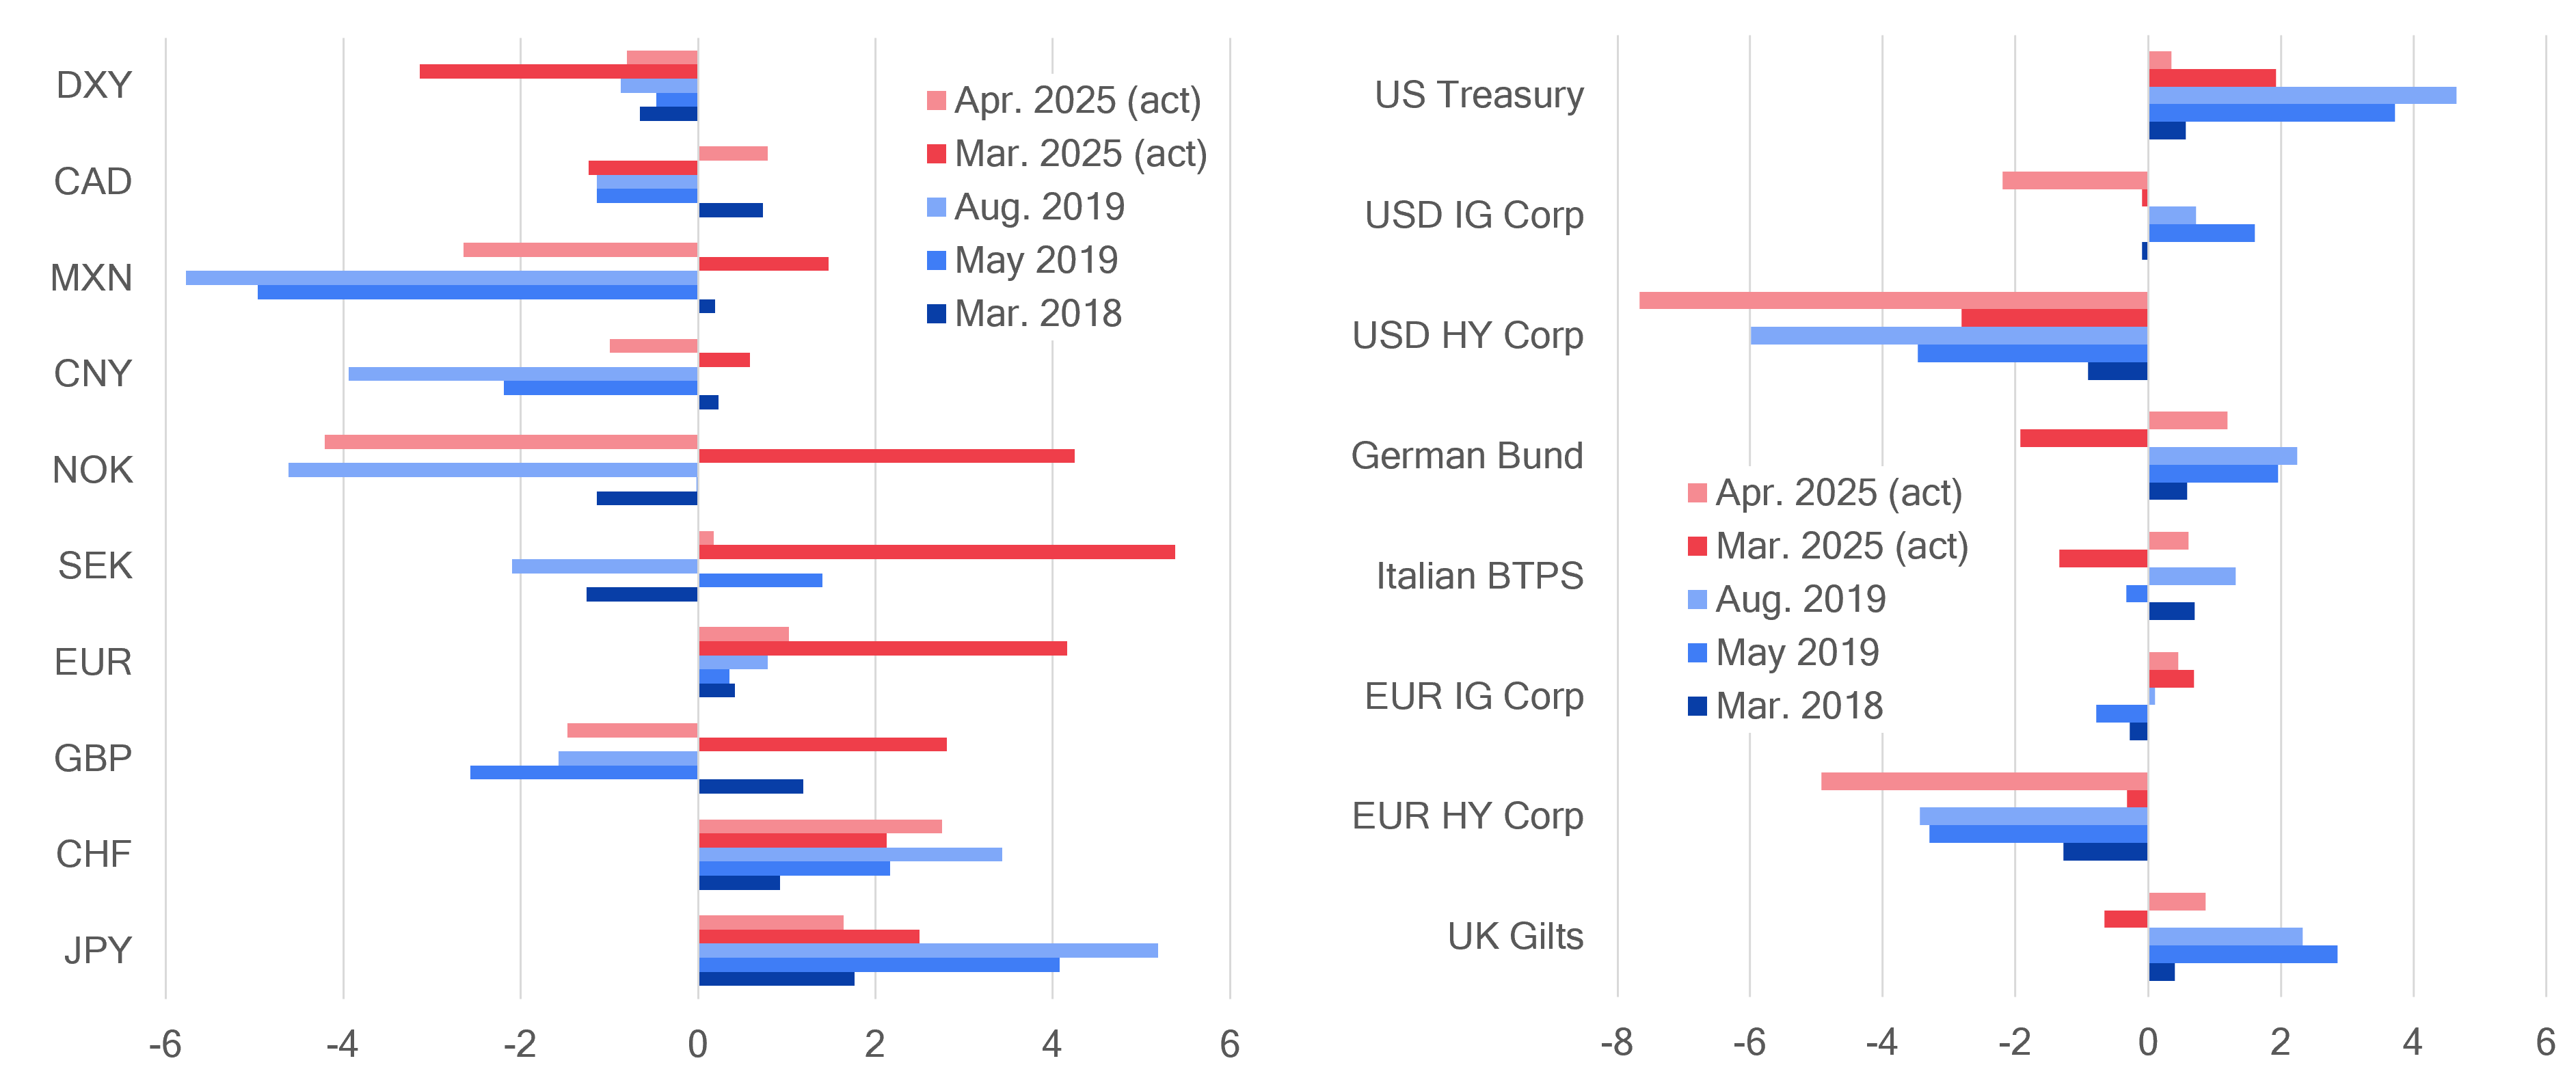
Sources: Axioma Risk, SimCorp
In order to finance the increased spending on national security, the German government partly relaxed its strict debt rules — the so-called “debt brake” — which resulted in higher yields and accompanying losses for European government bonds in the March 2025 scenario. But they soon recovered much of their value in April, when investors extracted their funds from the American stock market and transferred them into European sovereign debt, bypassing US Treasury securities on the way.
Where can diversification come from?
The fact that Treasury bonds were no longer regarded the safe haven of choice was one of the biggest differences between what happened in 2018/19 and the recent market environment. Much of that can probably be attributed to the increasing budget concerns sparked by the “big, beautiful bill.” Another noteworthy observation is that regions targeted by import levies showed smaller drawdowns than the US stock market itself. This underpins the warnings from industry leaders and economists that it will be American companies and consumers who will pay the ultimate price for Donald Trump’s protectionist policies.
So, with US stocks, bonds, and dollar all selling off together, where can investors find diversification? Much of the funds that left the American stock market seemed to have flown to Europe, boosting the region’s currencies, bonds, and stock markets. The yen also showed consistent positive returns in all scenarios. And even for those investors who cannot or do not want to abandon the American stock market altogether, defensive sectors like utilities, consumer staples, and health care, have shown steady resilience.
Prepare for the next market downturn
The US stock market may have recouped much of the most recent losses, as tariffs were suspended or (partly) reverted, but as our stress tests highlight, any new round of trade barriers will likely be met with renewed selloffs. But even if the next downturn seems inevitable, scenario analysis like the one shown in this article can at least help investors prepare for it by highlighting which parts of the portfolio are most vulnerable and what strategies can be put in place to somewhat soften the blow.