

How AI uncovers factors that may signal market peaks
Author
Melissa R. Brown, CFA¹
Global Head of Investment Decision Research
SimCorp
When markets near a top, style factor returns leave measurable traces. Analyzing factor performance prior to 15 peaks since 1982, Axioma by SimCorp and EDS found that Medium-Term Momentum and Liquidity consistently produce positive returns that are higher than their own averages in the lead-up, while Downside Risk and Dividend Yield deteriorate. AI analysis compressed months of research into minutes.
Momentum and Liquidity cometh before the fall
While many investors use style factors as an alpha source or a way to manage risk, factor returns can also provide a window into how investor behavior translates into investor sentiment. In fact, factor returns provide the basis for Axioma’s ROOF (Risk-on, Risk-off) scores.
This look into how investors feel, combined with the market’s successive highs, prompted a question: Can style factor returns predict whether we are nearing a peak? Simple enough question, but one that requires a lot of data and extensive research to determine an answer.
Axioma and EDS teamed up for this research effort. We combined Axioma’s risk model style factors with EDS’s AI engine and were able to conduct the research quickly, while reaching a more definitive conclusion than we expected. We found that certain style factors2, most notably Medium-Term Momentum and Liquidity, exhibit consistent behavior as the overall market nears a peak. While timing the market is always difficult, (even the AI notes that the findings are not necessarily timing signals), having this knowledge combined with other data points may help identify market tops.
What AI revealed from 40 years of factor data
In this study, we asked EDS’s AI engine to examine returns for 19 style factors around 15 market peaks going back to the model’s inception in 1982. We measured returns 60-, 20- and five-days prior to the known market tops to see, first, if returns were meaningfully different from their usual patterns in any of these periods and, second, whether we could find acceleration or deceleration in returns as we got closer to the peak.
The output identified a few factors that showed consistent returns across 15 market peaks, and the AI provided nuanced analysis and associated intuition, enhancing the usual output that just reviews what happened.
Certain factors typically leave measurable fingerprints:
- Two durable signals are consistently positive, with an above-average magnitude of return: Medium-Term Momentum and Liquidity.
- Downside Risk (which is expected to be negative) and Dividend Yield (which offers no long-term risk premium) both exhibit increasingly negative returns pre-peak.
- Short-Term Momentum returns were highly negative pre-peak, but that signal seems to have faded.
From this analysis we conclude that the market is increasingly sorting winners from losers even as it continues to rise.
Medium-Term Momentum provided the most robust signal, with a positive return in the 60 days leading up to 13 of the 15 peaks3, and with pre-peak 60-day returns that were substantially higher than average. 20- and five-day returns prior to the market peak were positive in 11 and nine of the 15 periods respectively, and the average pre-peak return was also substantially higher than the overall average return for those time spans. The AI engine suggests that “This makes intuitive sense: market peaks are the culmination of a trend, and the stocks that drove it are still being rewarded as the index makes its final high.”
Liquidity’s 60-day return was positive before 12 of 15 peaks (80%), and both 20 and five-day pre-peak returns were positive in 11. Like Medium-Term Momentum, the average for each pre-peak period was more than double that of the overall average. The AI’s take on this, which we found to be quite intuitive is that “Liquid, easy-to-trade stocks outperform heading into tops. This reads as institutional positioning, large holders quietly rotate toward names they can exit cleanly. It’s not a panic signal; it’s a preparation signal”.
While Momentum and Liquidity surged as the market approached a peak, Downside Risk and Dividend Yield returns got progressively more negative as the peak neared. Growth and Profitability returns also became more positive. The AI’s take, which makes a lot of sense to us: The market is actively sorting winners from losers in the final weeks, even while the index looks calm.
— Melissa Brown CFA, Global Head of Investment Decision Research, SimCorp
How is this?
Short-Term Momentum, sometimes called reversal, produced negative returns prior to 10 of the 11 peaks between 1982 and 2018. However, consistent with the overall fading of the predictive power of this factor, the return was actually positive prior to three of the last four tops. While we generally maintain our faith that factors with consistent long-term track records will eventually return to that performance, we do have to question that faith on occasion. This factor could go back to producing highly negative returns as it did for at least 30 years. On the one hand, markets have changed significantly over the past 44 years, not least due to the growth of passive investing. It's possible this factor's best days are behind it. On the other hand, the current tendency for investors to “buy the dip” could bring it back into favor.
Pulling daily factor returns, building a 60-day window, cumulating, and ranking the result against the historical distribution used to be a morning's work for a quant. With the AI overlay it's a sentence and an answer. The shift isn't just time saved, it's that portfolio managers start asking the questions they used to skip because the friction was too high.
— Ben Lieblich, Chief Data Scientist, EDS
The dot-com peak was unique
One peak where Medium-Term Momentum did not provide the signal we note above (and produced the most negative pre-peak 60-day return) was the bursting of the dot-com bubble that culminated in March 2000. Although we are experiencing a comparable technology-driven boom in today’s market, we note that 1) Momentum has been strong for many months, but 2) has fallen off recently. So, do we reject the hypothesis that we’re near a peak because Momentum has decelerated, or assume this market is more like the one in 2000? Of course, time will tell but given that history can repeat itself in different ways, we are cautious to be complacent about the Medium-Term Momentum signal entirely as it once again could be providing a last burst of performance that we will find “cameth before the fall”.
AI’s take is that “the patterns that persist are better suited for characterizing market regimes than for timing".
The fingerprints were always in the data
Each market peak has unique characteristics. Some are driven by economic considerations, some are more technical in nature. Timing them exactly, or even approximately, is exceedingly difficult. However, investor behavior as identified by factor returns can help investors position portfolios and reduce risk, to limit the impact of the market downturn.
Axioma’s models provided more than 40 years of style factor data that could be analyzed in great detail. The models are tested extensively and widely used. Without that data integrity, we could not trust the answers produced by AI.
The value that EDS’s AI capabilities brought to the analysis is immense. To answer the same questions could potentially have taken days or weeks of an analyst’s time, and even with that many of the nuances could have been missed. EDS posed the question to AI with minimal prompting, and got structured results in minutes, enabling iterations in the analysis that would have delayed traditional research. The benefit of having actual model output, not more generalized training data, further enhanced the integrity of the output.
Neither Axioma by SimCorp nor EDS could have achieved this alone, at least not without extensive research time spent. It was the combination of a solid, effective risk model and a highly capable AI engine that allowed for this quick and thorough analysis. The constraint on producing high quality research shifted from can we do this to what do we want to ask.
The fingerprints were always in the data. The significant enhancement is in how long it used to take to find them, and what becomes possible when a 40-year analysis takes minutes, not months with an AI-enhanced partnership.
Footnotes
1 Ben Lieblich of EDS was instrumental in conducting this research
2 Using the Axioma US 5.1 trading horizon model
3 Measured from (peak – 60 days) to (peak – 1 day)
Appendix: Medium-Term Momentum and Liquidity Performance
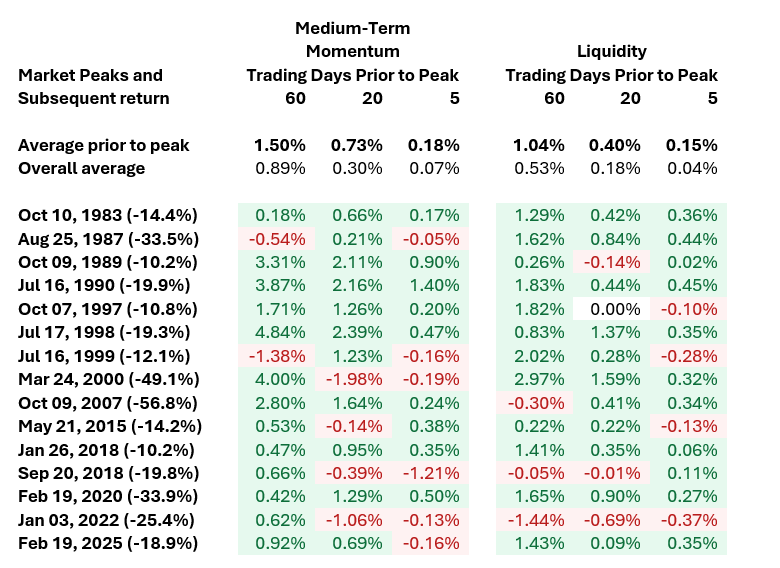
Note: Returns are based on the Axioma US Trading Horizon fundamental model (USTH5.1). They are measured from peak – (60, 20, 5) days to peak – 1 day. “Average prior to peak” means the average of the return leading up to the peak in the table rows. “Overall average” indicates the average 60, 20 and 5 day returns for the full period starting in January 1982. Data for other factors is available on request.