

Revisiting September is (often) the weakest month for US market returns
Author:

Two years ago, we looked at how US market returns in September differ from those in other months. Here is that original report. We now have two more Septembers under our belt, and in both the market had a positive return, so it seemed worthwhile to revisit our findings.
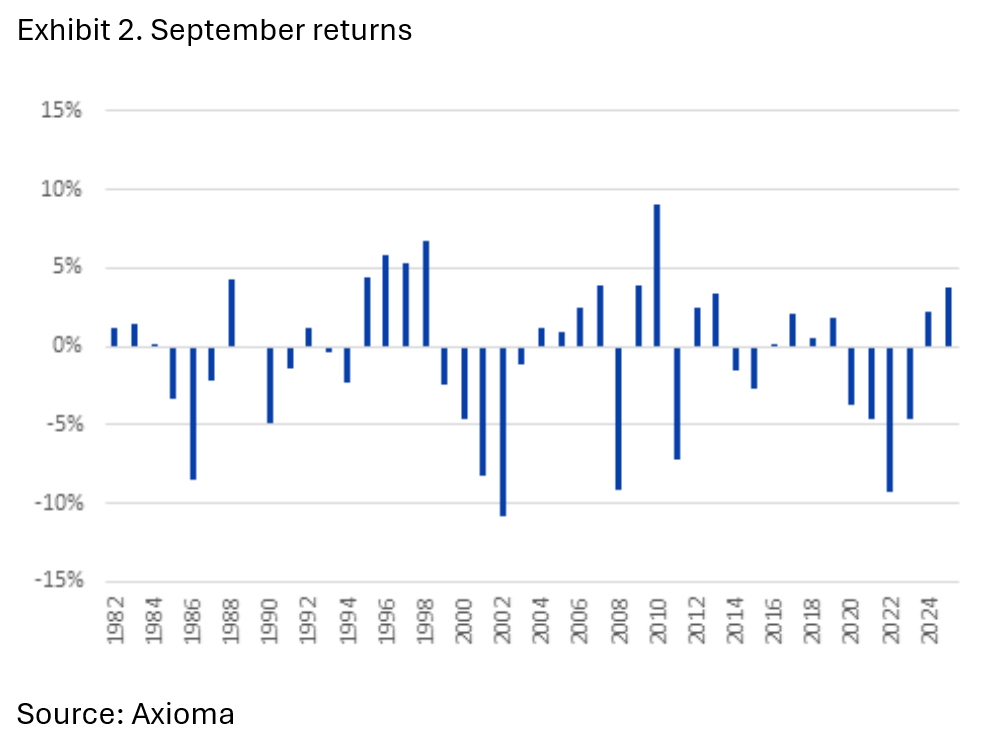
We now have almost 45 years of monthly returns using the Axioma United States Core Market Portfolio, a large-mid cap benchmark that contains 550-600 names and is weighted by market capitalization. Although the pattern didn’t hold in 2024 and 2025 our conclusions still stand – September is the weakest month for the US market. However, results vary enough year by year that investors shouldn’t be misled by the statistics and assume they should sell.
Is September the cruelest month?
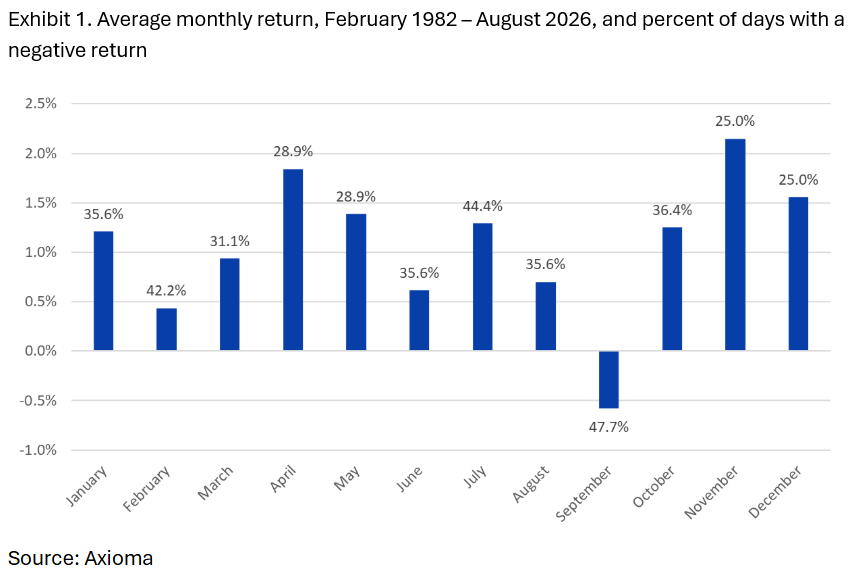
- With an average loss of 58 basis points, September has the lowest average monthly return of all 12 months of the year.
- At 0.09 percent the median September return for the 44 years since 1982 is slightly positive, although it is more than half a percent less than the next-lowest median, June’s +62 basis points.
- September is the only month in which the average return is negative.
- A Welch’s t-test for September returns versus all other months pooled is significant with p=0.02. However, once we adjust for the risk of false positives from multiple comparisons, a t-test of September versus each individual month is not statistically significant.
- The market return has been negative in 47.7 percent of Septembers, as compared with an overall average of 34.7 percent of months.
- The worst month in history, when the market was down 20.9 percent, was not in September, rather it was October 1987.
- When looking at daily returns we find that September, on average, sees 49.1 percent of days with negative returns, whereas about 46 percent of days are negative in all other months (and 46.3 percent of days when September is included). The difference in the number of days that are negative in September vs. all other months is significant at the 8 percent level. While this is higher than the usual threshold for being statistically significant, it is close.
- The negative performance is concentrated in the second half of September, when the return averages less than -1 percent, compared with +0.26 percent from the first of the month to the 14th. And days in the first half are also slightly less likely to be down than the overall average – 44.4 percent, whereas almost 53 percent of the days at the back end of the month see a falling market.
Why is September, particularly the second half of the month, so much worse for the stock market than other months? It could be mutual fund tax selling before the end of the funds’ fiscal years, locking in returns from earlier in the year (which seems less likely since there is a positive correlation between January – August returns and September returns), or perhaps a seasonal mood effect linked to shorter days and colder weather (while this analysis is limited to the US, it seems to be a global phenomenon). Some suggest it could just be a result of investors returning from summer vacation and paying renewed attention to their portfolios and selling. It’s also possible the pattern simply reflects statistical noise rather than a true seasonal effect.
The odds favor a downturn in September, especially in the second half, but it is by no means a foregone conclusion, and therefore does not constitute a strong sell signal. Investors currently concerned about what might happen to their investments in the next few weeks should ensure they are well-diversified and comfortable with the risk they are taking. Of course, that is always good advice.
You may also like


