
EQUITY RISK MONITOR HIGHLIGHTS
WEEK ENDED AUGUST 15, 2025
- Global Indexes Rise with the US Leading the Way
- US Markets Total Risk Falls Due to Decreased Style Factor Risk
- Style Factor Risk in Global Markets Is Also Lower, but Total Risk Is Steady
Global Indexes Rise with the US Leading the Way
Last week, the S&P 500 closed at record highs for three consecutive trading sessions, driven by flat month over month July Consumer Price Index readings, despite CPI actually coming in slightly higher than expected. Additionally, the Producer Price Index reported later in the week rose 0.9% in July—0.7% above economists’ expectations. Nonetheless, the market focused on CPI and priced in a higher chance of a Fed Rate cut in September, with the implied probability of a cut peaking at 94.3% on Wednesday, August 13th according to the CME.
For the second consecutive week, the STOXX® US, STOXX® US Small Cap, STOXX® Developed World Indices, STOXX® International Developed Markets, STOXX® Europe 600, STOXX® Japan, STOXX® Asia ex-Japan, and STOXX® China A all posted gains, with all but the STOXX US posting a weekly gain of at least 1%.
US Markets Total Risk Falls Due to Decreased Style Factor Risk
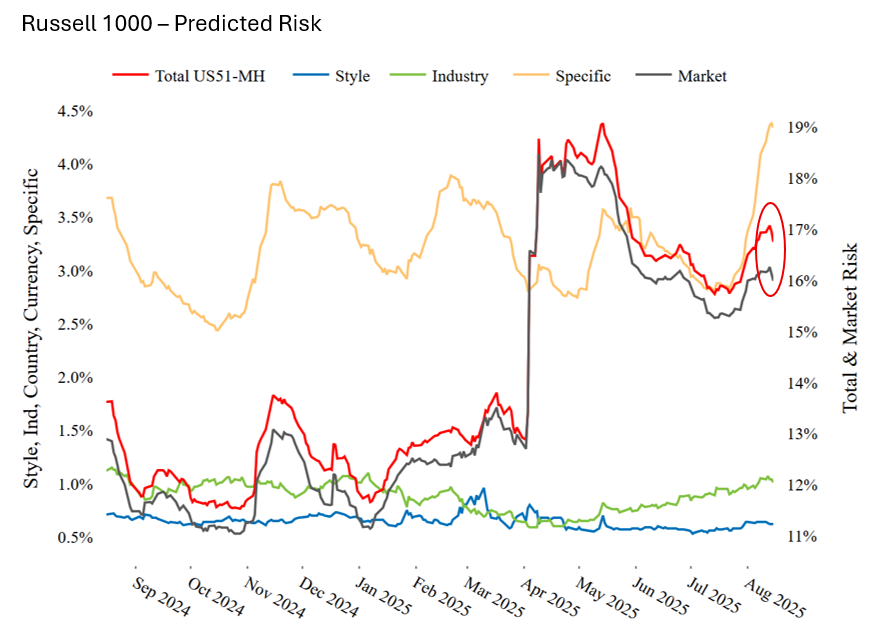
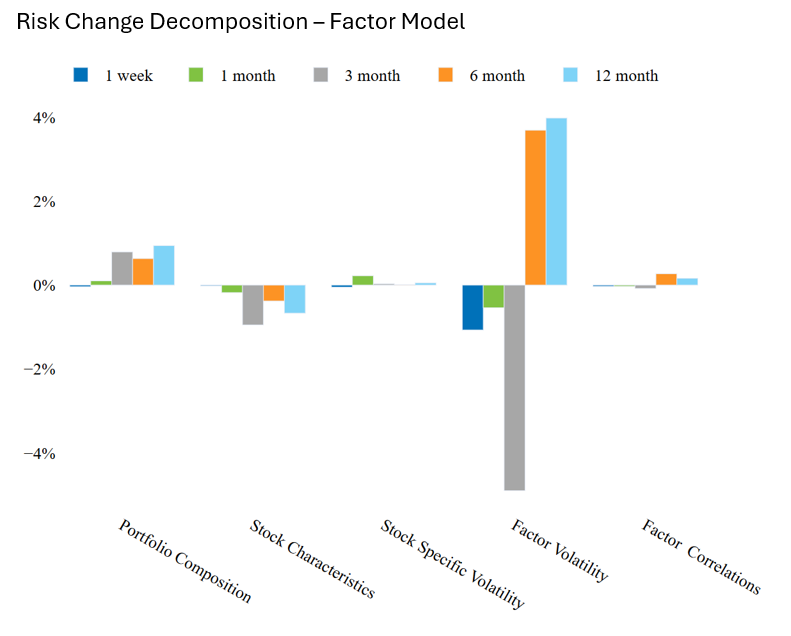
As measured by the Axioma US5.1 Risk Model, Total Risk for the Russell 1000 decreased week over week for the first time since July 11th. Until last week, consistent increases in both Specific Risk and Style Factor Risk drove Total Risk higher, but since August 8th, the directional change in Total Risk came from recent decreases in Market, Industry, and Style Factor Risk. Of the three components, Market Risk contributed most to Total Risk, but those focused on the Active Risk of their portfolios will be interested in diving into Style Factor Risk more deeply.
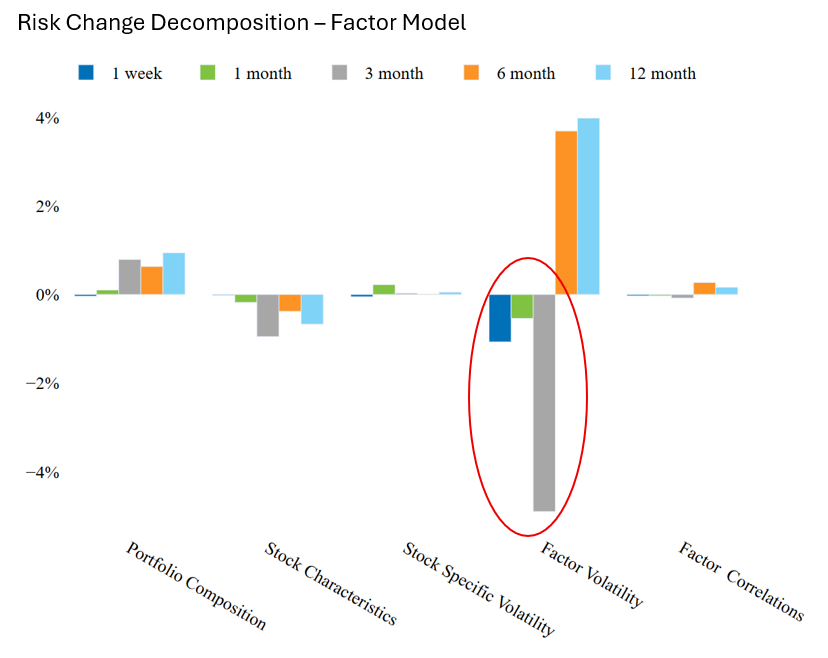
Factor Correlations have remained flat over the measured period, while the change in Factor Volatility has flipped from strongly positive in the 6 month and 12 month periods to strongly negative over the past 3 months (i.e. one month after the start of Trump’s Tariff posturing).
See chart from the Russell 1000 – US5.1 Equity Risk Monitor as of August 15, 2025
See chart from the Russell 1000 – US5.1 Equity Risk Monitor as of August 15, 2025
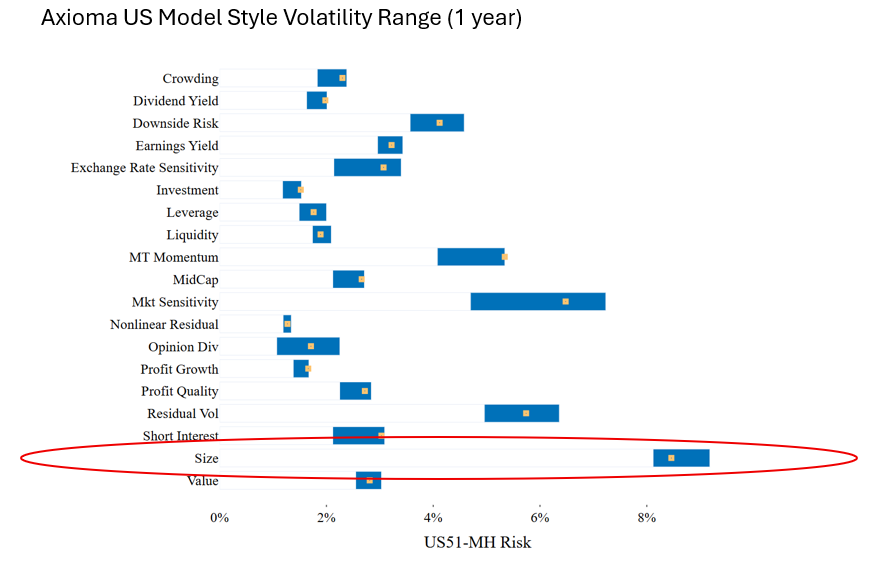
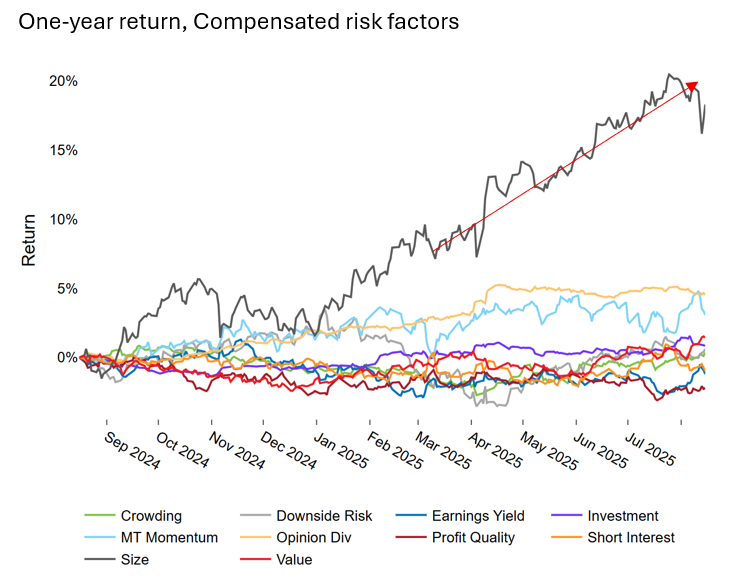
However, taking a look at the individual style factor’s volatility, only one is noticeably below its median level over the past year: Size. Considering that Size is the highest volatility factor overall, a decrease in its volatility seems to have offset any gains in the other style factors. Stories of the US market this year have been dominated by a focus on mega-cap technology stocks, and our Size factor return has similarly outsized returns among our “Compensated” Style Factors. Thus, managers with Size tilts might observe a fall in Active Risk, even in the absence of rebalancing, but that decrease may have been offset by higher risk from other factors. Now could be a good opportunity to take note of the underlying risk decomposition of your portfolio.
See chart from the Russell 1000 – US5.1 Equity Risk Monitor as of August 15, 2025
See chart from the Russell 1000 – US5.1 Equity Risk Monitor as of August 15, 2025
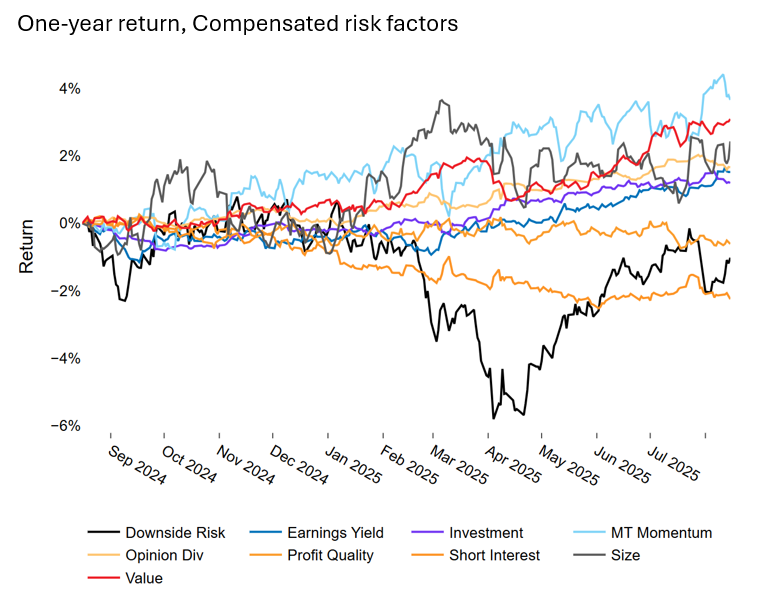
Style Factor Risk in Global Markets Is Also Lower But With Less Effect Overall
Turning now to the WW5.1 model in Developed Markets, Style Factor risk and returns are more evenly distributed, with Downsize Risk and Market Sensitivity exhibiting similar volatility to the Size factor. Compared to the US, Size volatility in this model is also below the median over the past year, but it is not the only factor in this range—Earnings Yield is near its one year low, though it also has much lower risk than Size overall. Looking at returns, both Medium Term Momentum and Value have outperformed Size over the last year among Compensated Risk Factors, though we should note that the magnitudes of the returns are much lower than the top performing factors in US.
Still, as in the US, the WW5.1 model is showing decreased Factor Volatility readings after a large increase over the 6 month time frame, but these changes are smaller overall. Perhaps for this reason, the decreased Factor Volatility is not meaningfully decreasing the model’s overall Style Factor Risk or Total Risk, unlike in the US.
See chart from the STOXX Developed World – WW5.1 Equity Risk Monitor as of August 15, 2025
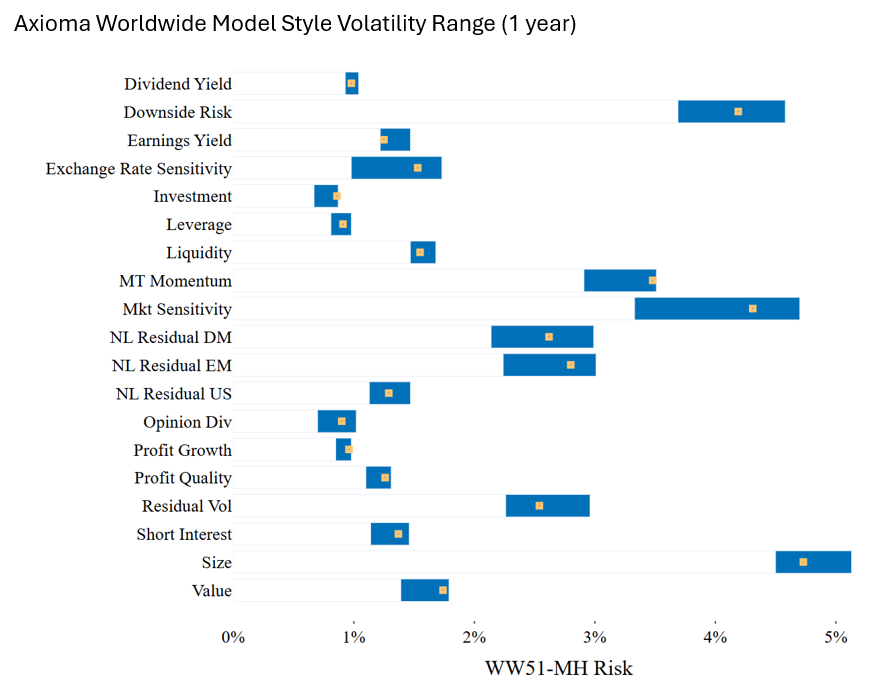
See chart from the STOXX Developed World – WW5.1 Equity Risk Monitor as of August 15, 2025
See chart from the STOXX Developed World – WW5.1 Equity Risk Monitor as of August 15, 2025
You may also like


