

EQUITY RISK MONITOR HIGHLIGHTS
WEEK ENDED OCTOBER 24, 2025
Trade tensions between the US and Canada accelerated last week, and we will devote most of this note to the impact on factors driving equity market risk. But first, some comments on the US market “melt-up” we seem to be experiencing.
Divining a market peak
The US market continued to hit new highs daily, seemingly driven by the prospect of the Fed lowering rates, easing of trade tensions with China and the continued appeal of the AI-related trade. Despite many dark clouds, such as high valuations, low consumer and business confidence, still-high inflation (even if slightly lower than forecasted last month) and remaining uncertainty around tariffs, volatility continues to fall. But, if headlines are to be believed, there is also a lot of concern that we are nearing a market peak.
What can performance in advance of prior market peaks tell us? On average, for the six market peaks in the 42 years (more than 11,000 days) since 1982, stocks rose about 6.7% in the 20 days prior to topping out, in contrast to an average 20-day return of 81 basis points during that period. Note that, by definition, the market had been up strongly and for a long time before reaching a top, so this high short-term return can seem like a “last gasp.” Stocks were up an average of 13 of the 20 days leading up to the peak (65%) versus 54% of days with positive returns for the full period. Although this doesn’t mean that stocks only rise that much or that often before reaching a high (they rose more than 6.5% in 20 days about 6% of the time), it does seem to provide a bit of evidence that the market “melts up” just prior to a peak and that can provide a clue as to whether we are closer to a top than to a bottom.
For the current period, these two statistics provide a mixed picture. Through October 24 US stocks are up about 2.3% in the past 20 days, and the comparable-period return was higher than that prior to five of the last 6 peaks. However, stocks have risen in 14 of the past 20 days (70%). Perhaps we haven’t seen the US market peak yet, but we will continue to watch…
Canadian investors become more defensive as trade tensions rise
Trade and tariff discussions between the US and Canada took a decided turn south last week as the Ontario government released an ad defending free trade, raising the ire of the US government enough for President Trump to declare at the end of last week he was ending all trade negotiations with the US’s northern neighbor. Over the weekend, he also announced he would increase existing tariffs on US imports from Canada by 10%.
When examined through the lens of the Axioma risk models, the impact of last week’s imbroglio was relatively muted, although a few risk- and return-related variables stood out.
- While many markets saw substantial gains last week (e.g. increases of 2.5% and 2.3% for the STOXX US and STOXX US Small Cap Indices, respectively, and a gain of 2.1% for STOXX Japan), the Canadian market, as measured by the STOXX Canada Index fell 0.6%.
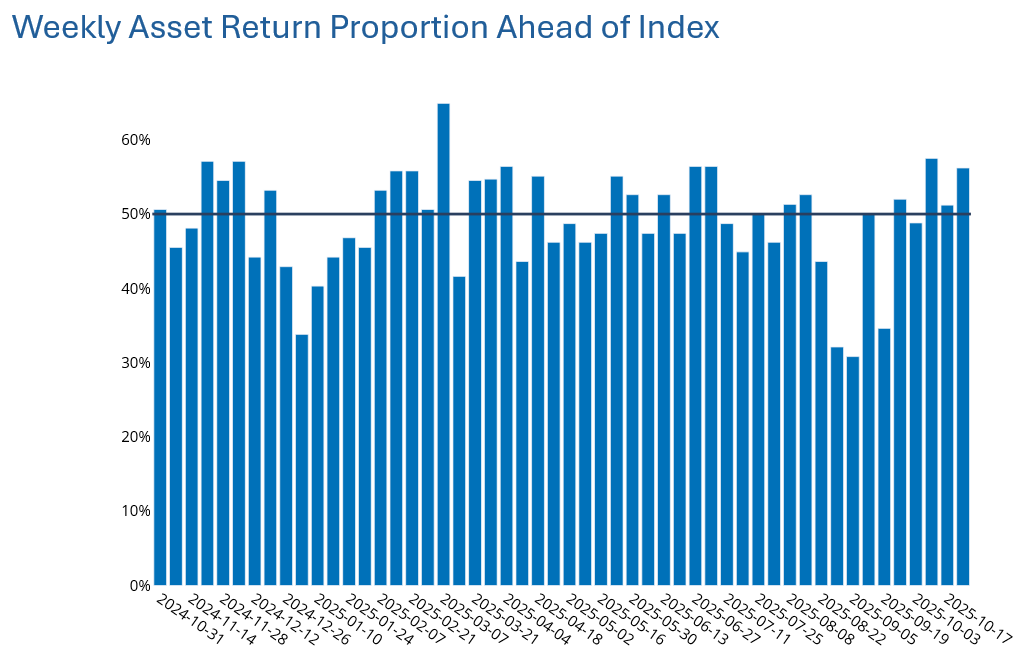
- Although the Canadian market was down last week, a majority of Canadian companies beat the index
See chart from the STOXX Canada Equity Risk Monitor as of October 24, 2025:
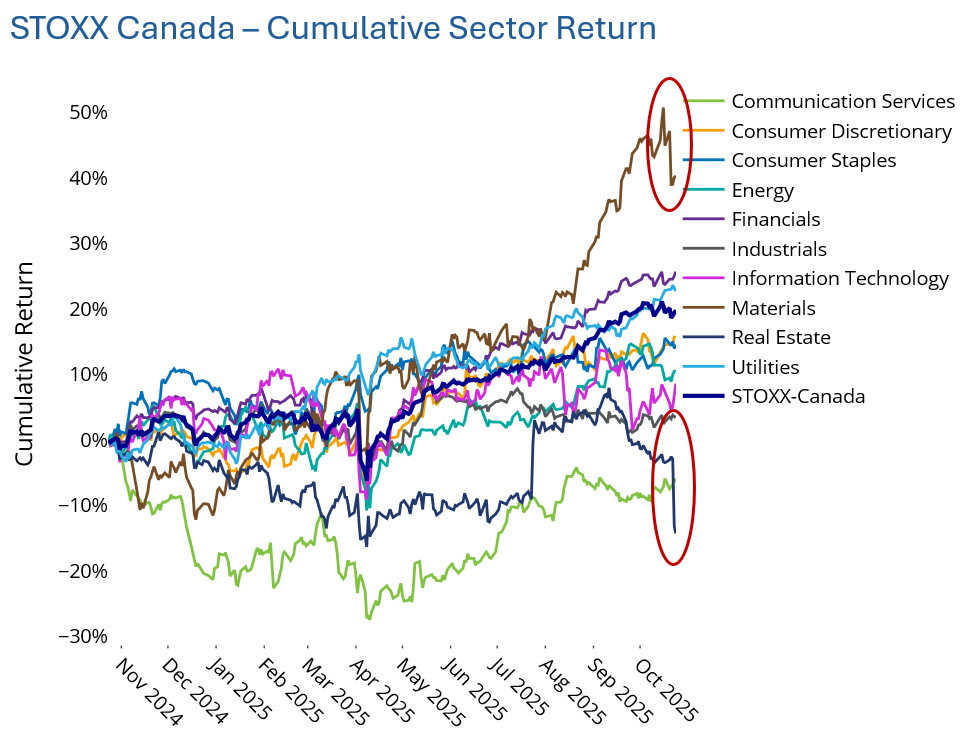
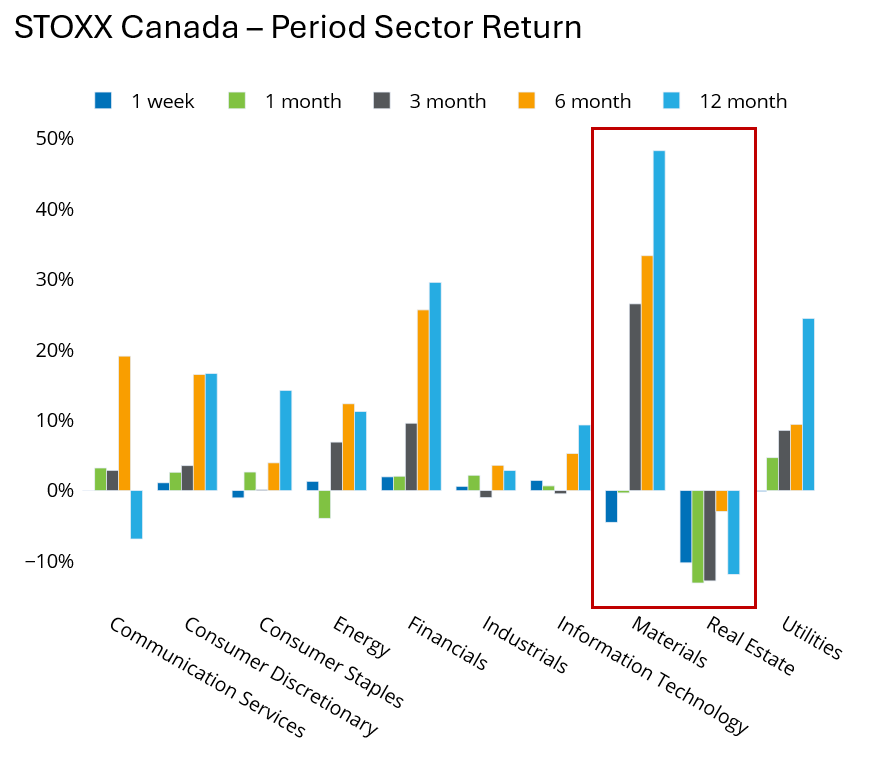
- The sectors most negatively affected were Materials (which remain well ahead of the rest of the sectors in the Canadian index for the past year, 6 months and 3 months) and Real Estate (which has lagged all other sectors but is a tiny proportion of the index). All other Canadian sectors were flat or up last week, despite the threat to the country’s exports.
See chart from the STOXX Canada Equity Risk Monitor as of October 24, 2025:
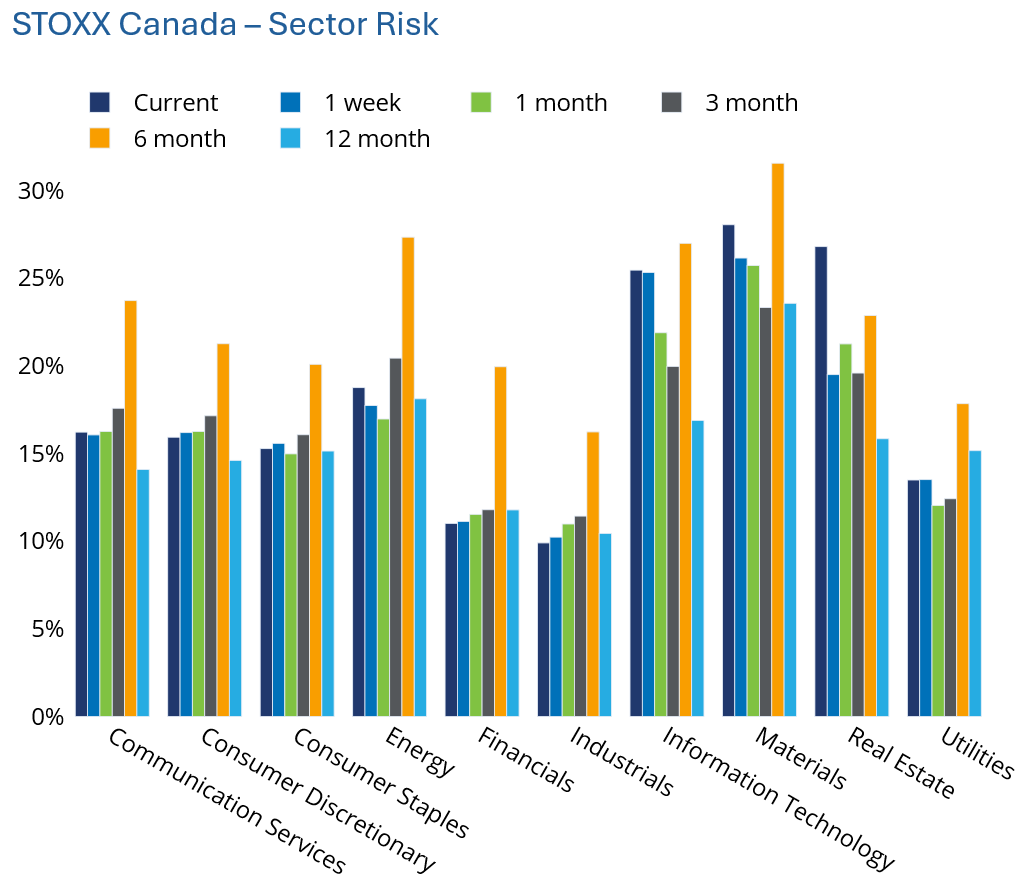
- Predicted risk for both Materials and Real Estate was already ranked, along with Information Technology, the highest of all 10 GICS sectors in Canada. But risk soared more than 37% last week for Real Estate, as measured by the Axioma Canada fundamental short-horizon risk model. We also note single-digit increases (proportional to risk at the end of the prior week) for Energy and Materials, whereas risk fell for several sectors, as well as for the aggregate index, despite the heating up of trade concerns.
See chart from the STOXX Canada Equity Risk Monitor as of October 24, 2025:
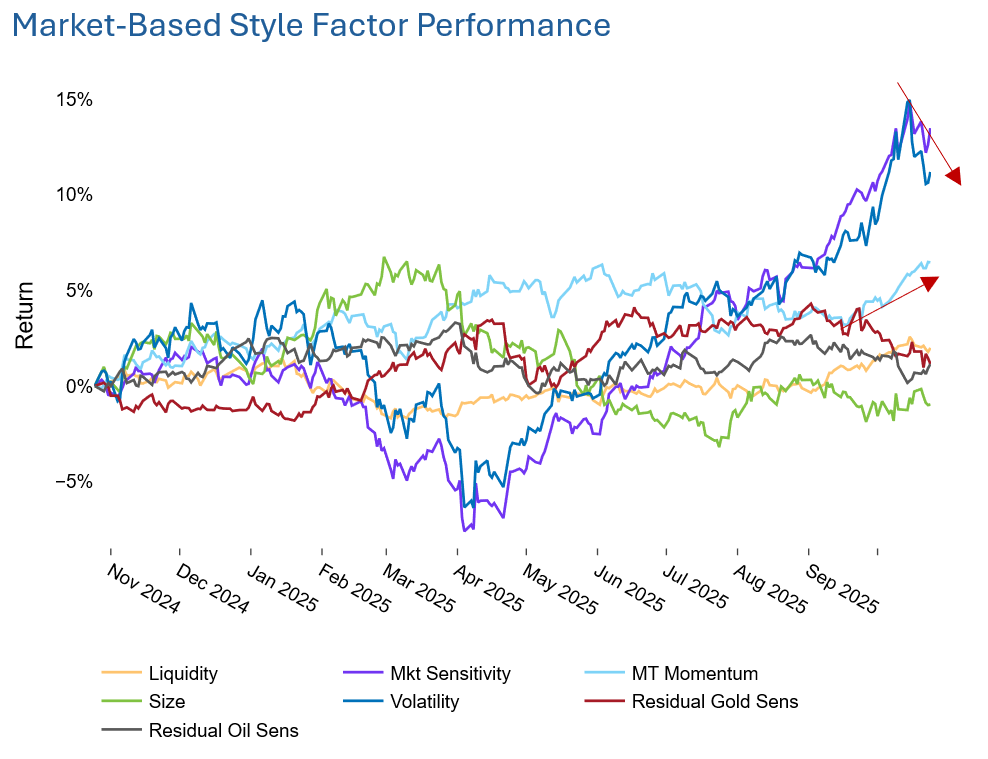
Factor performance also provides an interesting perspective on investor views about the impact of cutting off trade negotiations between the US and Canada. (These returns all occurred before the announcement of the additional 10% tariff.) Medium-Term Momentum’s return was positive, indicating that winners over the prior 12 months continued to be rewarded. This stood in contrast to negative Momentum returns in the US, Europe, and Asia Pacific ex-Japan.
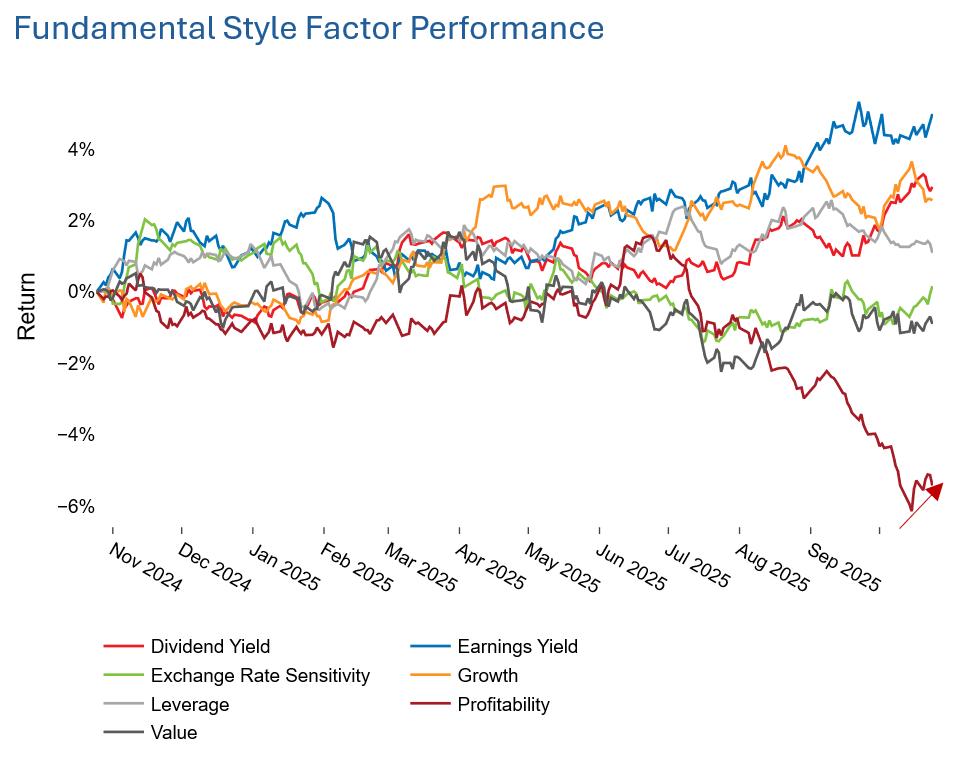
In contrast, performance staged an abrupt about-face for two prominent factors. Profitability’s return, which was substantial and steadily negative for the past three months, turned positive last week, while Volatility— where returns had been on a progressively upward path since “Liberation Day”— reversed course. This suggests that, at least last week, investors in Canada sought safety in lower volatility and more profitable names, whereas they had been more risk-seeking for the past several months.
See chart from the STOXX Canada Equity Risk Monitor as of October 24, 2025:
You may also like


