

EQUITY RISK MONITOR HIGHLIGHTS
WEEK ENDED NOVEMBER 7, 2025
Axioma Risk Monitor: Tech selloff sends shockwaves through major markets; Sentiment decline reflected in style factor reversal; Amid the chaos, signs of strength remain in US equities
Tech selloff sends shockwaves through major markets
Global equity markets declined in the first week of November, led by a tech-driven selloff fueled by mounting concerns over inflated valuations in AI-linked stocks and ongoing uncertainty surrounding Federal Reserve interest rate policy. The rapid surge in AI-related spending, without a corresponding rise in revenues, has sparked fears among investors that the AI boom may be nearing a tipping point. Tech companies also came under pressure as expectations for US interest rate cuts were scaled back.
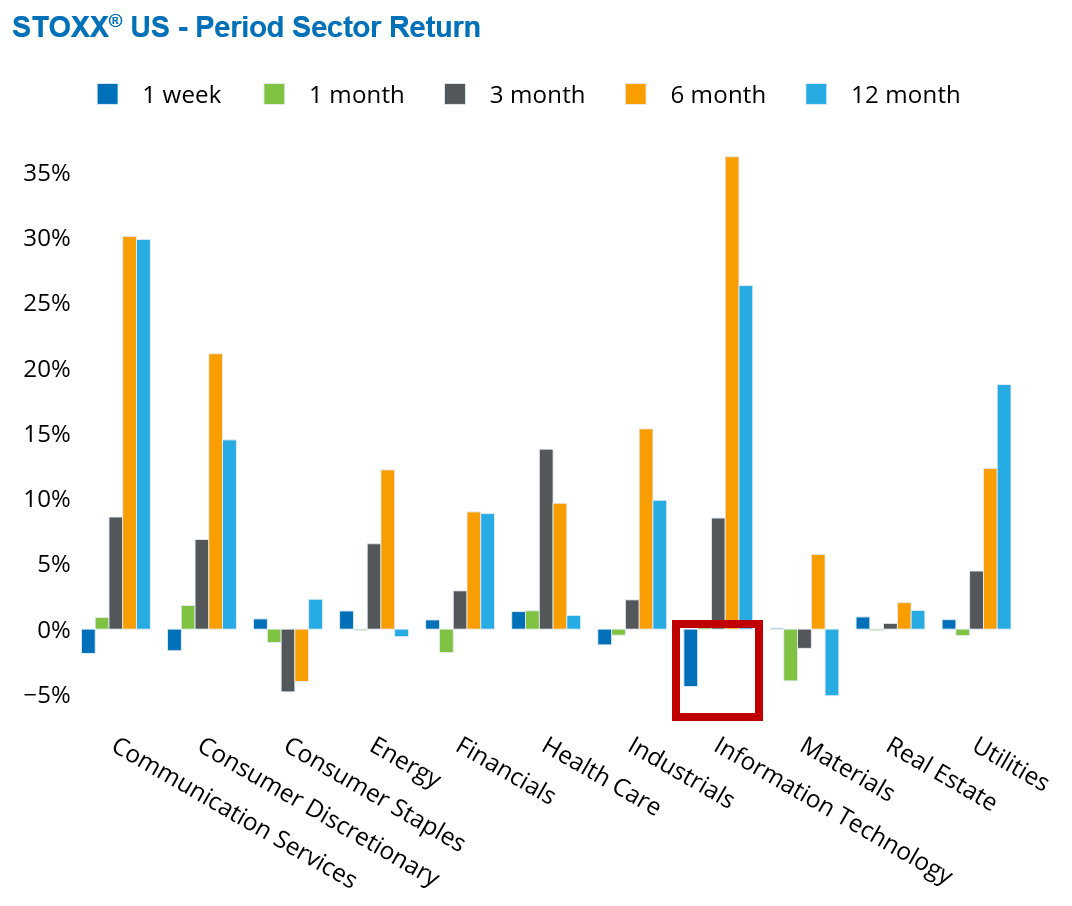
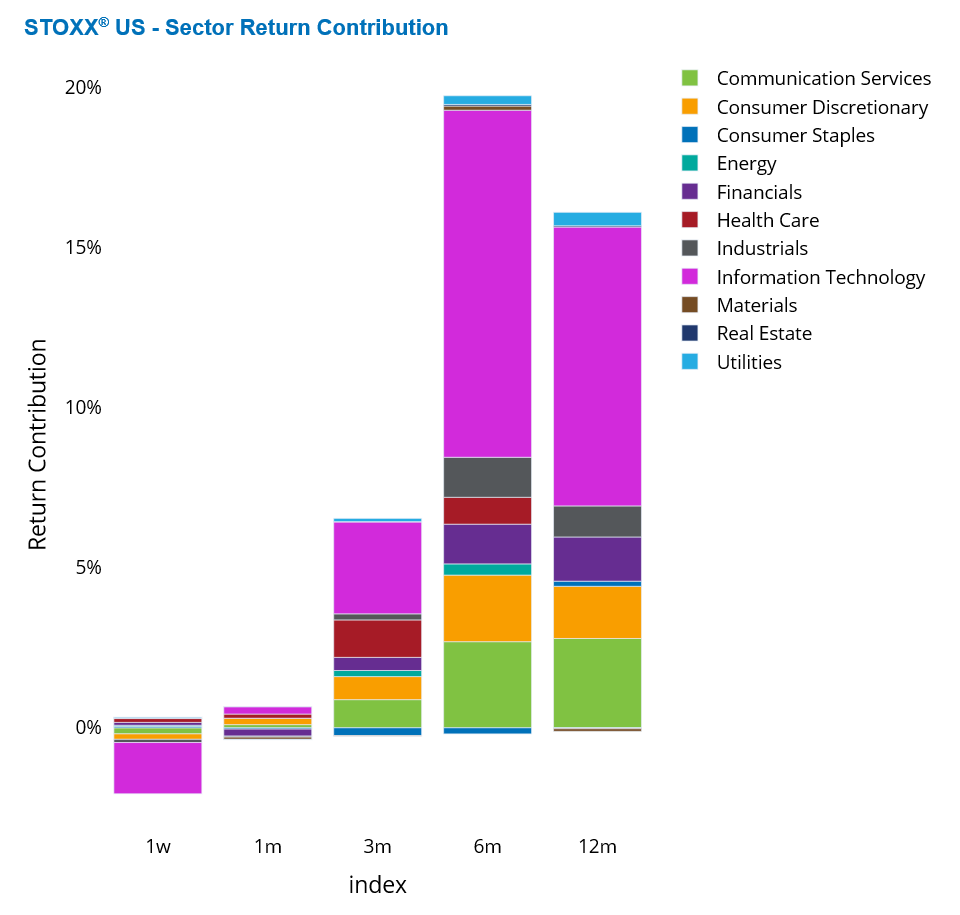
Given that the Information Technology sector accounts for over one-third of the US equity market, the US bore the brunt of the downturn. The STOXX US Index dropped nearly 2%, with the Information Technology sector alone falling 4.4%, contributing 90% of the overall decline.
Importantly, the selloff extended beyond traditional Info Tech stocks to tech-adjacent companies more broadly. The “Magnificent Seven”—Apple, Amazon, Google, Meta, Microsoft, Nvidia, and Tesla—collectively make up a staggering 35% of the US index and were responsible for 65% of its weekly loss. Of these, only Apple, Microsoft, and Nvidia are formally classified under the Info Tech sector, though all are core players in the tech ecosystem.
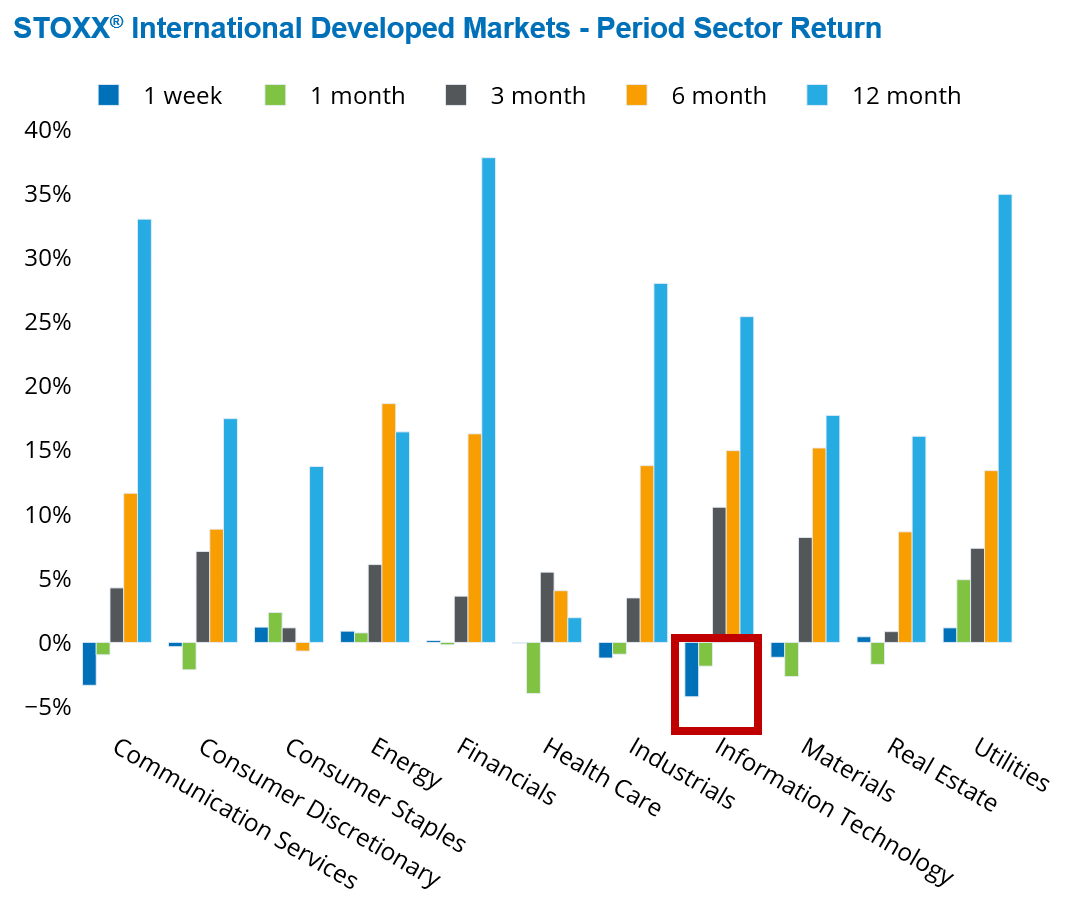
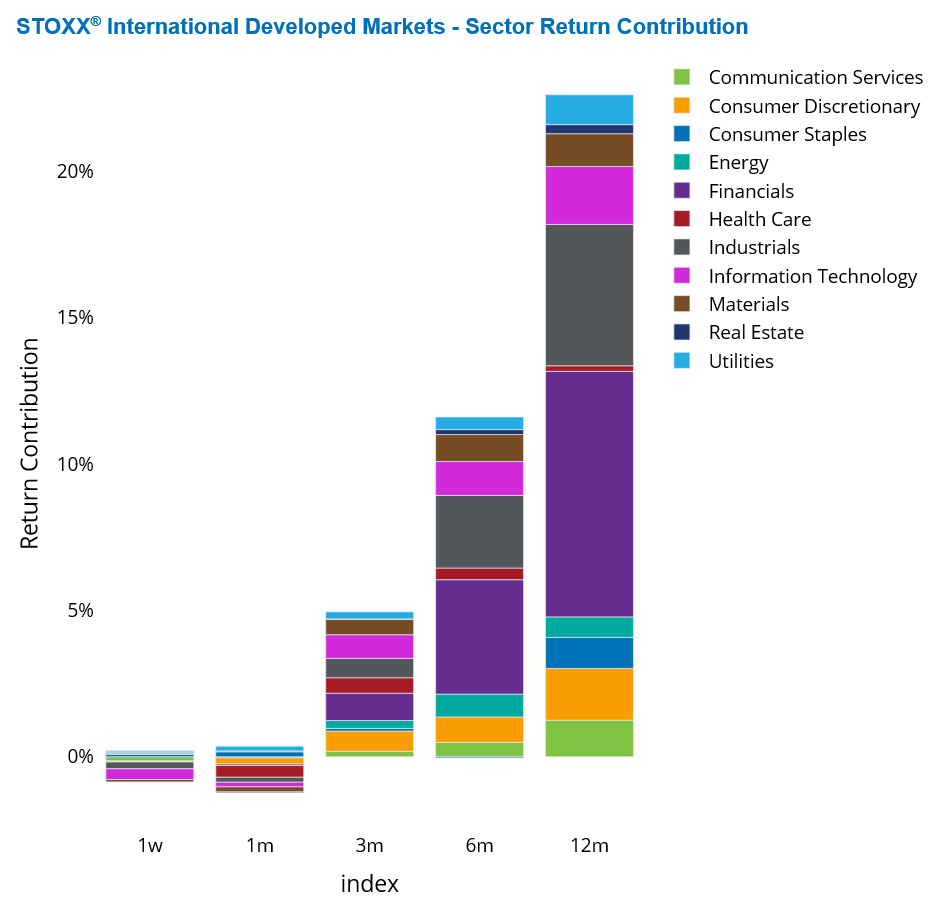
Markets outside the US followed suit. Developed Markets ex-US saw their Info Tech sector fall 4.2%. Although Info Tech represents less than 10% of the STOXX International Developed Markets index, it accounted for nearly 60% of the index’s modest 0.65% decline over the past five trading days.
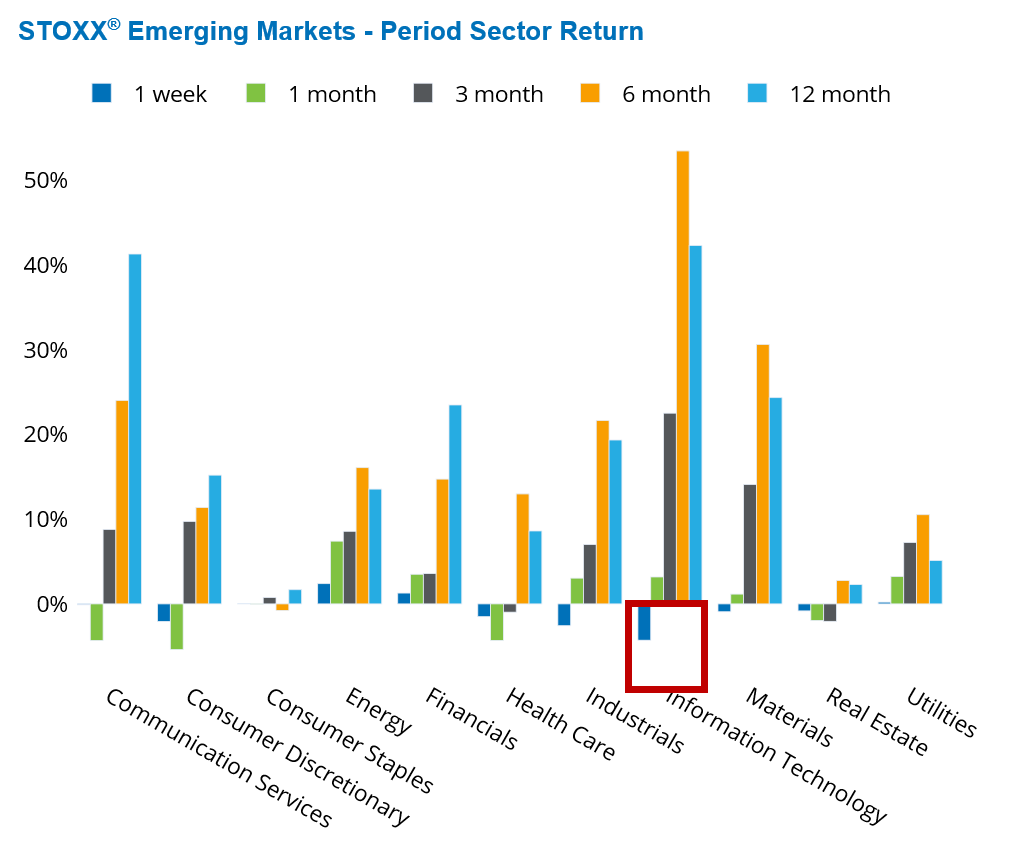
In Europe, Info Tech dropped 4.6%, while Asia saw a 3.6% decline. Both the STOXX Europe 600 and STOXX Asia Pacific fell less sharply than the US market last week. Emerging Markets were not immune either: tech stocks slid 4.3%, driving 80% of the 1.5% decline in the STOXX Emerging Markets index.
Meanwhile, the market downturns were not accompanied by volatility increases. Predicted risk levels edged slightly lower across both US and non-US Developed Markets and Emerging Markets, according to Axioma’s fundamental short-horizon regional risk model.
See graphs from the STOXX US Equity Risk Monitor as of November 7, 2025:
See graphs from the STOXX International Developed Markets Risk Monitor as of November 7, 2025:
See graphs from the STOXX Emerging Markets Risk Monitor as of November 7, 2025:
Sentiment decline reflected in style factor reversal
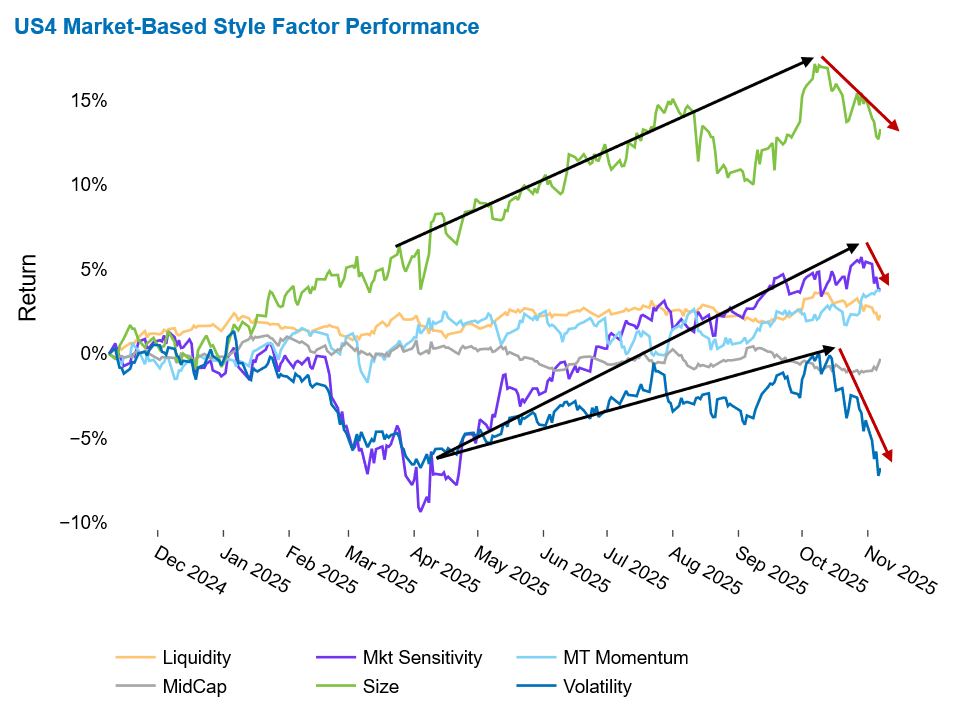
The downturn in the US equity market was mirrored in the decline of the Market Sensitivity, Size, and Volatility style factors within the US4 fundamental medium-horizon risk model. These three factors, which had previously delivered strong positive returns earlier in the year, began to reverse course ahead of last week as investor sentiment started to weaken. Despite third-quarter earnings reports showing most reporting companies outperforming analysts’ forecasts, market confidence has noticeably eroded in recent weeks.
The strong positive performance from April through September reflected investors’ preference for more volatile, high-beta, large-cap stocks. Since then, the decline in the Market Sensitivity, Size, and Volatility style factors marks a shift back to more typical factor behavior.
Last week alone, both Size and Market Sensitivity fell nearly 2%. Over the past four weeks, Market Sensitivity declined by 0.6%, while Size dropped 3%.
Volatility experienced the steepest losses. Its 3% decline last week added to earlier setbacks, pushing its one-month return to over -6%. Both weekly and monthly returns were approximately three standard deviations below expectations at the start of each period.
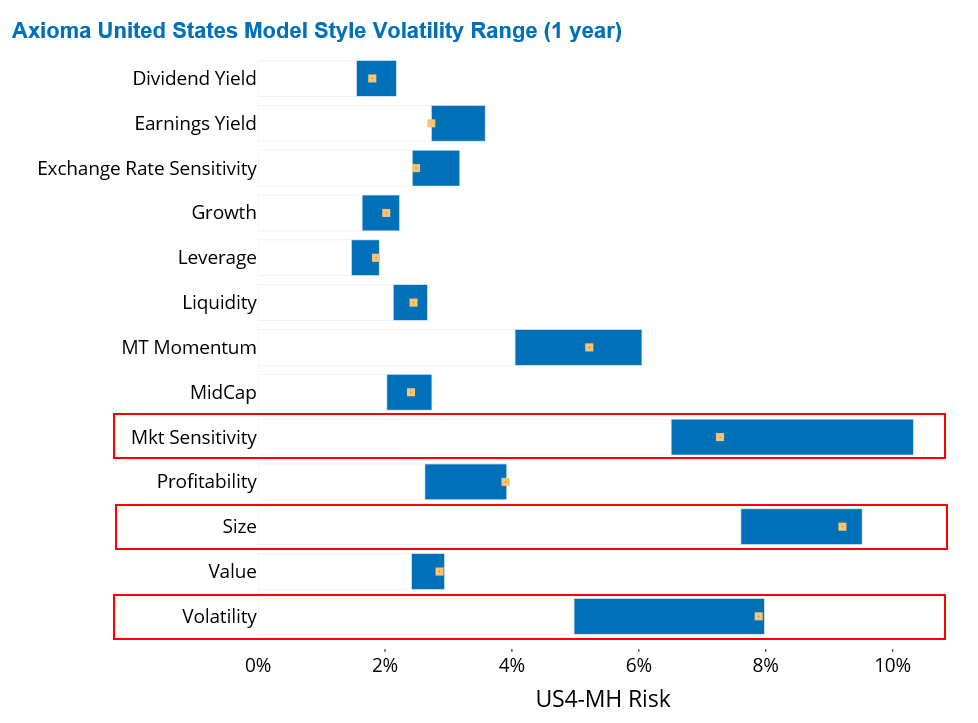
Currently, Size, Volatility, and Market Sensitivity rank as the most volatile style factors in the US4 model—in that order—with Size and Volatility sitting near or at the upper end of their 12-month volatility ranges.
See graphs from the STOXX US Equity Risk Monitor as of November 7, 2025:
Amid the chaos, signs of strength remain in US equities
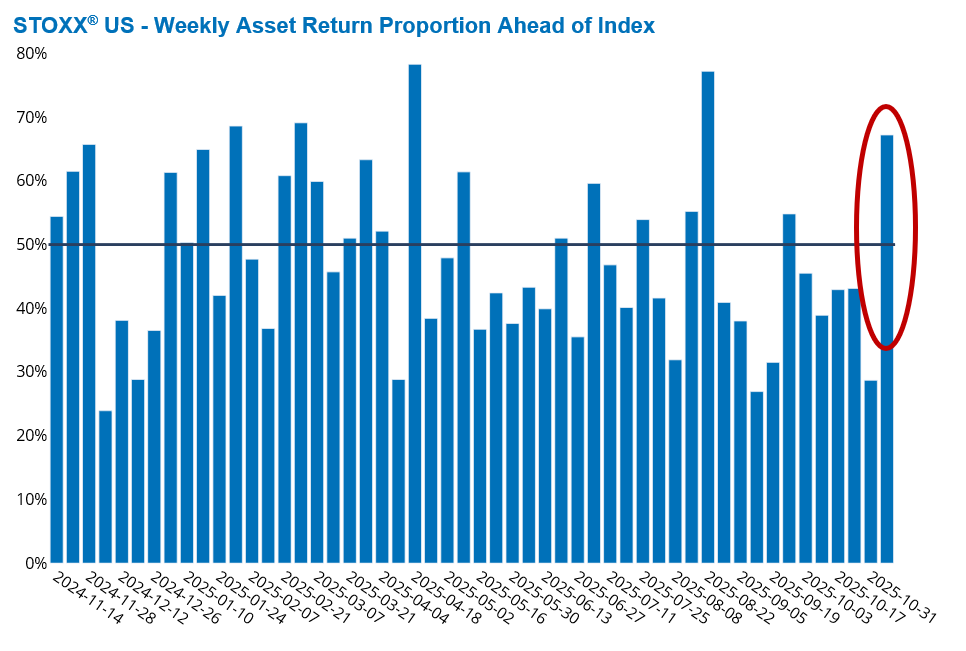
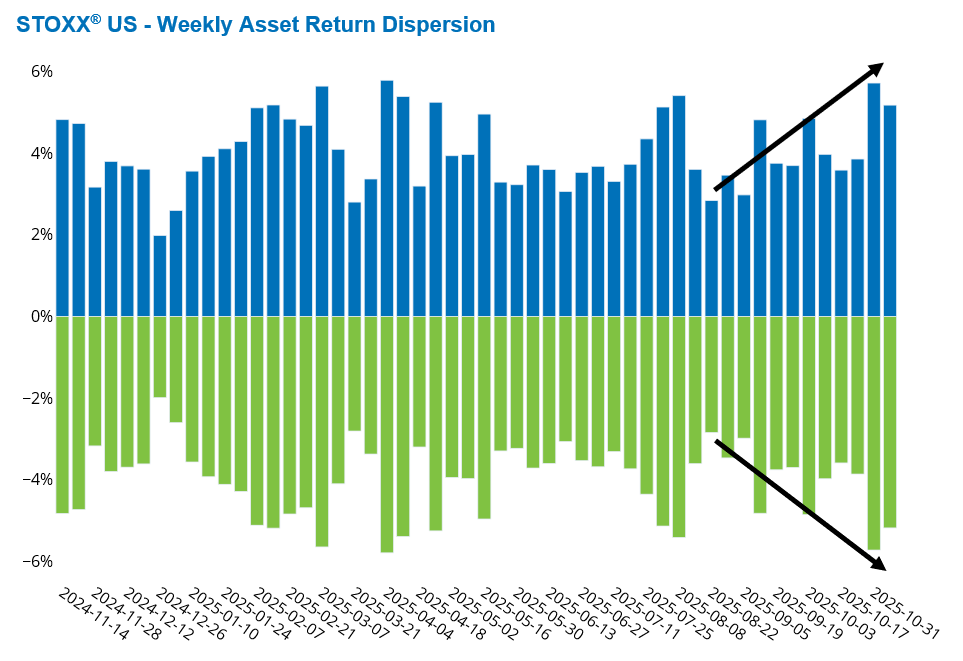
Despite last week’s market rout, there were still some silver linings in the US equity landscape. Notably, outperformers outnumbered underperformers, and both asset dispersion and diversification continued to rise.
Nearly half of the 550 stocks in the STOXX US index posted positive returns, and close to 70% outperformed the benchmark last week. In essence, it was a relatively small group of mega-cap names that dragged the broader market lower. In fact, six of the 11 GICS sectors in the STOXX US index were up last week.
At the same time, weekly asset return dispersion—the cross-sectional standard deviation of five-day returns—has been trending upward over the past three months, with a notable acceleration in the last two weeks. This widening gap between winners and losers suggests increasing differentiation in stock performance.
Together, these trends point to a growing divergence in returns across US equities, offering a potential opportunity for active managers to outperform the broader market, even amid overall declines.
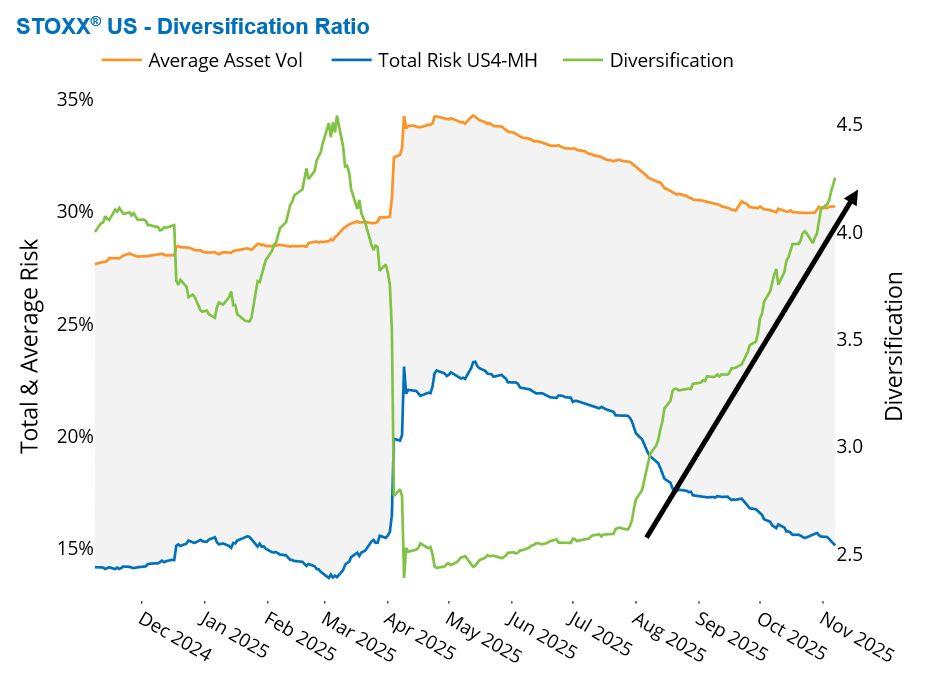
Adding to the positive developments, asset diversification has also been on the rise, nearly reaching its pre-April peak last week. After hitting a year-low in April—falling below 2.5—the asset diversification ratio in the STOXX US index remained subdued until August. Since then, it has rebounded sharply, climbing to nearly 4.25 last week, according to Axioma’s US4 medium-horizon fundamental model.
The asset diversification ratio is calculated as the weighted sum of individual stock variances divided by the total forecasted variance of the index. It reflects the impact of correlations on overall portfolio risk: a ratio of 1.0 implies perfect positive correlation among index constituents, while higher values indicate lower average correlations and, therefore, greater diversification benefits.
See graphs from the STOXX US Equity Risk Monitor as of November 7, 2025:
You may also like


