EQUITY RISK MONITOR HIGHLIGHTS
WEEK ENDED NOVEMBER 14, 2025
- Positive returns continue around the globe; Emerging Markets lead year to date…
- …as market sell-offs have not persisted for long this year
- Investors have continued to favor crowded stocks and shun those with high short interest
Positive returns persist around the globe; Emerging Markets lead year to date…
As we have noted often in our weekly commentary, especially recently, equity markets have been remarkably resilient in the face of heightened uncertainty from the economic and geopolitical landscapes. Year to date, among the indices we track closely, markets have been unexpectedly strong, with gains ranging from more than 30% for the STOXX Emerging Markets Index to almost 8% for the STOXX US Small Cap Index. Many non-US market returns are ahead of those of the US (in local currency) especially in more recent periods, while the STOXX Japan Index leads the pack for the last three and five years.
The following table is not included in the equity risk monitors, but is available on request:
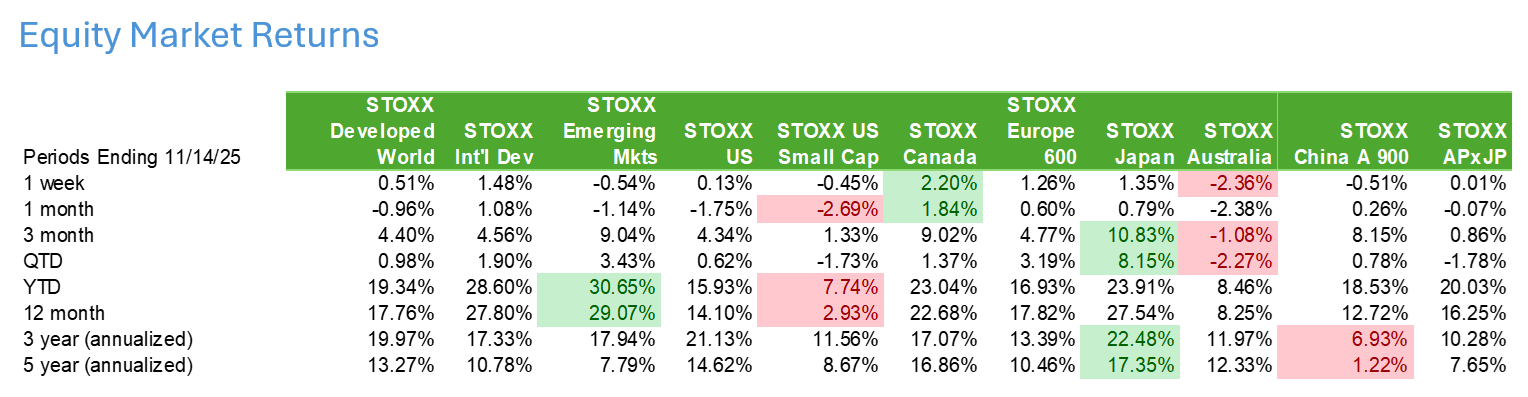
Note: green highlights indicate highest return for the period and pink highlights are for the lowest.
…as market sell-offs have not persisted for long this year
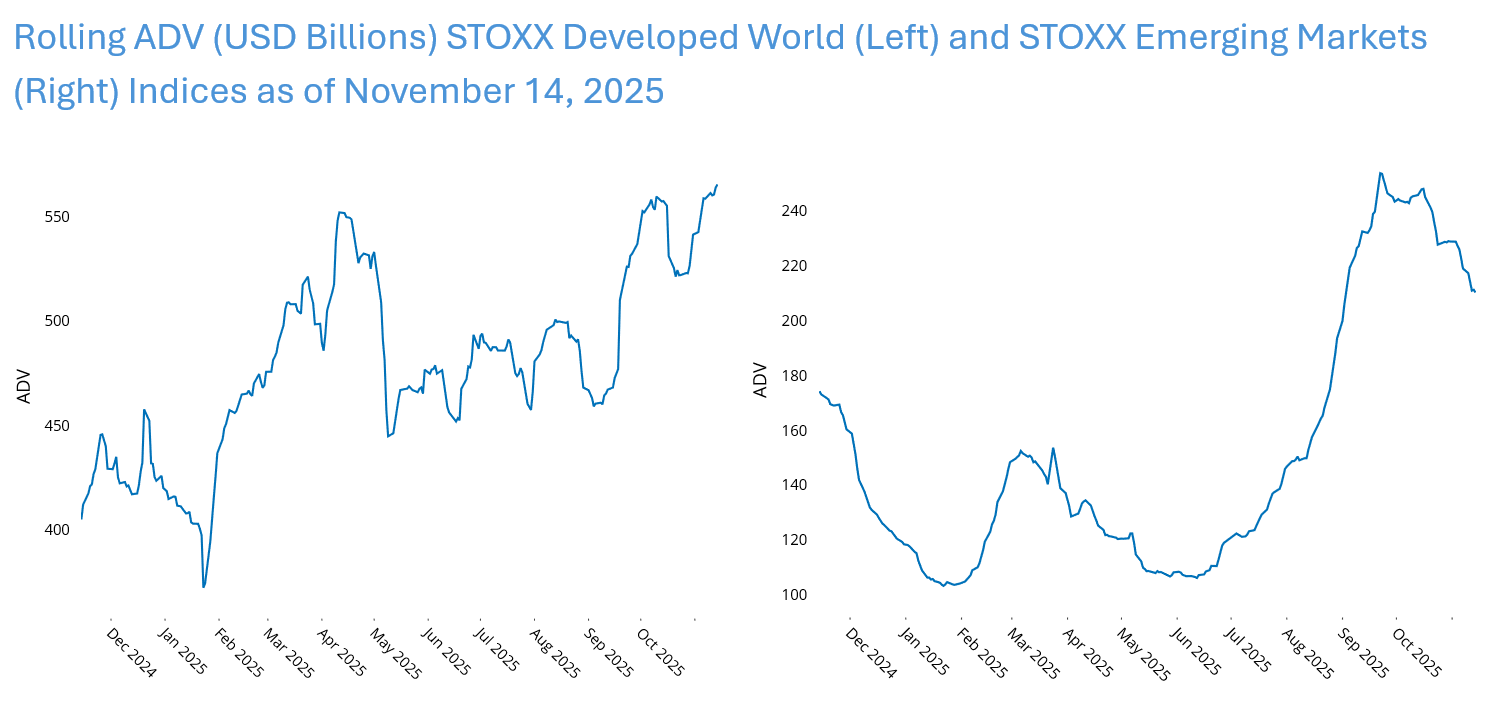
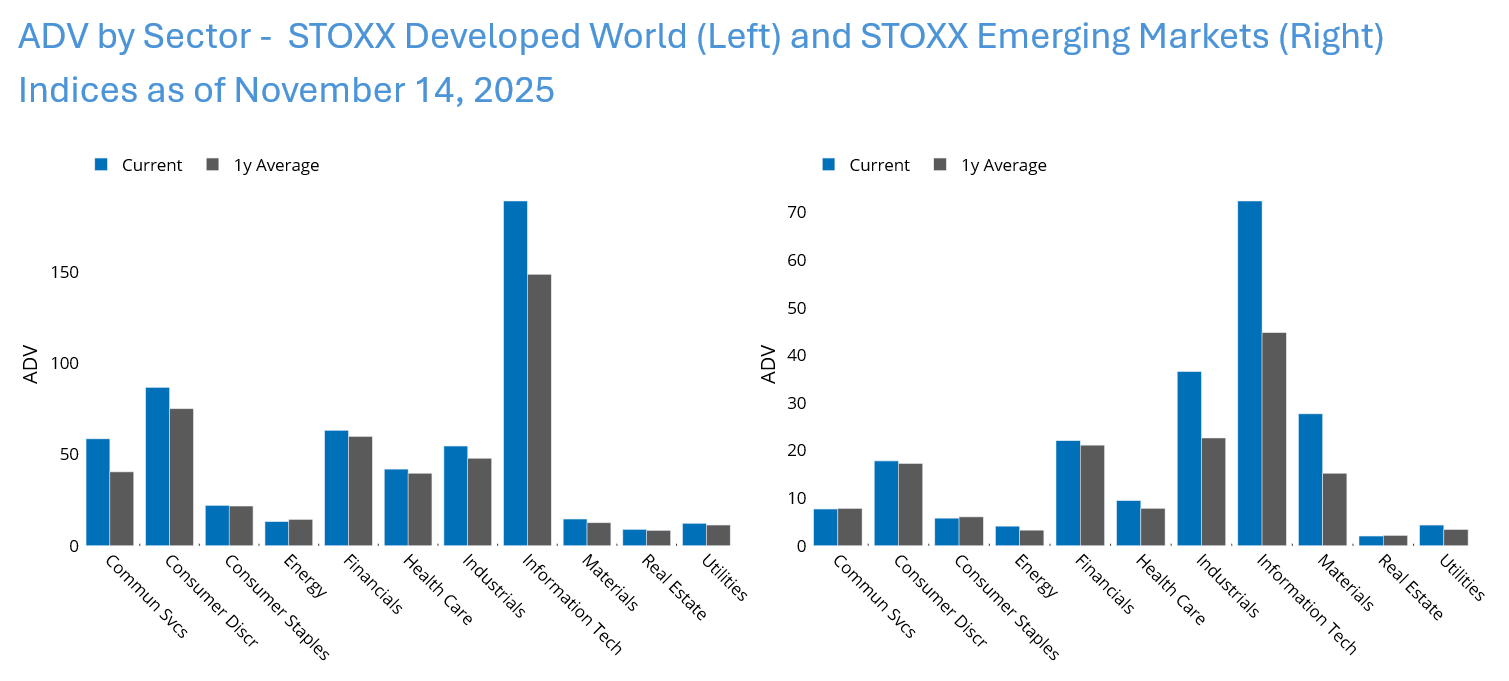
“Buy the dip” has become the mantra for many investors, who are clearly not put off by volatility. Trading volume remains strong, especially in developed markets, as measured by the STOXX Developed Markets Index. Emerging markets trading volume only started to pick up in July, and has retreated this month even as developed markets volume remained high. And while Technology stocks seem to get most of the attention (and indeed lead the sectors in total volume), recent volume has been higher than the average for the year almost across the board, in both developed and emerging markets.
See charts from the STOXX Developed Markets and STOXX Emerging Markets Equity Risk Monitors
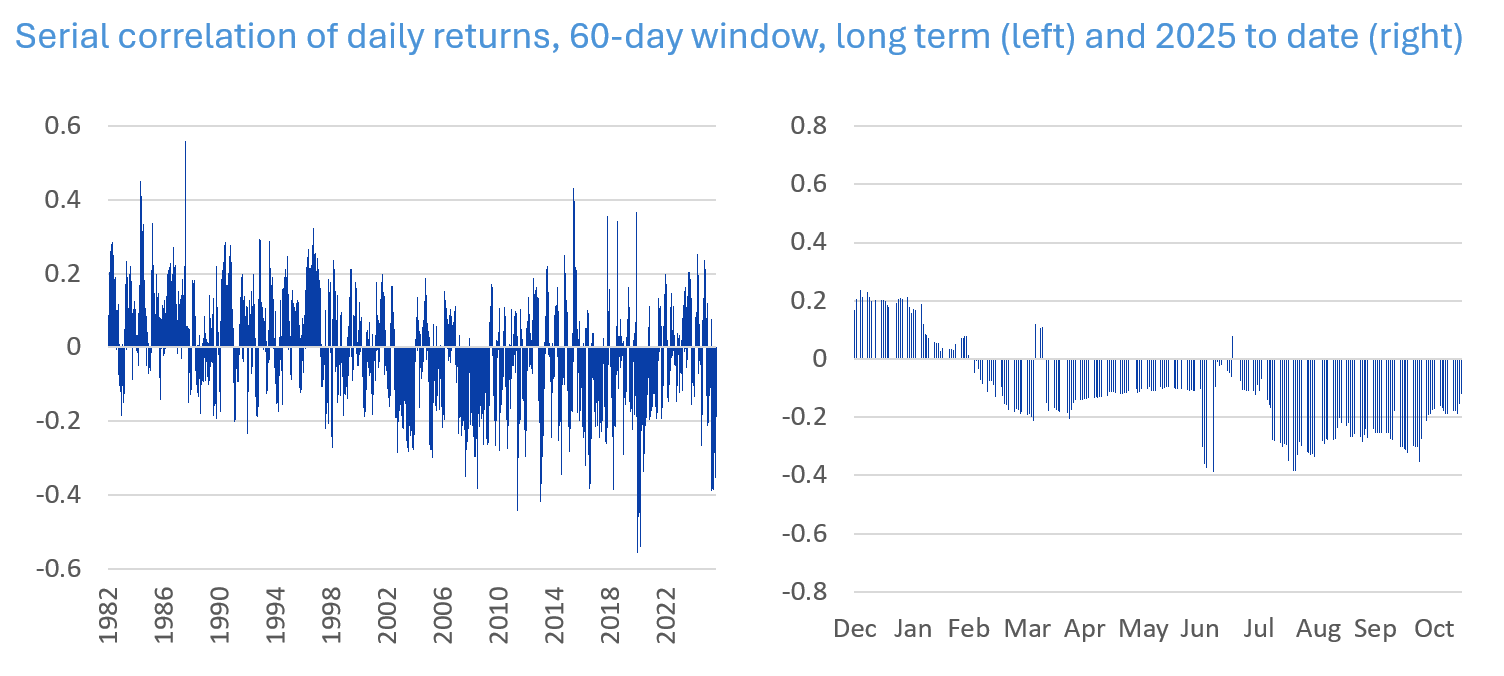
To derive a measure of the presence of “buy the dip,” we calculated a simple serial correlation of one-day market returns using a 60-day rolling window. Our thought is that a negative correlation can point to investors buying and driving a reversal the day after the market is down. This is by no means a perfect measure, of course, but can be interesting when current levels are compared with history. We used the Axioma US Core Market Portfolio for this analysis, as we have history of returns for more than 40 years. We found that the serial correlation of returns from one day to the next over rolling 60-day periods was negative about 53% of the time over the full period, whereas it has been negative about 80% of the time this year. This suggests that investors have been more likely than average to buy the dip this year as compared with history, especially since March. Most recently the serial correlation, while still negative, is less so; perhaps investors are starting to get a bit more worried that high valuation levels and new questions about the AI story (see last week’s Axioma Risk Monitor Commentary for more discussion) may be longer lasting, or at least that the sell-offs are not providing as much opportunity as they did earlier this year.
The following charts are not included in the equity risk monitors, but are available on request:
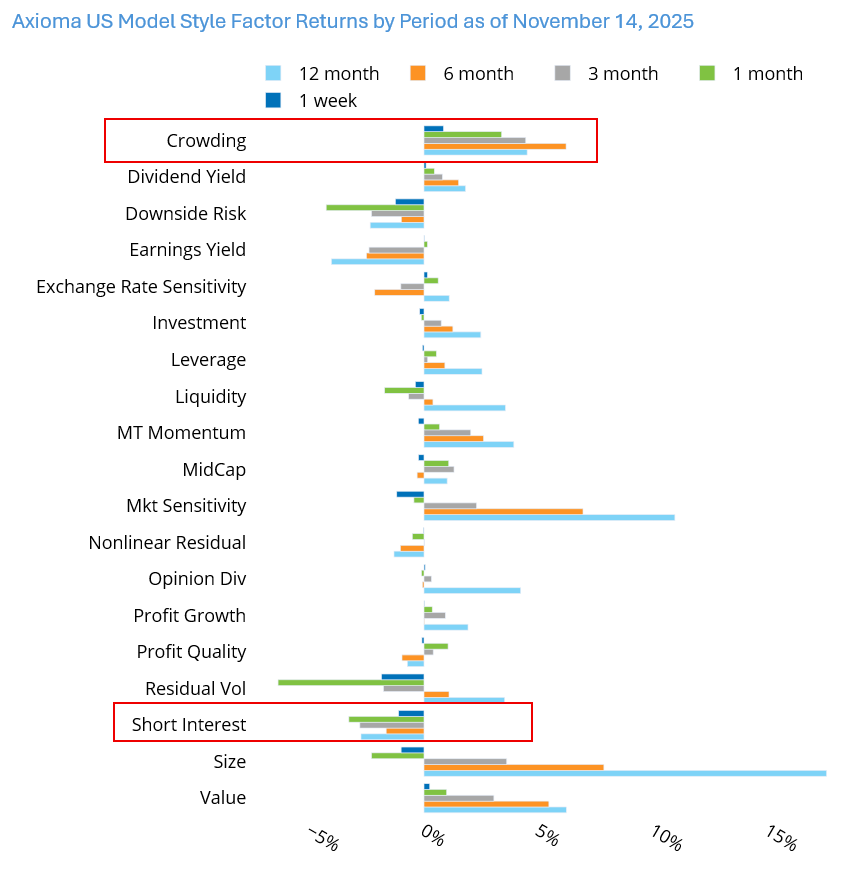
Investors have continued to favor crowded stocks and shun those with high short interest
In last week’s Equity Highlights we discussed the sharp reversal in returns for the Market Sensitivity, Size and Volatility factors in Axioma’s US4 model. Those factors continued to produce negative returns for the five days ending November 14, with Volatility’s return almost 2.5 standard deviations below its expected volatility at the beginning of the week. (The recent negative return is in line with the long-term average returns for the factor; its earlier, highly positive performance during the year was much more of a surprise).
This week we look at two US5.1 factors, relatively new to the Axioma risk model suite, where returns have been strongly in the expected direction for some time now: Crowding and Short Interest. Crowding’s risk-adjusted returns in the past week (2.4), month (4.6), three months (3.8), six months (3.9) and one year (2.3), have stood out as being higher than expected, and a bet on Crowding continuing to produce positive returns would have paid off significantly.
Short Interest is expected to produce negative returns, and it has also rewarded investors with negative bets at a higher magnitude than expected given the initial risk estimate, especially over the last week and month, when its risk-adjusted returns were -2.6 and -3.8, respectively. While the factor performance has been in the direction expected for the longer periods it remained within two standard deviations based on the risk forecast at the beginning of the period.
While some factors’ returns have strayed from the norm, these two behaved exactly as expected, only more so!
See chart from the Russell 1000 Equity Risk Monitor
You may also like