
EQUITY RISK MONITOR HIGHLIGHTS
WEEK ENDED JANUARY 9, 2026
- All-Time Highs for Silver and Copper Futures
- Small Cap Outperformed Large Cap? Well, Excuuuse Me!
- Best Risk-Adjusted Country Returns in 2025
Last week, markets largely shrugged off rising geopolitical tensions caused by the US capture of Venezuelan leader Nicolás Maduro. Every index we closely track ended the week higher, and the STOXX Japan, STOXX Europe 600 and STOXX Emerging Markets all outperformed the Russell 1000. Early in the week, Gold, Silver, and Copper Futures all rose, with Copper hitting an all-time high on Monday and Tuesday, and Silver posting its highest price ever on Tuesday. On Friday, the Bureau of Labor Statistics December Jobs report showed fewer than expected jobs added, and BLS also revised down the figure reported back in October and November.
Let’s Get Small
The best performing index on our watchlist this week was the Russell 2000, which gained 4.63% despite a small decrease in risk over the same period as measured by our Axioma United States Small Cap 4 Model.
See chart from the Russell 2000 – USSC4 Equity Risk Monitor as of January 9, 2026
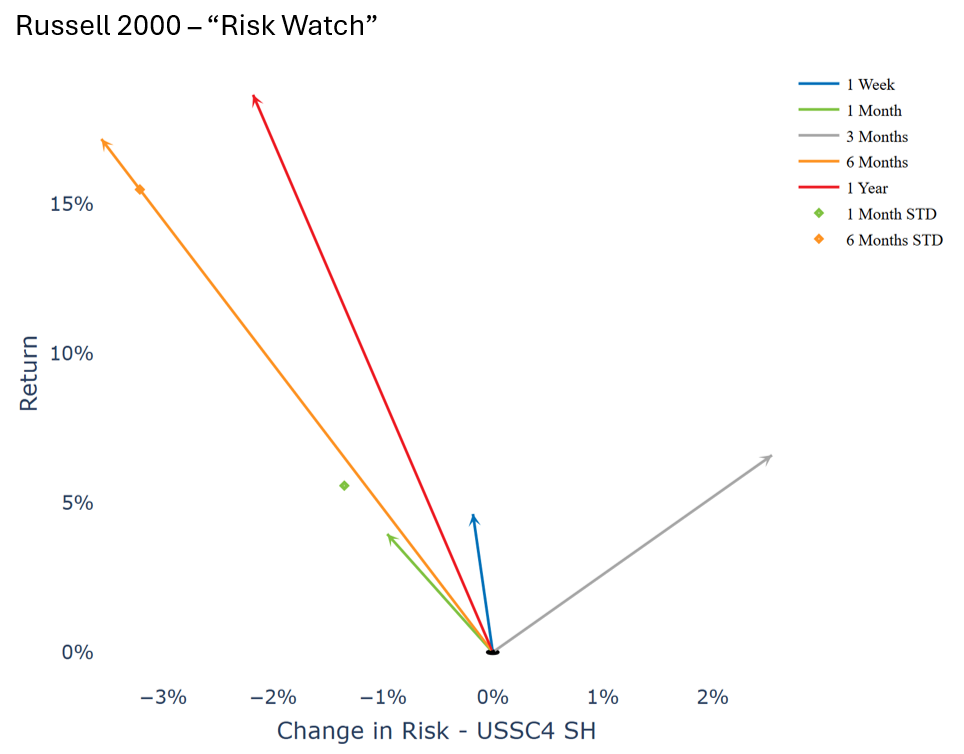
That said, overall risk in the index increased over the past few weeks, primarily driven by both the Market and Style components of the model. Since we’re using a more focused model here, we can think of the market factor as representing the risk inherent to being a small cap firm in the US.
See chart from the Russell 2000 – USSC4 Equity Risk Monitor as of January 9, 2026
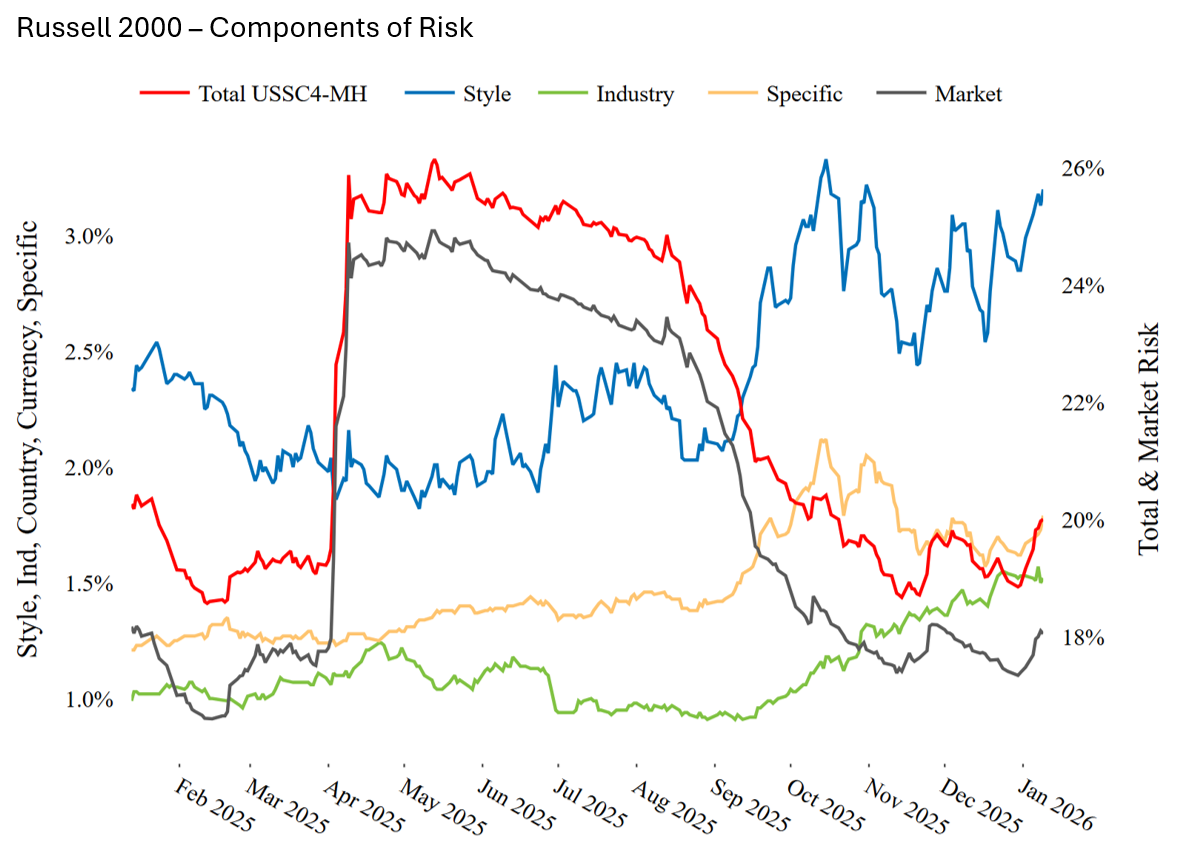
Conventional wisdom tells us that small cap firms have higher exposure to interest rate uncertainty since they tend to have more debt financing than larger companies. Thus, we might be inclined to see this move as tracking interest rate expectations in 2026. However, the implied probability of moves in the Fed Funds rate as computed by CME has remained stable over the period.
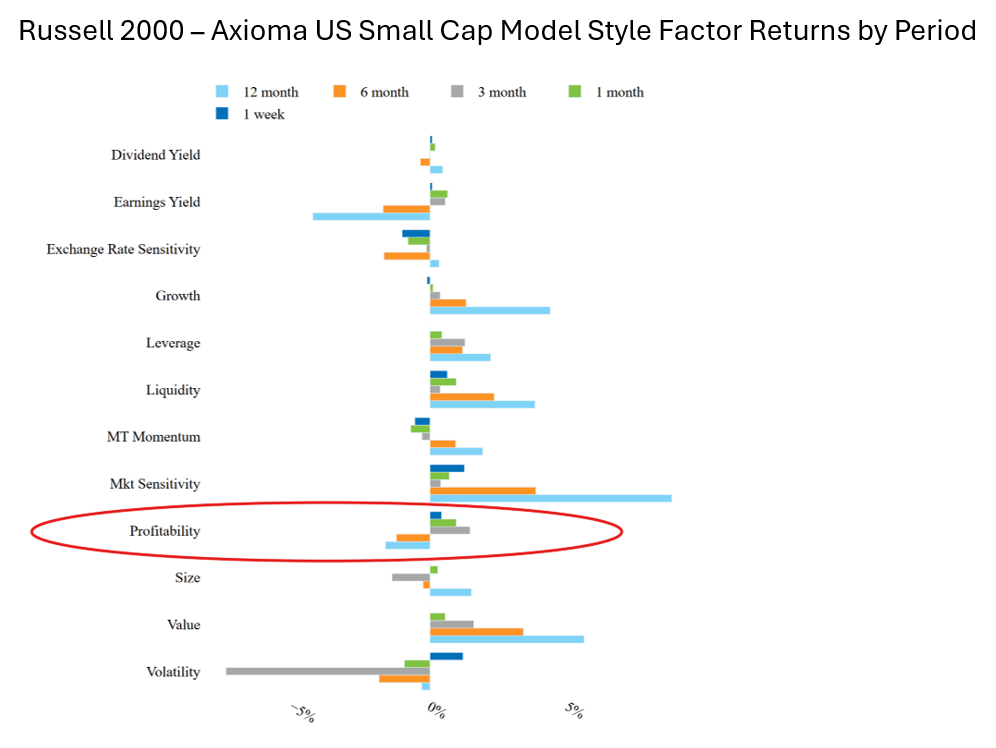
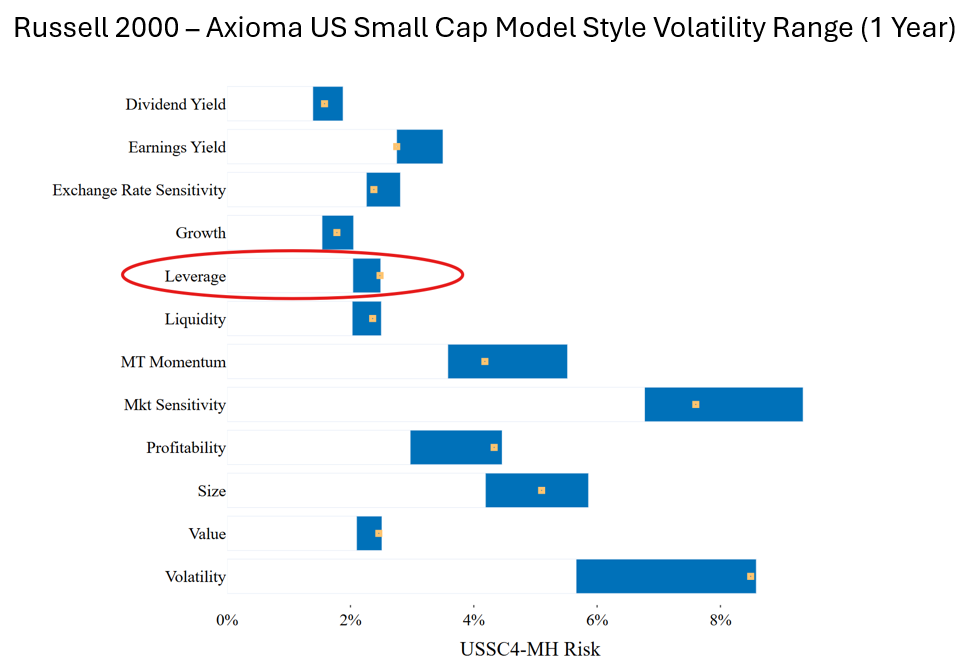
According to the US Small Cap model Interestingly, Profitability has the best factor return over the last month after seeing negative returns over the last year, and the risk associated with the Leverage factor is at the high end of its 1 year range. Considering the recent consternation over Private Credit, perhaps market participants are paying more attention to small cap firms’ ability to repay debt.
See chart from the Russell 2000 – USSC4 Equity Risk Monitor as of January 9, 2026
See chart from the Russell 2000 – USSC4 Equity Risk Monitor as of January 9, 2026
Where in the World is Risk Adjusted Return?
Last week, we reviewed 2025 from the vantage point of index returns, but this week we are going to take a different approach. Here, we created a portfolio for the developed countries with the largest stock markets weighted by the Axioma World Wide 5.1 Estimation Universe (i.e. the inverse of the asset’s square root of market cap).
The following chart is not included in the Equity Risk Monitors but is available on request:
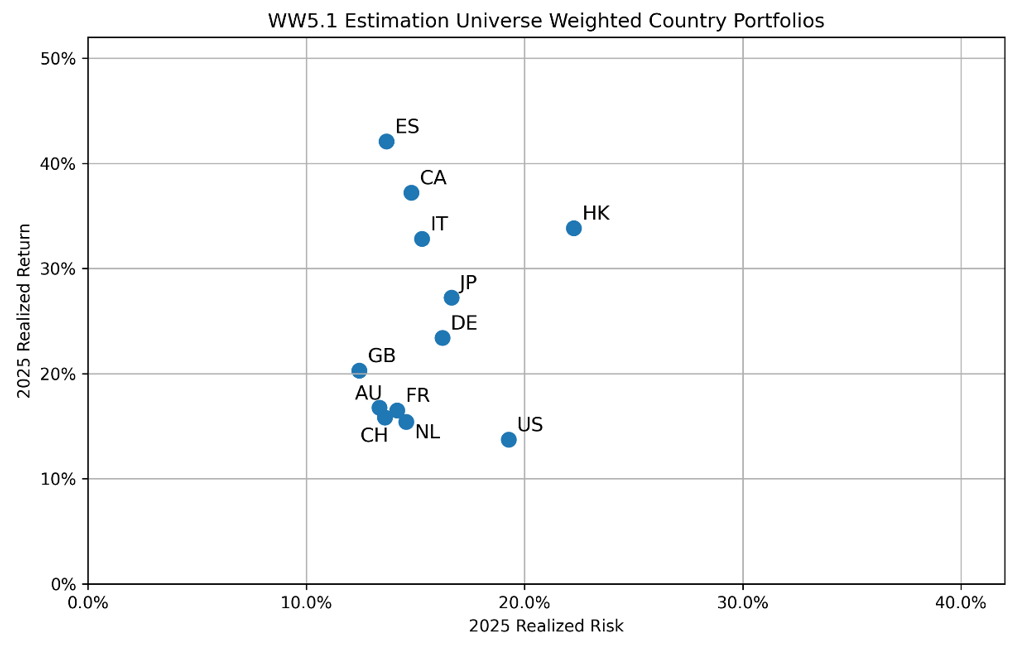
In our chart, the best three performing markets were Spain, Canada, and Italy. We should note here that these portfolios differ from our Country factors—the Country factor returns are orthogonal to the Market factor, Style and Industry factors, and to the other Country factors, while these market portfolios have non-zero exposures to all factors. As a result, we can use Factor Attribution to understand the Country portfolio returns:
The following chart is not included in the Equity Risk Monitors but is available on request:
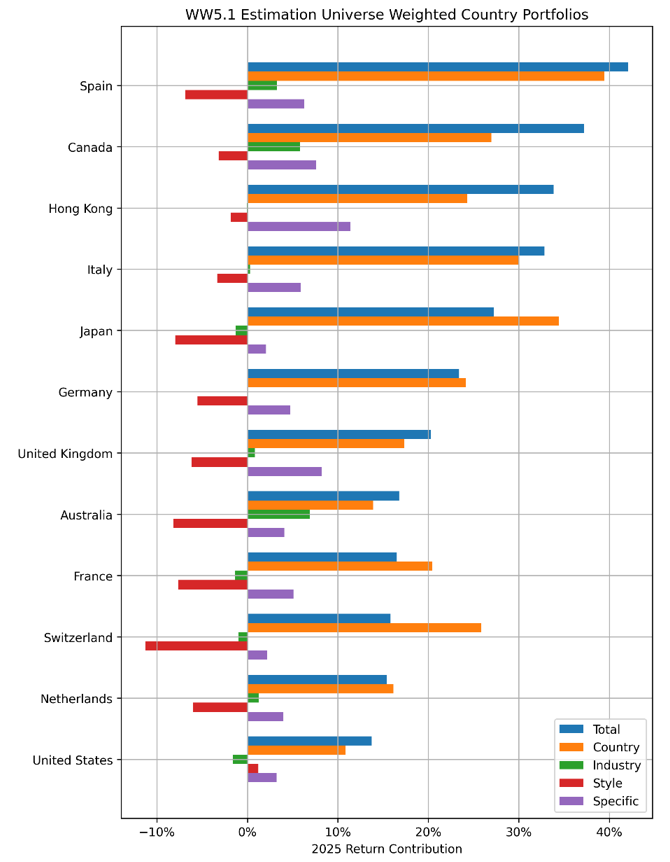
Naturally, much of the portfolio-level return is loaded on the Country factors, but the direction and the magnitudes of the loadings differ by country. For example, Italy’s return is mostly attributed to its Country factor while Spain and Canada have significant Industry exposure. In fact, Canada’s second largest factor contributor is the Metals & Mining Industry. Metals & Mining was a 5 top factor contributor for Australia, United Kingdom, Netherlands, and Japan as well. After Country, Spain’s second largest industry contribution came from Aerospace & Defense. All the European members of NATO we looked at (with the exception of Italy), had a top 5 contribution from Aerospace & Defense.
On a relative basis, we can see that the United States underperformed other Developed countries, and if we subtract the Global Market Factor from the Country factor, the contribution is negative. Those who manage global portfolios likely already know this, but those who only use a US model could benefit from taking a look a global risk model for some perspective.
You may also like


