

EQUITY RISK MONITOR HIGHLIGHTS
WEEK ENDED FEBRUARY 6, 2026
- In the last week US market round-tripped, Europe and Japan saw stocks rise, while they fell in Asia ex-Japan – and risk followed a similar pattern
- Factor returns saw some big moves last week, many in the “wrong” direction…
- …driving style and industry risk higher relative to recent history
In the last week US market round-tripped, Europe and Japan saw stocks rise, while they fell in Asia ex-Japan – and risk followed a similar pattern
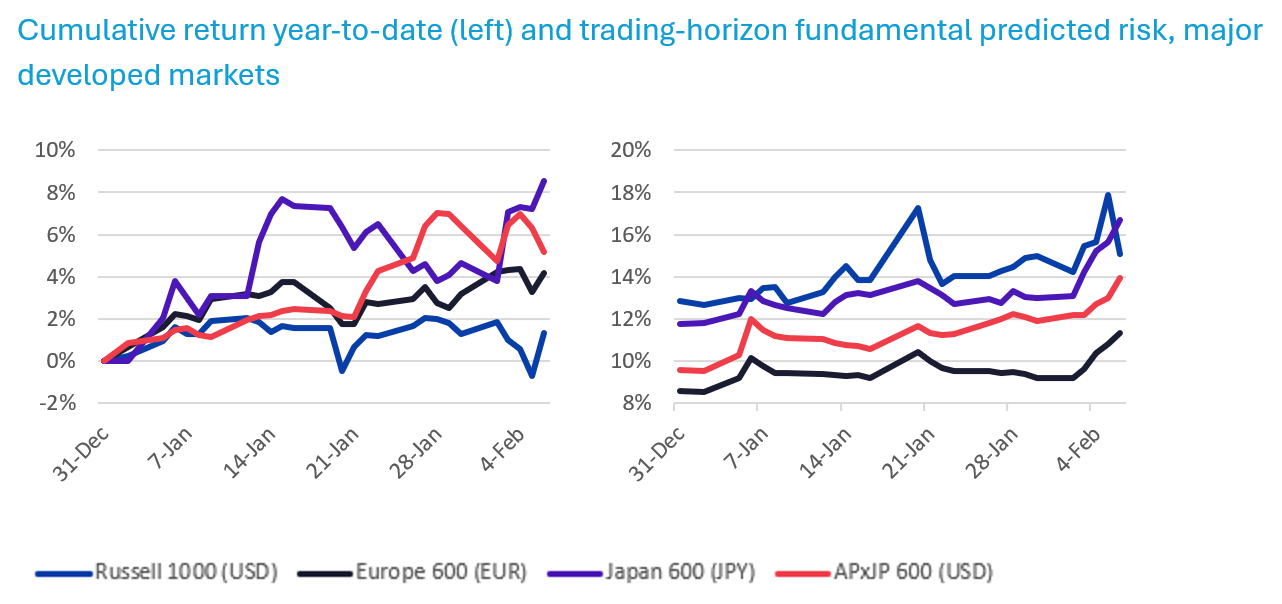
Last week’s substantial rout for US software stocks (see our analysis of the event, including how risk models may have predicted the decline, here) reversed itself by Friday, when the Dow hit 50,000 for the first time1. The US market as defined by the Russell 1000 ended up roughly flat for the week, and if you were not paying attention it may have seemed as if nothing happened. Asia ex-Japan had a rough week, falling more than 1%, while Europe, and especially Japan, produced strong returns, gaining 1% and 3.7% respectively, in local currency.
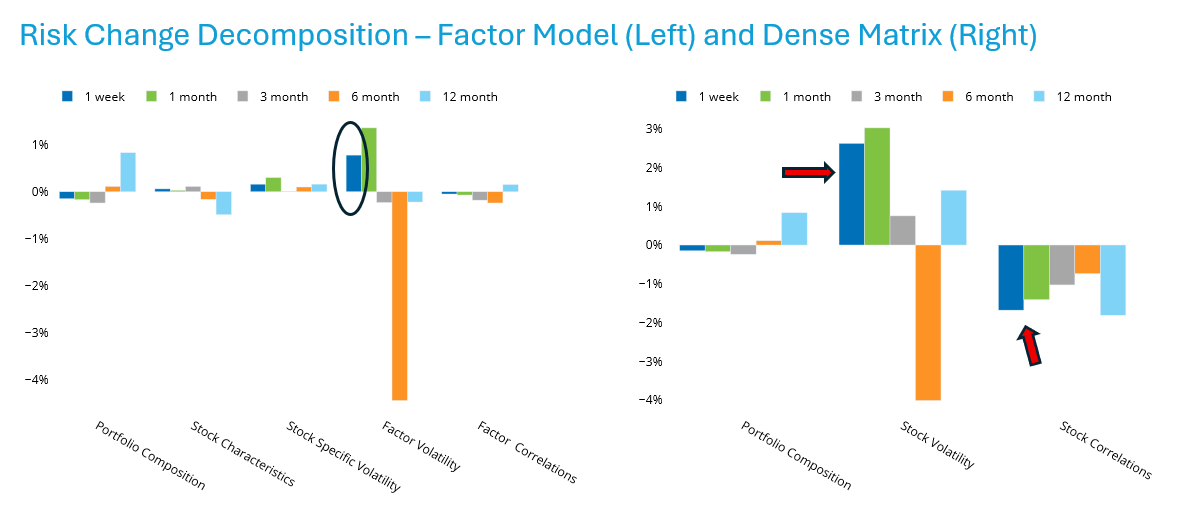
Market volatility was not accompanied by higher risk predictions from the short- and medium-horizon model variants outside the US, but the Russell 1000 did see a small increase in risk at both horizons. The increase was driven by higher factor volatility, which in turn was the result of higher individual stock volatility. As the market rotated, asset correlations actually fell for the week and kept the risk increase in check.
See charts from the Russell 1000 – US5.1 Equity risk monitor as of February 6, 2026:
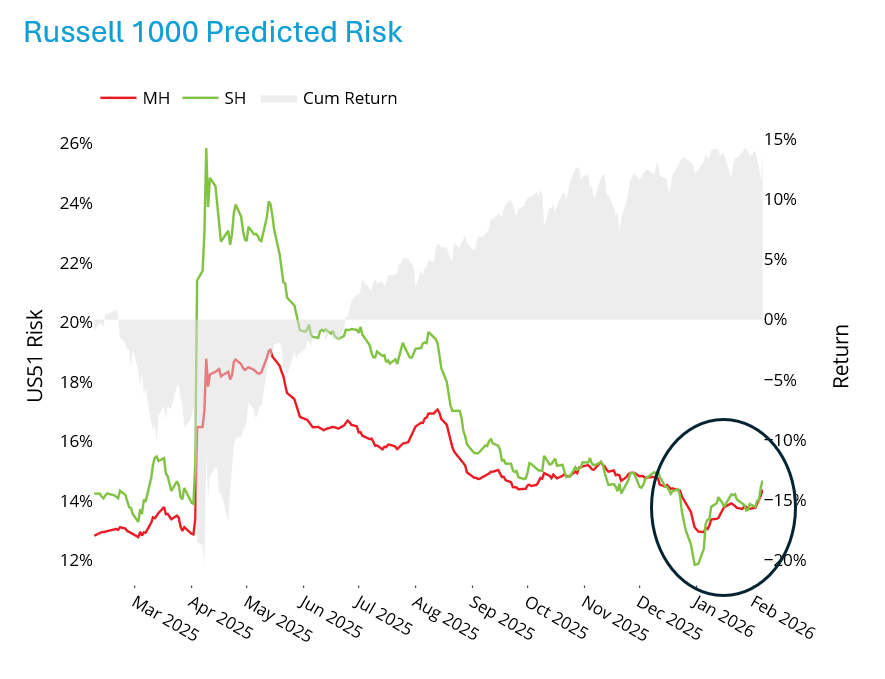
The Axioma trading horizon models may provide a clearer picture of what happened to risk during this period. We looked at the risk according to Axioma’s fundamental US trading horizon model (US5.1 TH) for the Russell 1000, and according to the fundamental Worldwide trading horizon model (WW5.1 TH) for Europe, Japan and Asia ex-Japan.
For the US, trading horizon risk jumped about 20% from January 30 to February 5, but then settled right back to where it had ended the prior week by Friday, February 6. We effectively saw a one-week return of zero and a comparable change in risk, masking a lot of underlying angst!
In contrast, trading-horizon risk increased steadily over the same time period for Europe, Japan and Asia ex-Japan, for an overall double-digit gain during the period. The biggest increase in risk was seen in Japan, the market with the highest return over that period.
The following charts do not appear in the risk monitors, but are available on request:
Factor returns saw some big moves last week, many in the “wrong” direction…
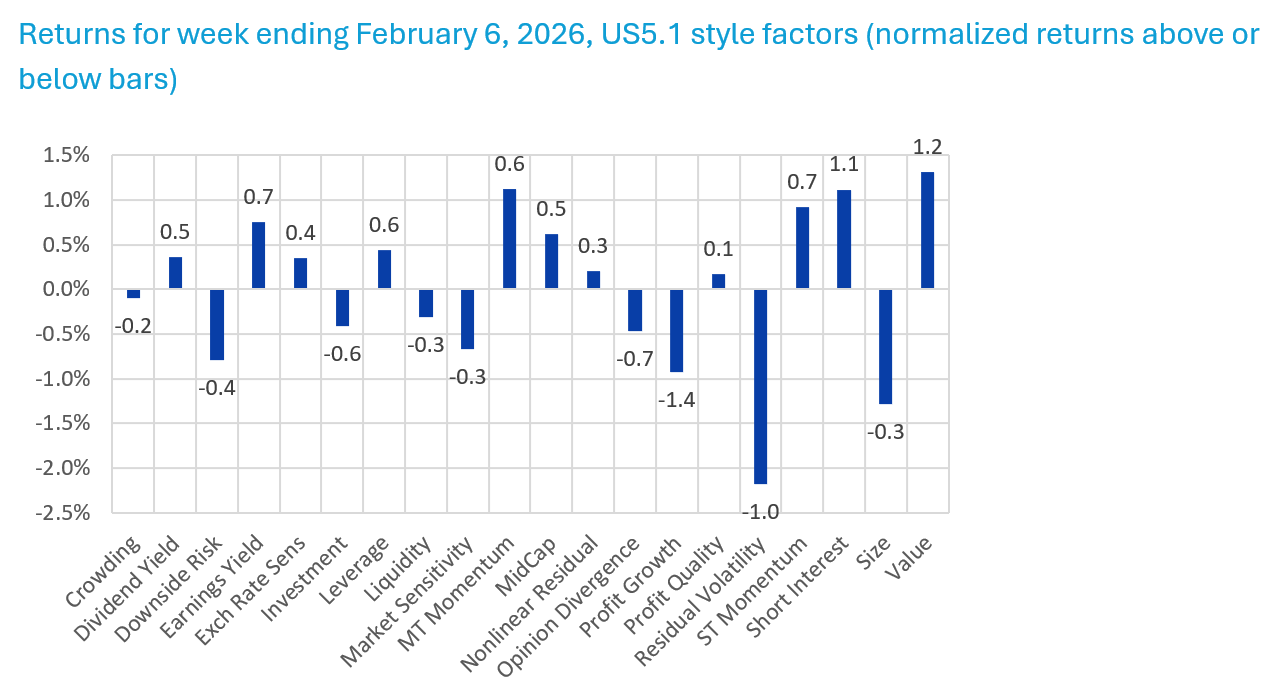
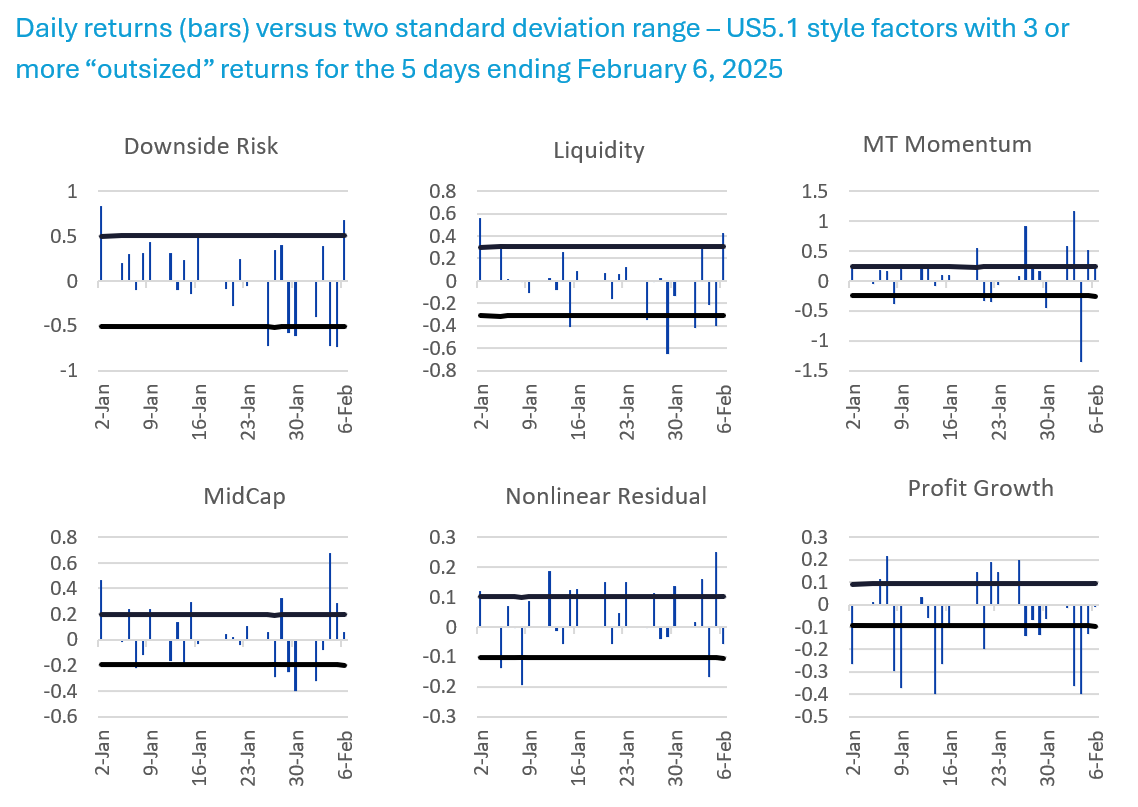
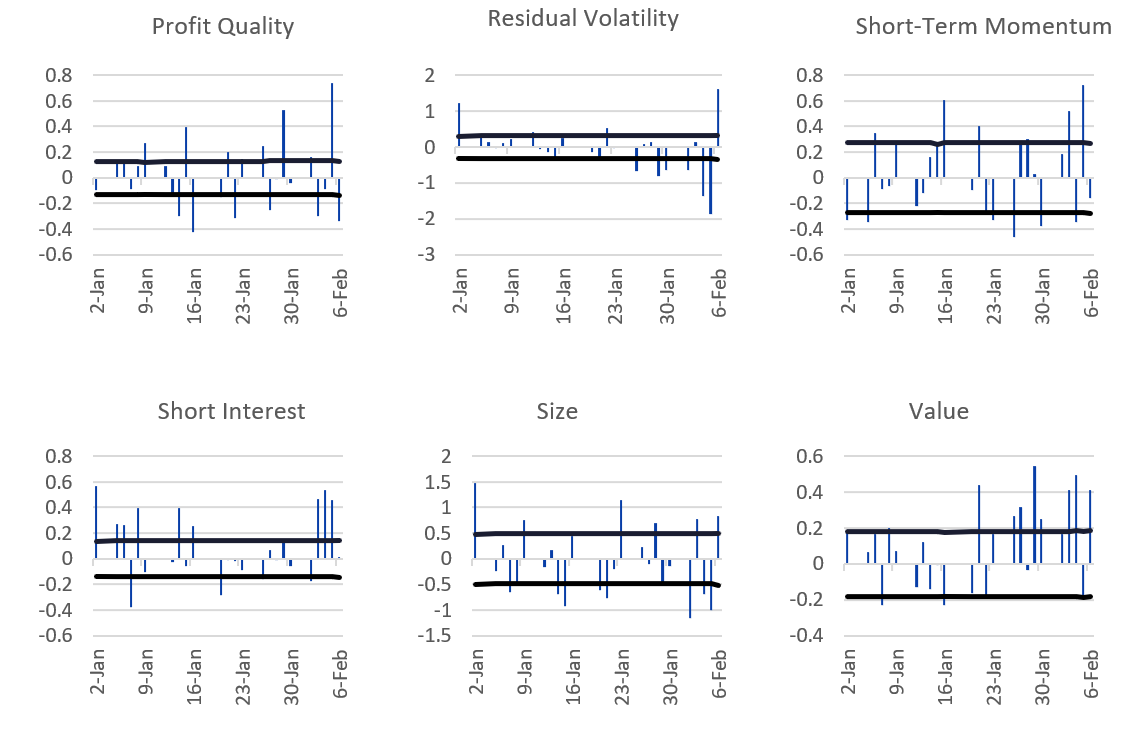
Of the 20 Style factors comprising the US5.1 fundamental models, last week 12 saw three or more daily moves (over the five days) that fell outside of a two-standard-deviation range. In most cases the factor returns were in different directions from one day to the next, making them difficult to navigate. By the end of the period the back-and-forth meant several weekly factor returns did not seem to be particularly remarkable, but daily volatility tells a different story.
First, we looked at returns for the week ending February 6 and how they compared with the long-term average, adjusted for long-term volatility (that is, “normalized” returns). For the week, Short Interest stood out with a return of 1.12%, which was more than one standard deviation above the long-term average five-day return, which is typically negative. Similarly, Profit Growth had a tough week, returning -0.92%, normalized at -1.4%. Value stood out in a positive direction, with a return of 1.31% for the week, 1.2% normalized.
Then we examined the daily returns versus a two standard deviation range. Here, Medium-Term Momentum stood out with ups and downs far outside of the range. Profit Growth was notable for its consistently large negative returns. Short Interest, with an expected negative risk premium, saw highly positive returns for three days. And Value has had a run of unusually positive daily returns this year, even before last week.
The following charts do not appear in the risk monitors, but are available on request:
…driving style and industry risk higher relative to recent history
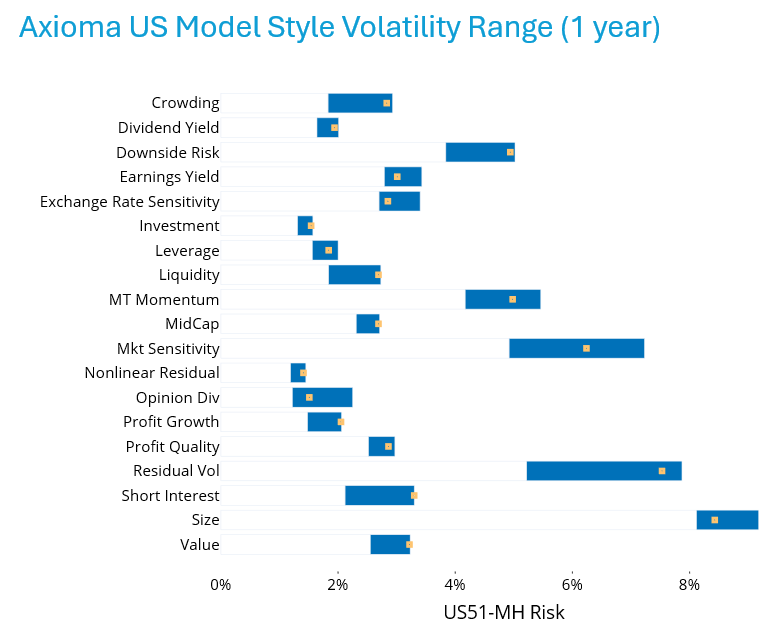
Finally, the daily ups and downs have translated into heightened volatility for many style and industry factors, in the US5.1 fundamental medium-horizon model. Most style factors’ current predicted volatility is within 10% of the high end of the one-year range, with Short Interest forecast to see a 12-month high in volatility. Market Sensitivity, Residual Volatility, and Size have the highest current levels of predicted volatility among all the style factors, although Size is actually closer to the lower end of its 12-month range.
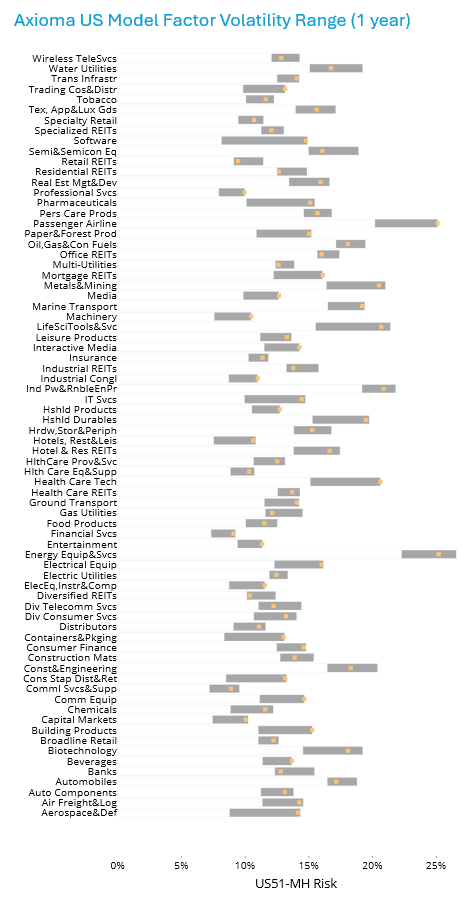
US Industries are seeing similar heightened risk, with 62 of the 74 (about 84%) within 10% of the 12-month high and 13 at the high.
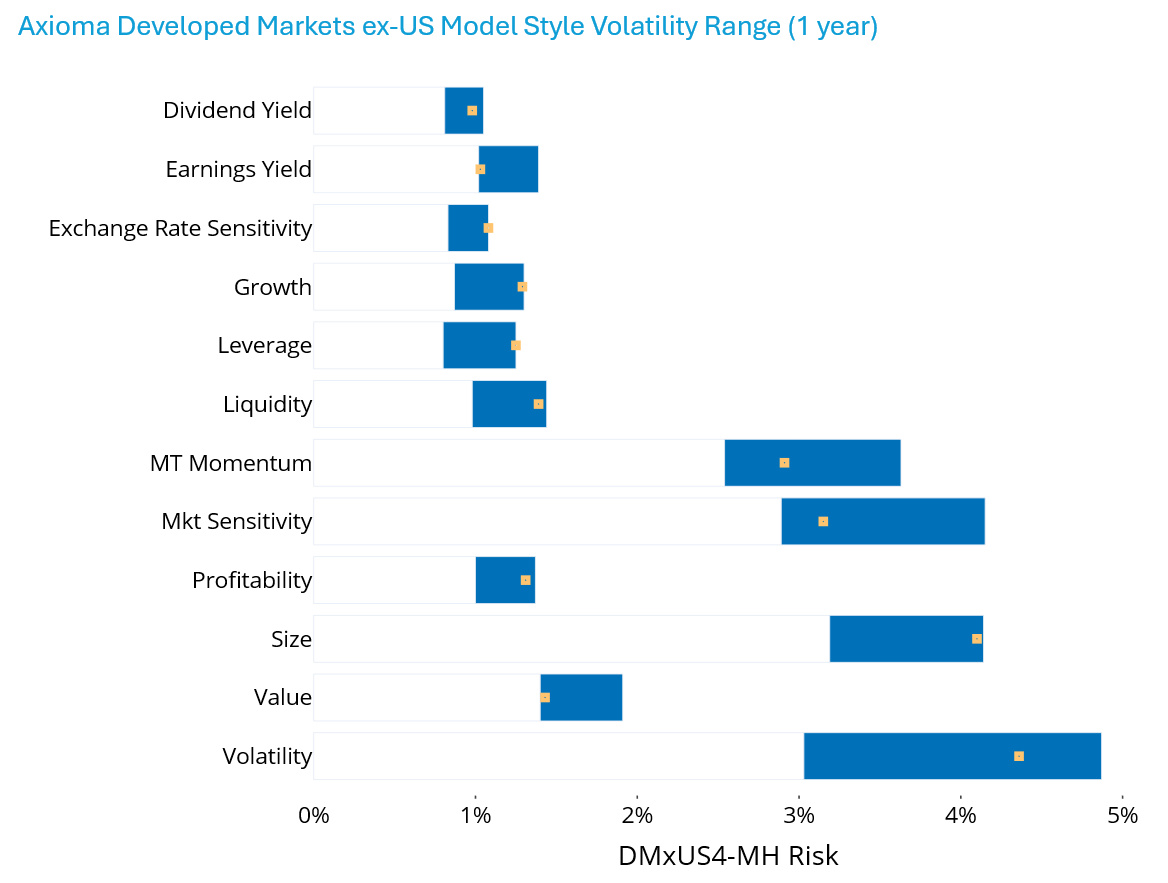
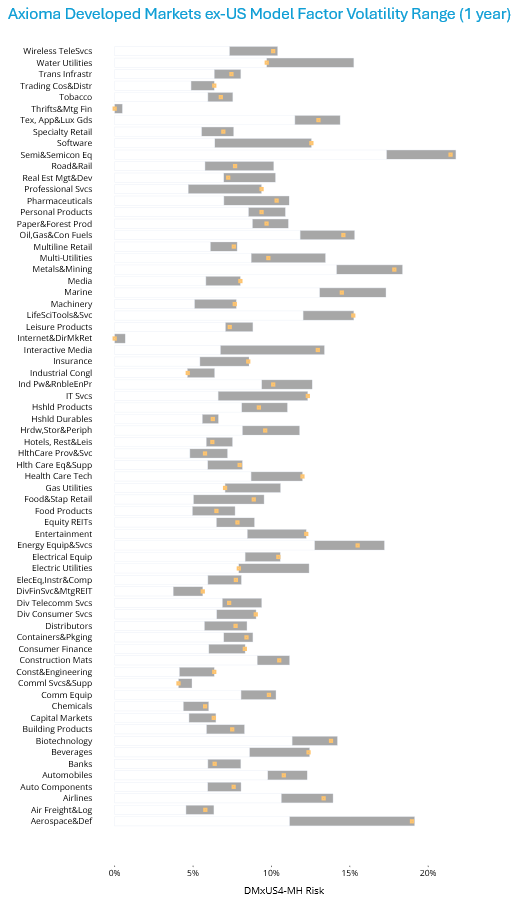
In contrast, according to Axioma’s Developed Markets ex-US (version 4) model, seven of 12 style factors are at or near the high end of the 12-month range, and a lower proportion of industries are within 10% of the high end of the range (40 out of 66) when compared with the US.
See charts from the Russell 1000 – US5.1 Equity risk monitor as of February 6, 2026:
See charts from the STOXX Global 1800 ex USA Equity Risk Monitor as of February 6, 2026:
Reference/Footnotes
1 As an aside, this author can still remember the seemingly crazy, but ultimately correct predictions by my former colleague, the great Ralph Acampora, for Dow 5,000, 7,000 and 10,000. As such, 50,000 seems even more unbelievable.
You may also like


