EQUITY RISK MONITOR HIGHLIGHTS
WEEK ENDED JUNE 26, 2026
Axioma Risk Monitor: Mega-cap meltdown: 8 stocks move the entire US market; Tech weakness accelerates sector rotation, fueling dispersion; Small Caps defy rate hike risk; Emerging Markets AI trade isn’t diversified either
Mega-cap meltdown: 8 stocks move the entire US market
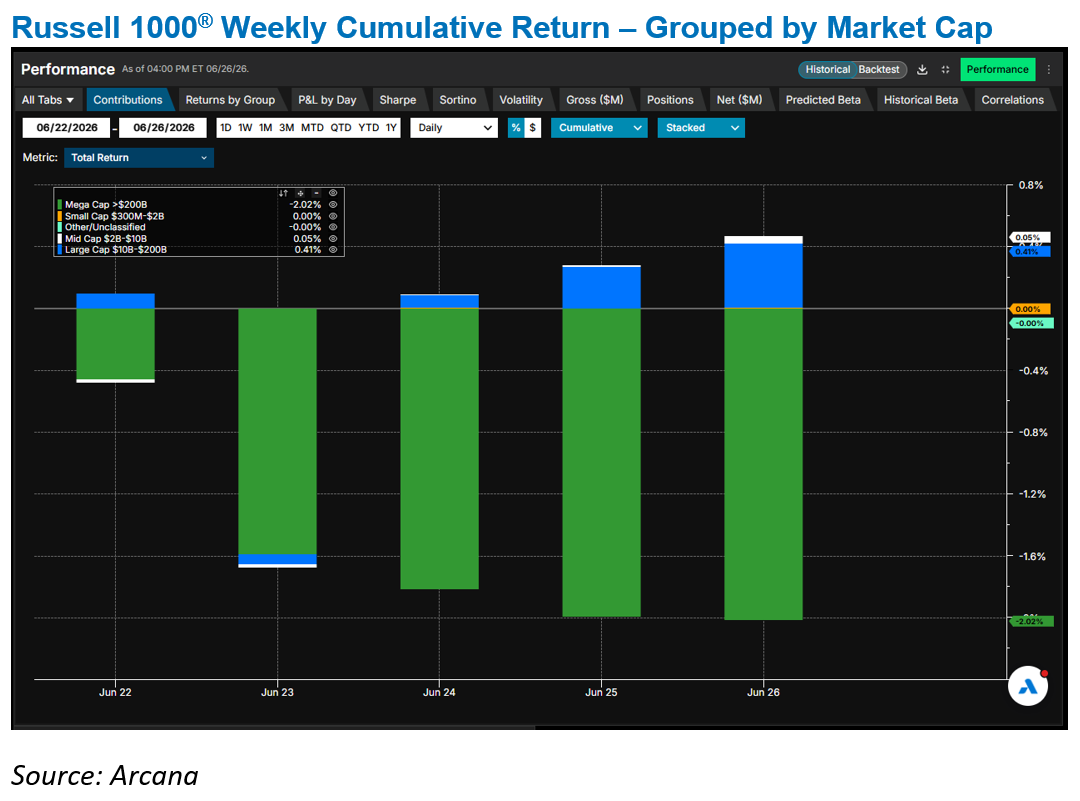
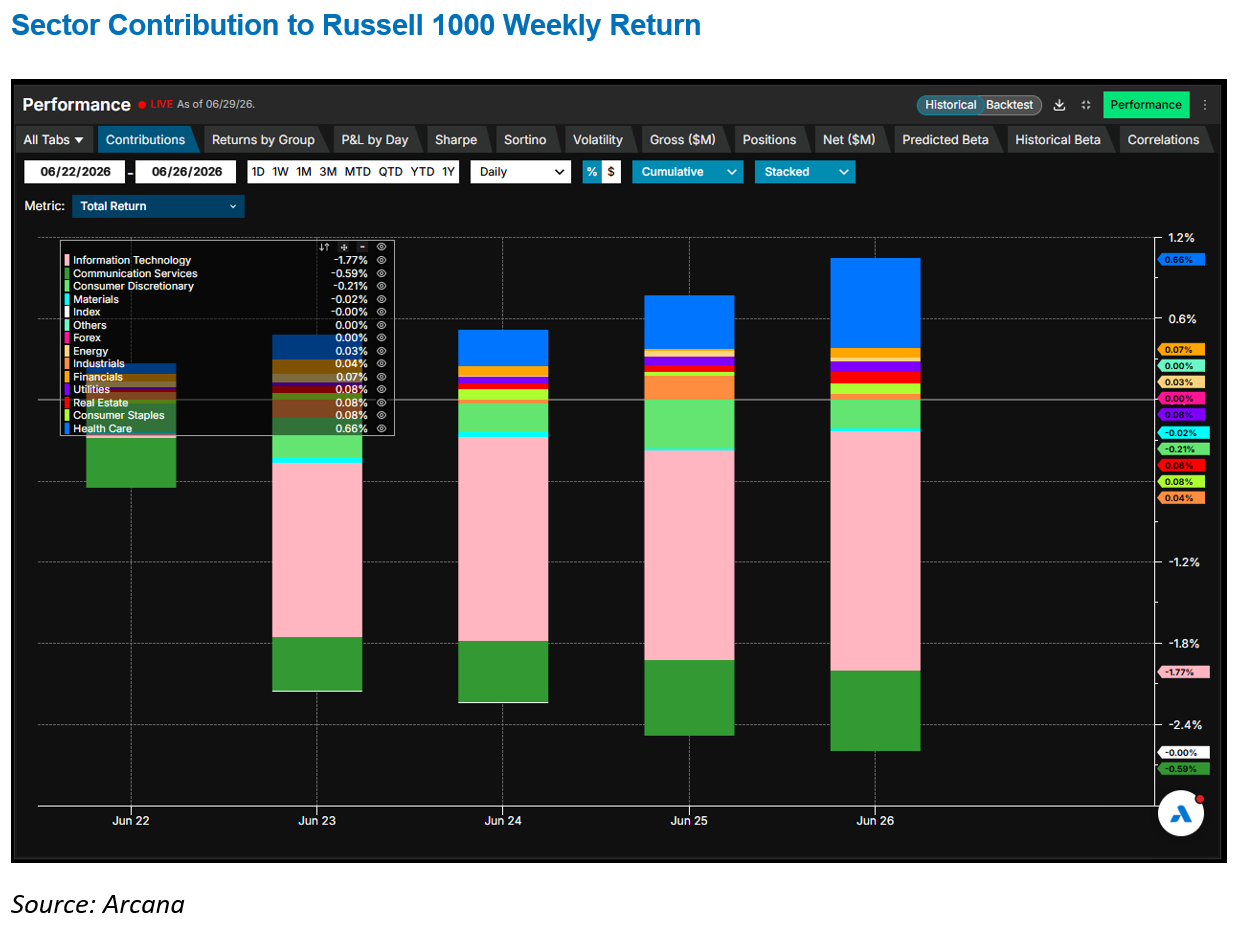
Last week’s tech-driven selloff weighed heavily on US equities, with the Russell 1000 falling about 1.65%. The decline, however, was narrowly concentrated. Mega-caps were almost entirely responsible, as just seven companies—together accounting for nearly one-third of the US market—pulled the benchmark lower: Google (-8%), Meta (-5%), Nvidia (-9%), Broadcom (-11%), Apple (-5%), Amazon (-5%), and Tesla (-5%). (Note that Alphabet has two share classes represented in the Russell 1000.)
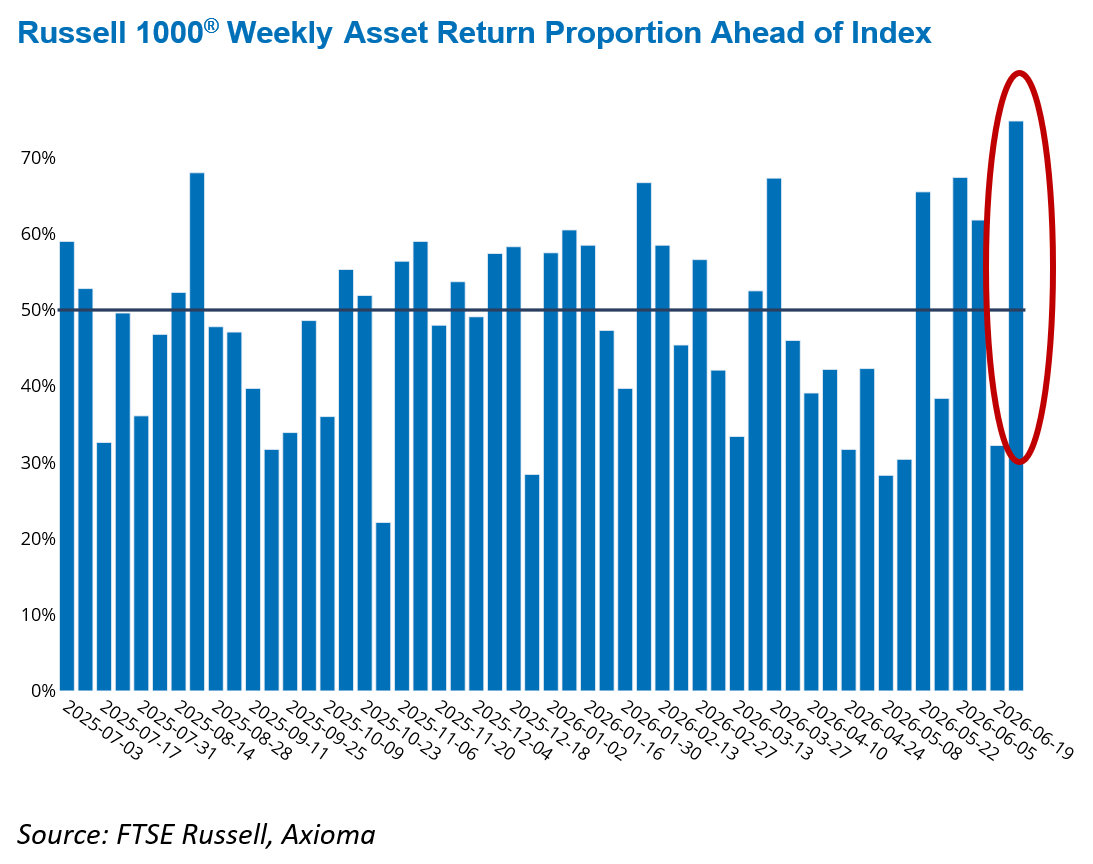
In aggregate, these names shaved roughly 2% off the index’s weekly return, while contributions from the remaining constituents broadly offset one another. This concentration is further underscored by the fact that 75% of Russell 1000 stocks outperformed the benchmark, with 670 companies posting gains during last week.
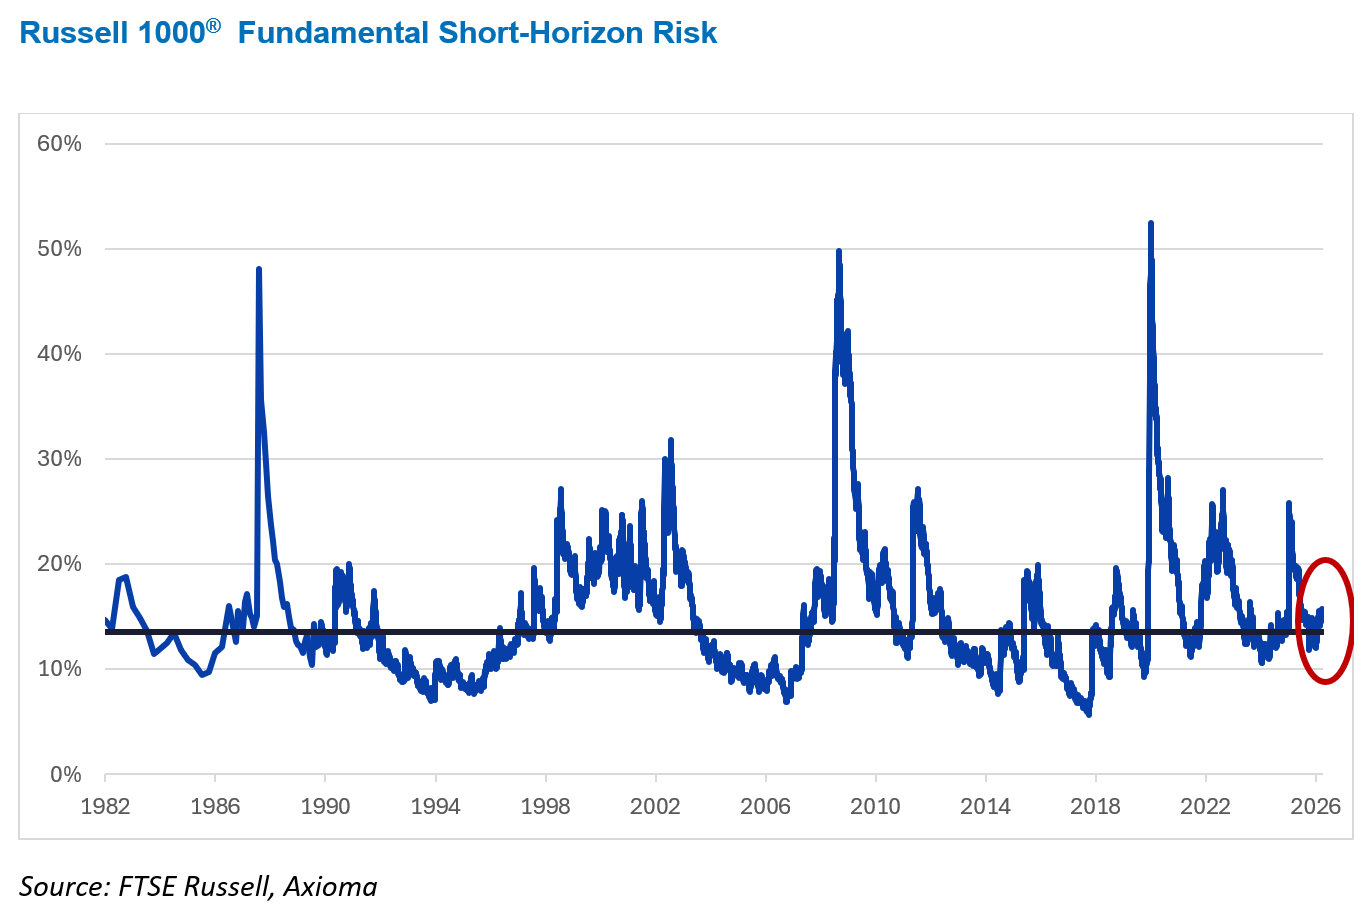
This dominance extends beyond returns and into risk. These eight mega-cap tech names now account for an extraordinary 43% of total US index risk, according to the Axioma US51 fundamental short-horizon model.
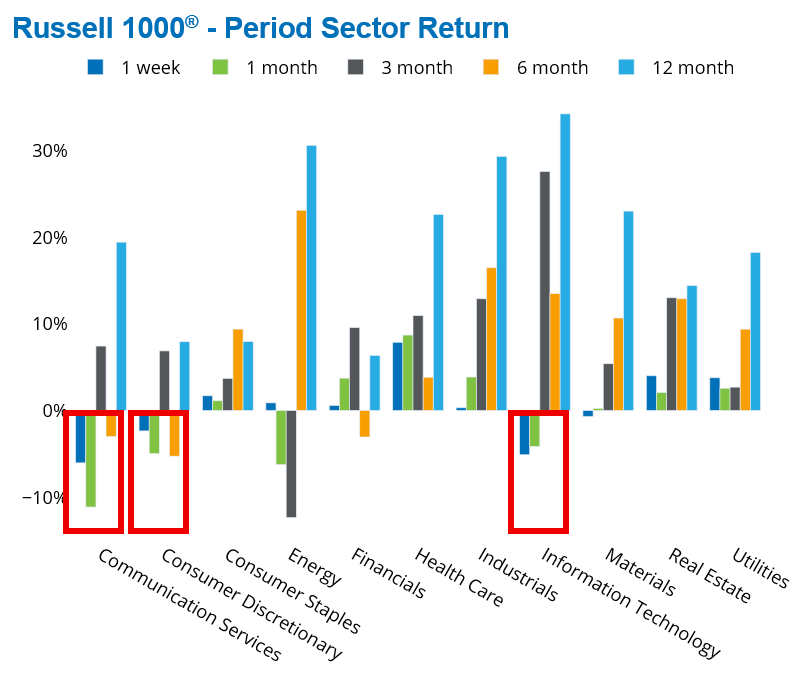
Importantly, “tech” in this context extends well beyond the Information Technology sector. Due to GICS classifications, these companies are spread across multiple sectors. As a result, the hardest-hit sectors—and the largest detractors—were those housing these mega-caps: Communication Services (Google, Meta), Information Technology (Nvidia, Broadcom, Apple), and Consumer Discretionary (Amazon, Tesla). Their performance highlights the outsized influence of a handful of names on both sector and aggregate index returns.
Looking ahead, SpaceX—now classified under Communication Services—entered the Russell 1000 after the close on June 26. Its addition will further reshape sector dynamics and is worth monitoring closely given the already elevated concentration.
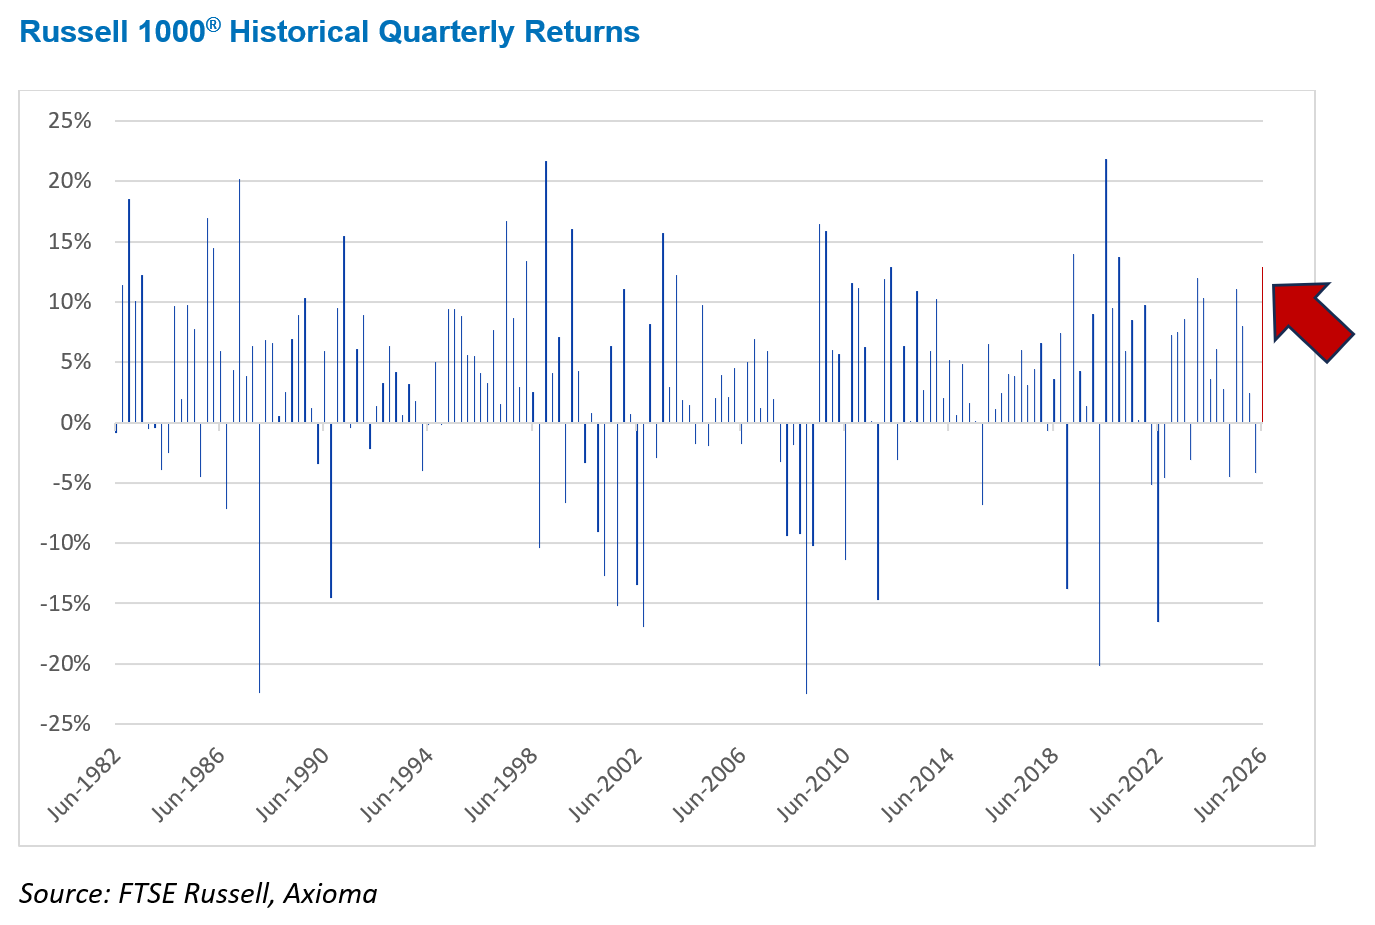
Despite last week’s setback, the broader market backdrop remains constructive. With gains exceeding 13%, the second quarter is tracking in the top decile of outcomes over the past four decades. Meanwhile, although risk has risen since the end of March, it remains only modestly above its long-term median and well below crisis-era peaks such as the Global Financial Crisis, Dot-Com bubble, Black Monday, or COVID.
The charts below are not included in the Equity Risk Monitors but are available upon request:
Tech weakness accelerates sector rotation, fueling dispersion
Weakness in mega-cap and semiconductor stocks stood in sharp contrast to strength across several defensive sectors, leading to pronounced dispersion in weekly performance. In fact, seven of the eleven GICS sectors within the Russell 1000 ended the week higher, signaling a meaningful rotation. Health Care (+8%), Real Estate (+4%), and Utilities (+4%) led the gains.
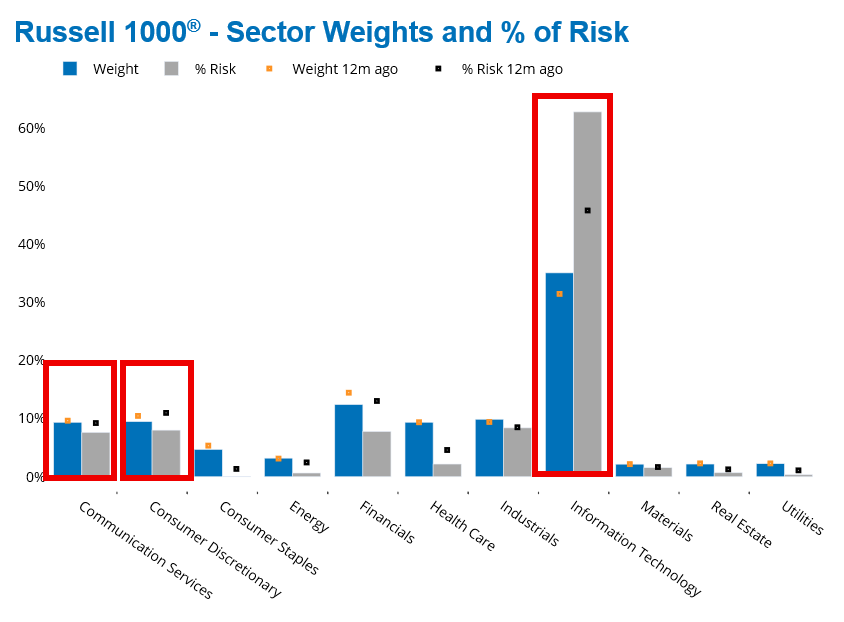
At the same time, the most volatile sectors—Information Technology, Communication Services, and Consumer Discretionary—remained the primary drivers of index risk, together accounting for roughly 80% of the total. Among them, only Information Technology contributed more to risk than its already substantial index weight; the others contributed less than their weights.
Conversely, Financials and Real Estate remained the least risky sectors, as predicted by the Axioma US51 fundamental short-horizon model.
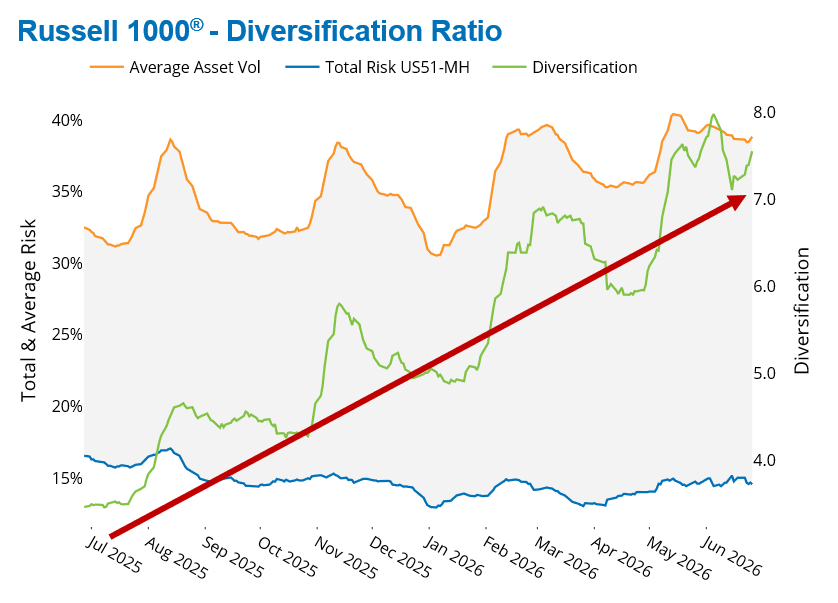
The massive rotation out of mega-caps is also reflected in lower asset-asset correlations and peak trading volumes. This divergence in individual stock performance pushed the Russell 1000’s diversification ratio sharply higher, to its highest level in several years. While individual stock volatility increased, the drop in correlations helped contain overall index risk.
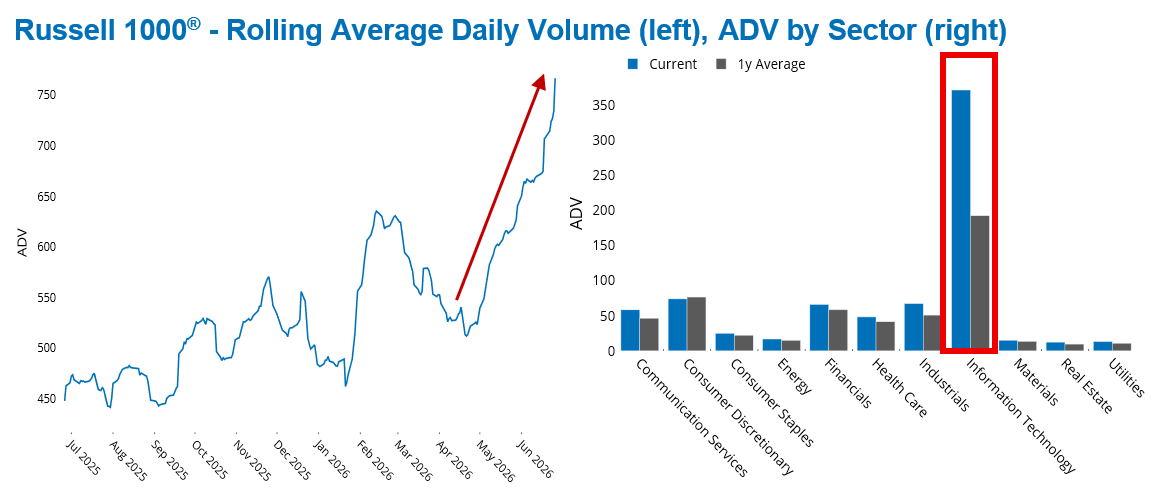
Trading activity reinforces this picture. Volumes in the Russell 1000 have been trending higher since May, with last week’s selloff accelerating the increase. Average daily volumes are now nearly 70% above levels seen at the start of the year. Information Technology—already the largest sector at roughly 35% of the index—saw volumes double relative to its one-year average. Most other sectors also experienced elevated activity, with the exception of Consumer Discretionary, where volumes remained below average.
Even more striking, Semiconductors accounted for 52% of Russell 1000 daily trading volume at the beginning of June, easing only slightly to about 49% by last Friday.
The persistence of this volume surge suggests that recent sector rotation is only part of the story. A natural question is whether the sustained rise reflects a broadening investor participation cycle—perhaps even a late-stage rush into the market reminiscent of FOMO buying. If so, one has to wonder whether there are enough new buyers left to support the trend. The increase in trading activity has been building for months and appears too prolonged to be explained solely by the latest bout of market repositioning.
The charts below are not included in the Equity Risk Monitors but are available upon request:
See charts from the Russell 1000 Equity Risk Monitor as of June 26, 2026:
Small Caps defy rate hike risk
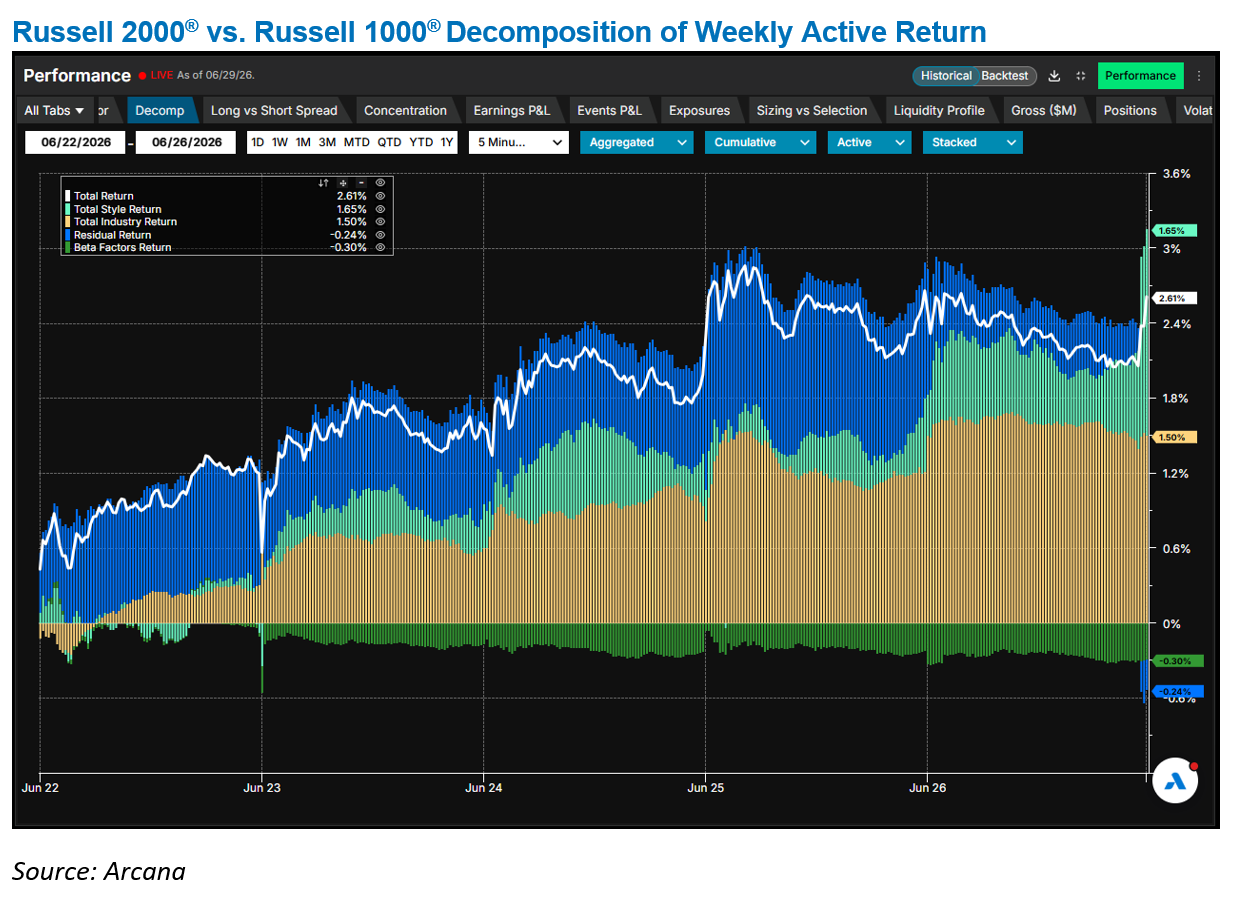
Capital also rotated into US small caps—an unexpected development given persistent inflation pressures and recent signals from the newly appointed Fed Chair pointing toward potential rate hikes. Smaller companies are typically more leveraged and therefore more sensitive to rising rates.
Nevertheless, the Russell 2000 gained 1% last week, outperforming the Russell 1000 by 260 basis points. This outperformance was supported by both industry and style effects. On the industry side, Biotech, Semiconductors, and Technology Hardware made the largest positive contributions to active returns. While Biotech delivered positive absolute returns, Semiconductors and Technology Hardware declined less sharply within the small-cap universe.
From a style perspective, Size, Crowding, and Short-Term Momentum were the primary contributors to excess returns. Notably, the Russell 2000 exhibits a strong positive active exposure to the Crowding factor, suggesting heightened hedge fund interest in small caps. This factor has posted significantly positive returns this month, which further supported the small cap outperformance.
Emerging Markets AI trade isn’t diversified either
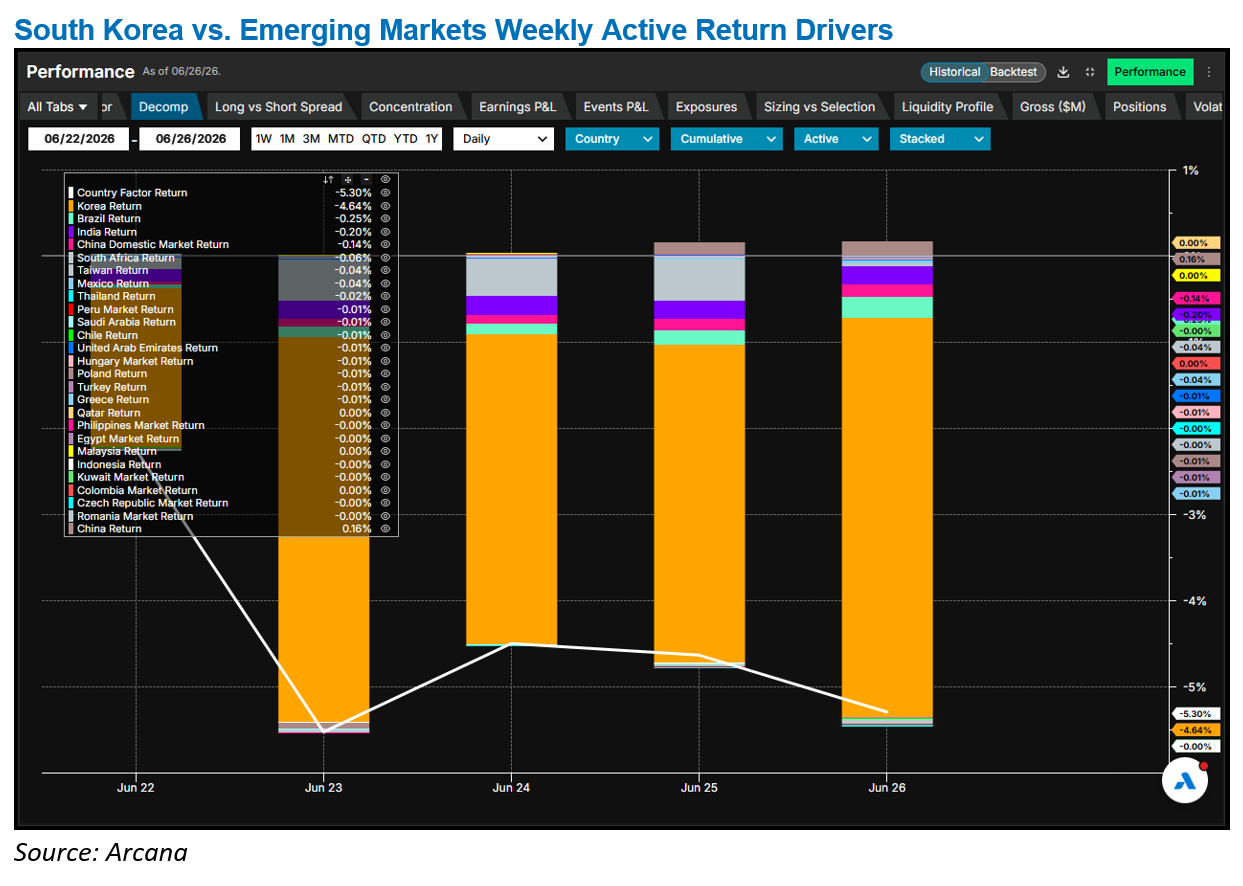
The carnage in chips stocks was felt globally and especially in Korea. The world’s best-performing country suffered a sharp setback (-6%), driven by declines in Samsung Electronics and SK Hynix. The drop was significant enough to trigger two trading halts during the week.
Concentration is a key factor. Samsung and SK Hynix together represent an unprecedented 60% of the Korean equity market and account for 74% of its total risk.
Last week, the Korean country factor alone explained the entirety of Korea’s underperformance relative to Emerging Markets, as revealed by the factor decomposition of returns using the Axioma Emerging Markets fundamental short-horizon model.
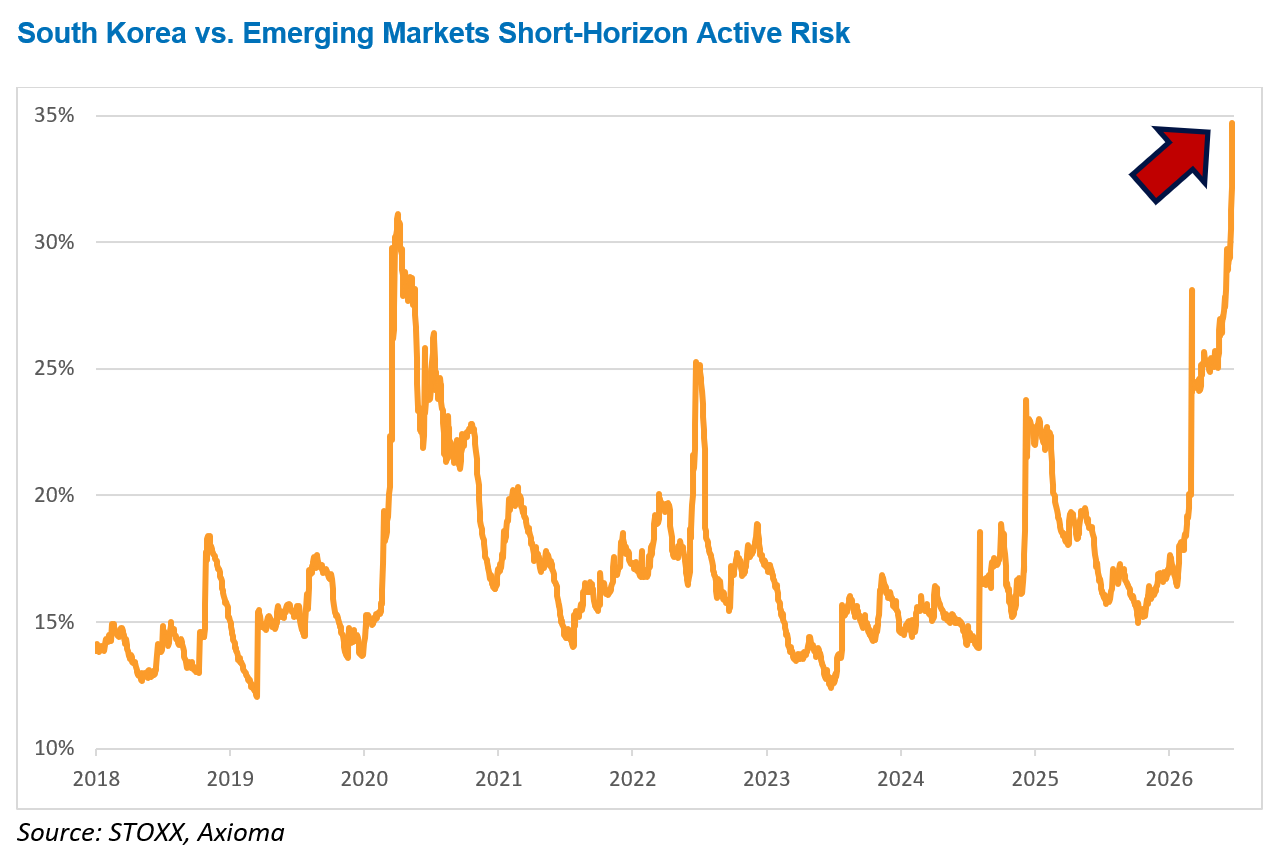
At the same time, Korea’s active risk versus Emerging Markets has surged this year, now exceeding levels seen during the COVID crisis. While active factor risk is approaching previous highs, active specific risk has already surpassed those peaks.
This has important implications for Emerging Markets indices and investors. In STOXX Emerging Markets, Korea represents nearly a quarter of the index and contributes 44% of total risk. Samsung and Hynix alone make up 15% of the benchmark and drive roughly one-third of its risk.
More broadly, STOXX Emerging Markets is significantly more concentrated than the Russell 1000, despite covering far more constituents across multiple countries. This concentration is driven by a handful of dominant names: Taiwan Semiconductor (12.7%), Samsung Electronics (8.2%), and SK Hynix (7%) which account for a substantial share of the index.
The effective number of stocks in STOXX Emerging Markets is just 32, meaning it behaves like a portfolio of 32 equally weighted names despite having over 2,400 constituents. By comparison, the Russell 1000 has an effective stock count of 74—low by historical standards, but still more than double that of Emerging Markets.
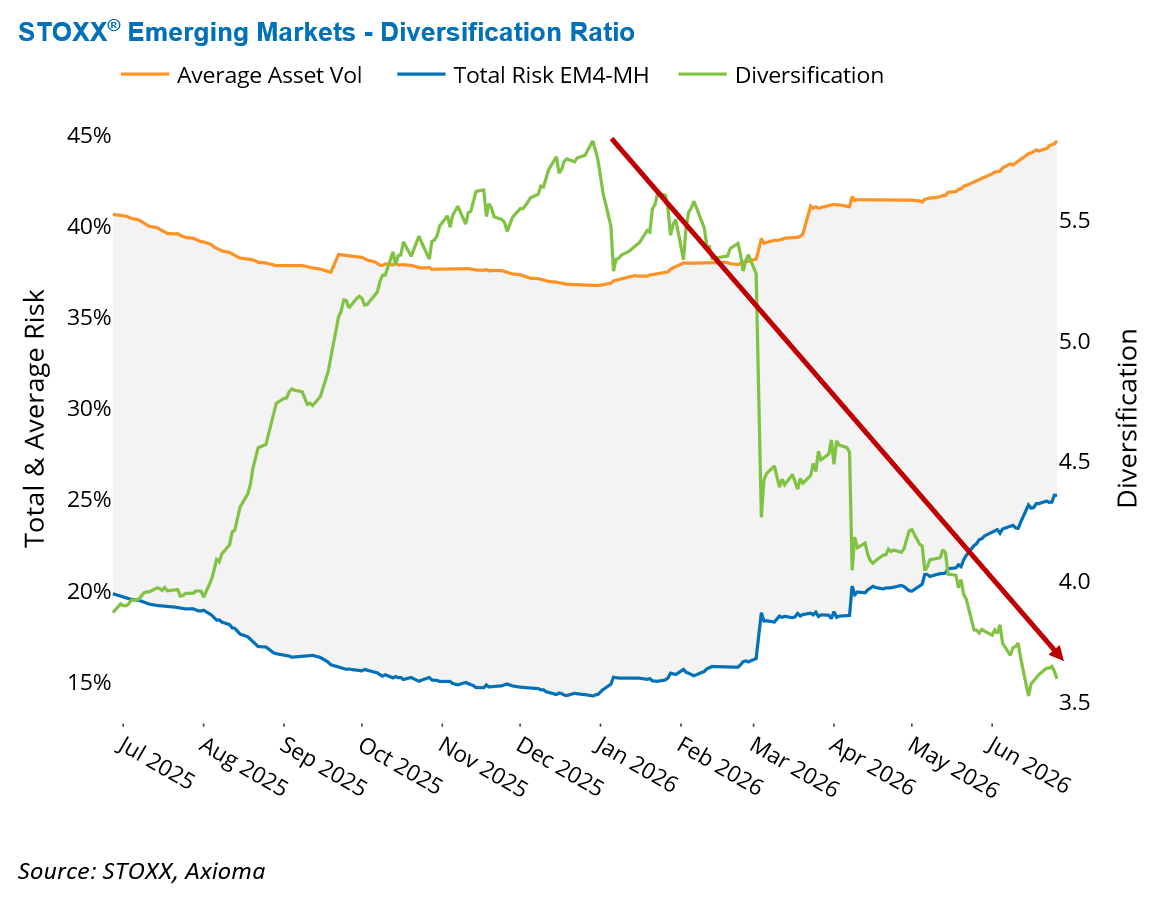
This contrast is further reflected in diversification trends. While the US market has seen improving diversification this year, Emerging Markets have moved in the opposite direction, with the diversification ratio declining to its lowest level in at least the past twelve months.
You may also like