
MULTI-ASSET CLASS MONITOR HIGHLIGHTS
WEEK ENDED JUNE 26, 2026
Global yields fall as diplomatic breakthrough eases energy and inflation fears
Global sovereign bond yields fell sharply in the week ending June 26, 2026, as diplomatic progress in the Middle East drove a significant decline in oil prices and, with it, a material easing of the inflation risk premium that had been embedded in global rates since the onset of the Iran conflict.
The trigger was a preliminary memorandum of understanding between the US and Iran, which outlined the terms of a ceasefire and the reopening of the Strait of Hormuz. With energy supply disruptions at the heart of the inflationary surge that had driven yields higher across all major markets since early March, the prospect of normalising oil flows quickly translated into lower breakeven inflation rates and a broad-based rally in government bonds.
The 10-year US Treasury yield declined by 8 basis points, with 5 basis points coming from a reduction in the same-maturity breakeven rate. The move in nominal yields happened almost entirely on Wednesday following the release of May PCE inflation data. The core PCE price index came in softer than expected, and the headline rate rose by less than anticipated, prompting a rapid repricing of near-term rate hike expectations. That being said, markets still expect at least one Federal Reserve rate hike this year, with a probability of around 60% of it happening as early as September.
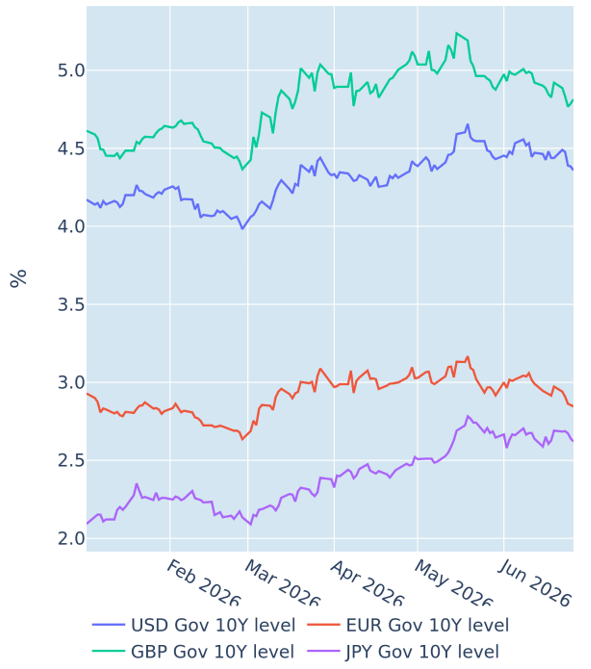
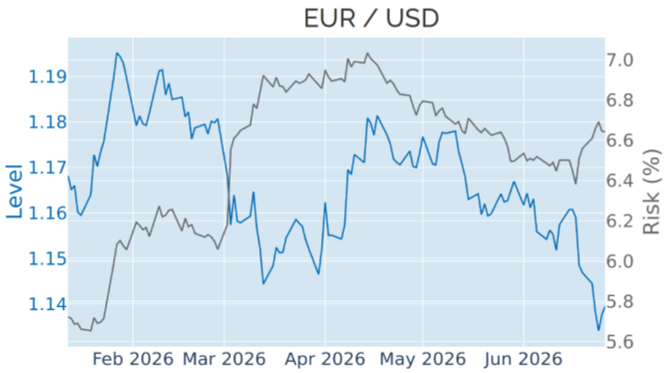
German Bunds recorded the largest move of the week, with the 10-year yield falling 13 basis points in the biggest weekly decline in more than a year. The rally was again mostly driven an 8-basis point drop in the breakeven rate, while shorter yields were depressed by a shift in ECB policy expectations. Eurozone flash PMI data released on Monday showed that private sector activity in Germany contracted at its fastest pace since 2024, while the broader euro area remained in contraction for a second consecutive month. ECB President Christine Lagarde reinforced the signal, indicating that the central bank saw no need for a more aggressive policy response to the Middle East shock and that there was no evidence of a 2022-style inflation surge requiring further forceful tightening. With growth weakening and the ECB signaling restraint, rate futures traders reduced the number of additional rate hikes anticipated over the remainder of this year to just one more. Meanwhile, the euro weakened to a 12-month low against the US dollar.
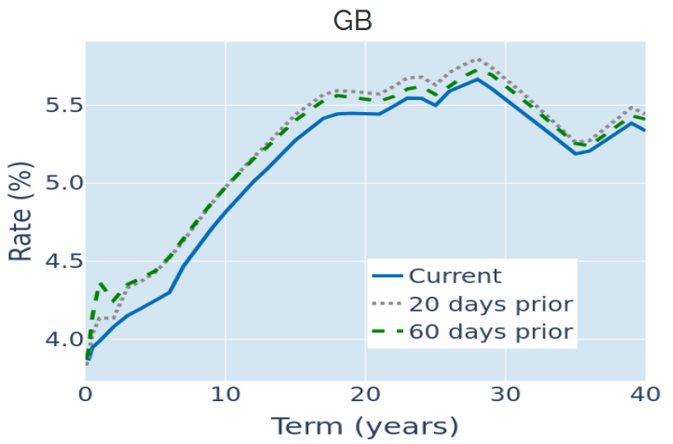
The UK market also saw a significant downward revision in monetary policy projections, following a weaker-than-expected services PMI release indicating that activity in the important sector contracted for a second consecutive month. Economists had predicted a return into expansionary territory, and traders halved the number of predicted rate hikes from two to one in response. The monetary policy-sensitive 2-year Gilt yield dropped as a result, while the 10-year benchmark ended the week 11 basis points lower.
Please refer to Figures 3, 4 & 6 of the current Multi-Asset Class Risk Monitor (dated June 26, 2026) for further details.
Lower equity volatility and cross-asset correlations reduce portfolio risk
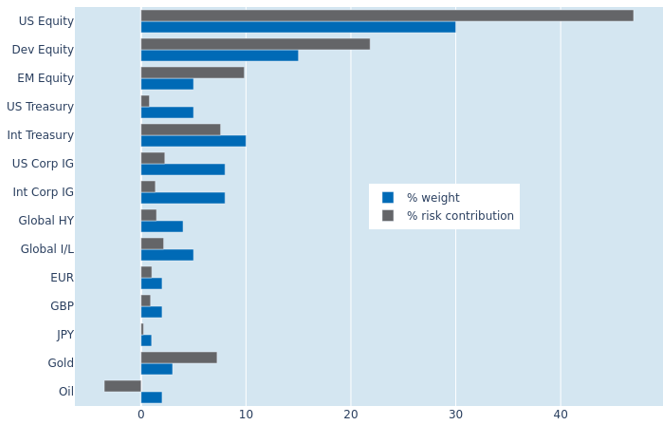
The predicted short-term risk of the Axioma global multi-asset class model portfolio eased back from 10.6% to 8.8% as of Friday, June 26, 2026, due to a combination of lower equity volatility and a weaker correlation of share prices with FX rates and bond returns. Non-US developed equities recorded the biggest reduction in their percentage risk contribution from 26.6% to 21.8%, followed by US stocks, which saw their share of total portfolio volatility shrink by 2.8 percentage points to 46.9%. Some of these benefits were offset by higher commodity risk, as a stronger co-movement between gold prices and exchange rates against the dollar led to a 2.2-percentage point increase in the precious metal’s risk contribution to 7.2%. Oil also experienced a lessening in its risk-reducing properties from -5.5% to -3.5%.
Please refer to Figures 7-10 of the current Multi-Asset Class Risk Monitor (dated June 18, 2026) for further details.
You may also like