

EQUITY RISK MONITOR HIGHLIGHTS
WEEK ENDED MAY 16, 2025
- Predicted risk has stabilized, but remains elevated for most major markets
- Tariff turmoil has impacted US factors, driving return magnitudes higher
- Sector weights and risk contributions shift across regions
Predicted risk has stabilized, but remains elevated for most major markets
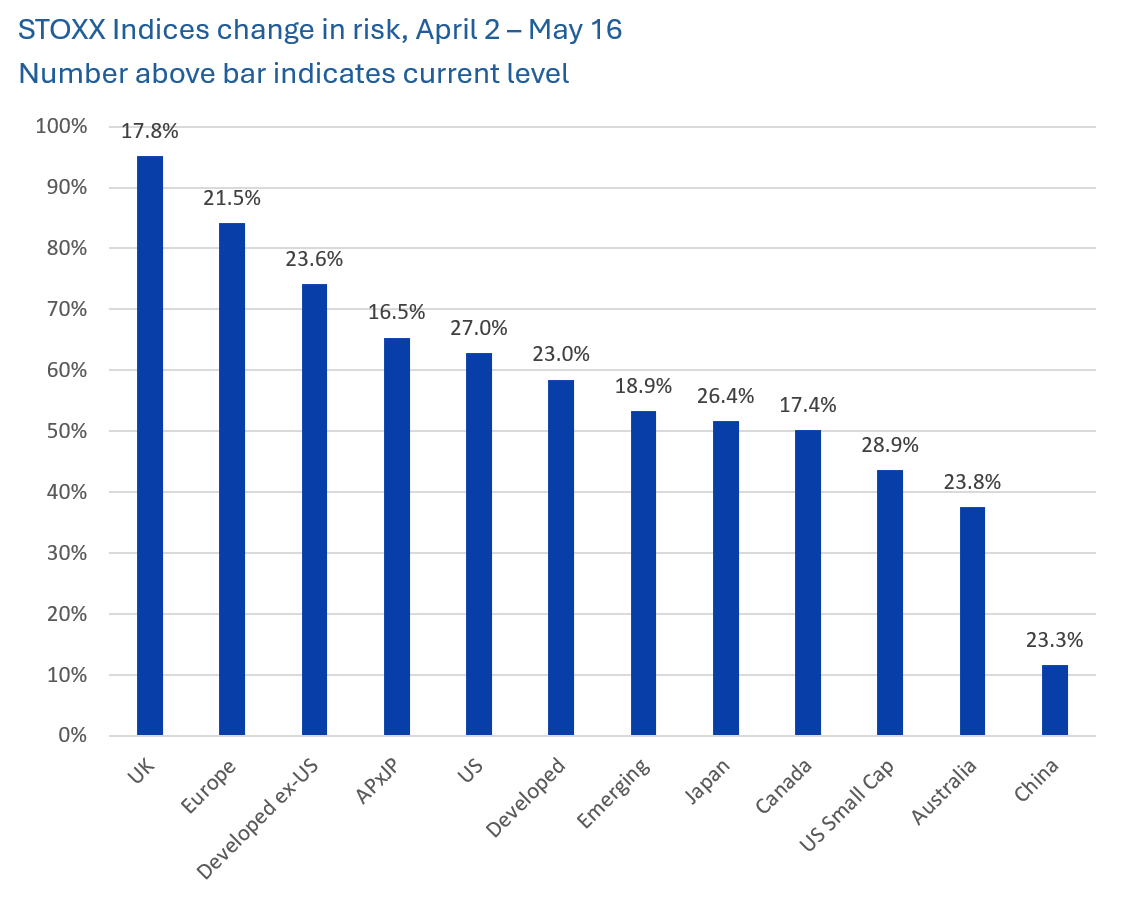
Predicted short-horizon risk for most major equity market indices has risen 35% to 95% since April 2, with the biggest increases in the STOXX® UK and STOXX® Europe 600 indices. Currently, the highest overall level of risk can be seen in the STOXX® US and STOXX® US Small Cap indices. Only STOXX® China A 900 was spared a double-digit increase in risk, although its current reading is in the middle of the indices tracked by the Equity Risk Monitors.
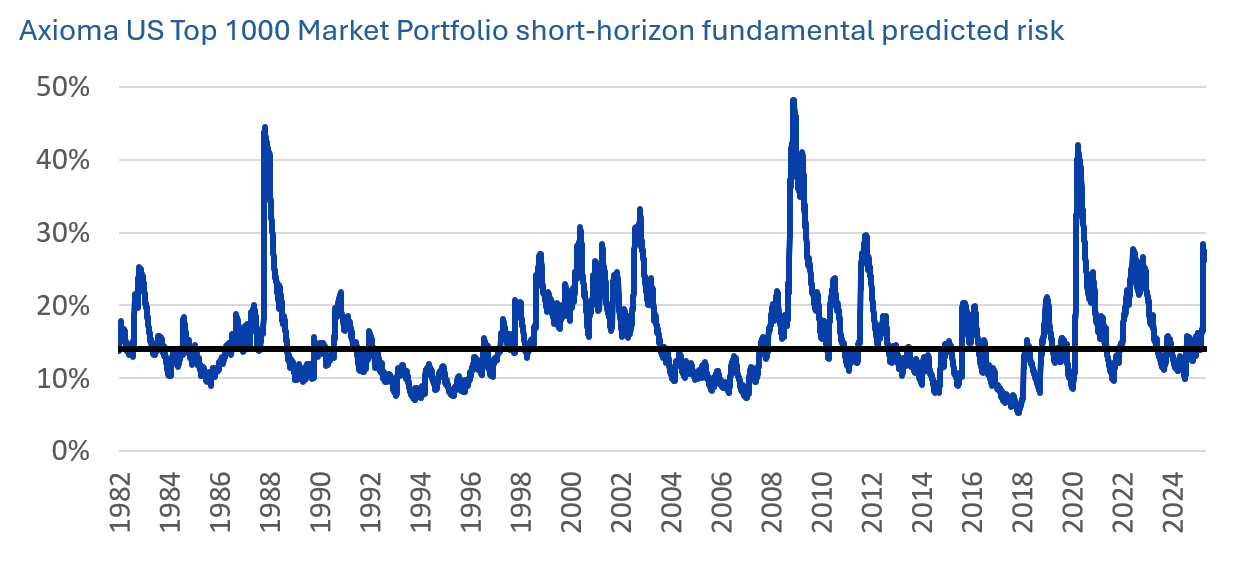
Predicted risk has stabilized since hitting recent highs in early to mid-April, but it has done so near historically high levels. US risk (as measured by the Axioma US Top 1000 Market Portfolio) on May 16, for example, was in the 94th percentile relative to its history back to 1982. Risk for the Axioma Developed Europe Core Market Portfolio fell in the 83rd percentile. In the US, the increase in predicted risk from April 2 to April 9, when it more than doubled, was one of the biggest five-day increases in the history of the US4 model. In addition, it has been exceedingly rare for volatility to stay elevated for so long (it is now 31 days and counting that risk has remained 50% higher than the recent low).
The continued market uncertainty surround tariffs and their impact on the economy leads us to believe that the high level of volatility is unlikely to subside any time soon, especially in the US and until tariff levels are finalized rather than just paused temporarily.
The following charts are not in the Equity Risk Monitors, but are available on request.
Tariff turmoil has impacted US factors, driving return magnitudes higher
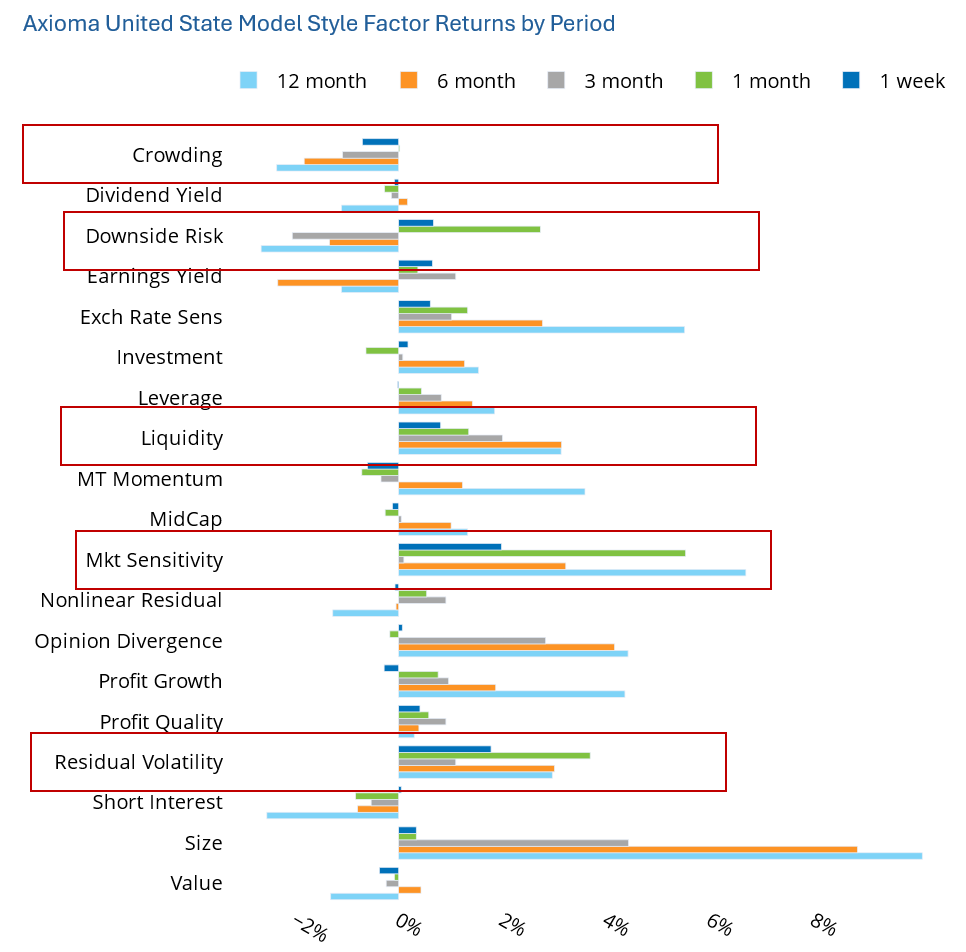
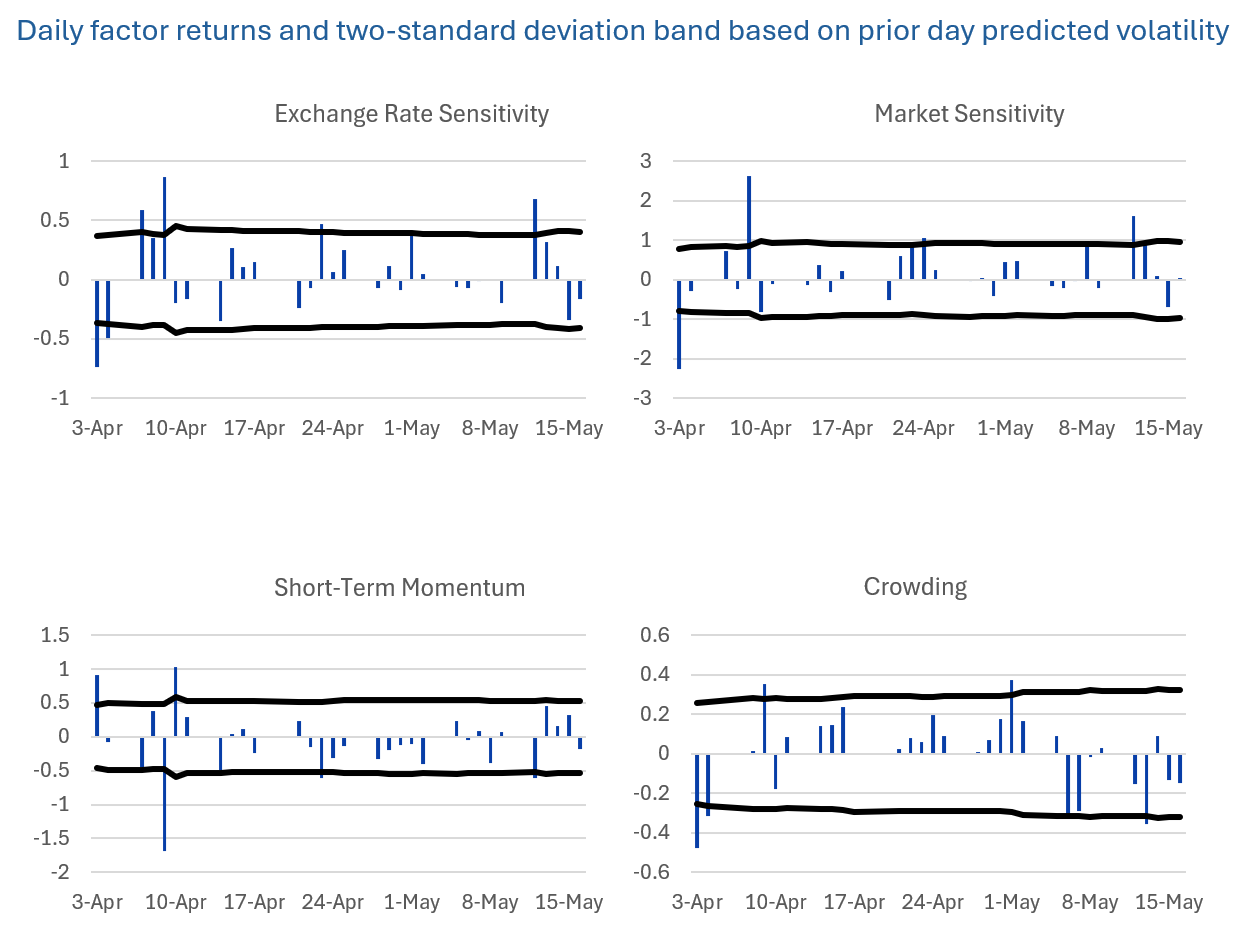
A few factors’ returns in the US5.1 model stand out over various recent periods. To define those returns that “stand out”, we look for those where the magnitude of returns is more than two standard deviations based on the risk prediction at the beginning of the period.
Only last week, Market Sensitivity posted a return of just under 2%, bringing the return for the last month to 5.5%. The magnitude of these returns is well above average. Similarly, Residual Volatility has seen a highly positive return over the past week and month (1.8% and 3.7%, respectively). Downside Risk, with one of the most negative long-term average returns among all the US5.1 factors also performed outside a two-standard deviation range over the past month with a return of 2.7%, although over the past three, six and 12 months its return has been negative. These recent high positive returns are also unexpected, as market volatility remains high and uncertainty reigns. Under those circumstances we might expect to see a flight to safer, lower beta and lower volatility stocks. However, the returns reflect investor optimism about a resolution to the tariff uncertainty as well as some favorable economic news, and suggest the market is not troubled by the high volatility.
Not all factor returns signal optimism, however. Investors did seek names with higher Liquidity. Returns for that factor were larger than expected over the past week, month, three months and six months.
Crowding, with a positive long-term risk premium, had a tough week last week, although it had been faring quite well since April 3.
See chart from the United States (US5.1) equity risk monitor
This relative abundance of higher-magnitude-than-expected returns led to two questions for us: 1) has the recent turmoil in markets led to factor returns in unexpected directions (i.e. in the opposite direction of the long-term average) more broadly, even if returns were within a two-standard deviation band, and 2) were there more “big” days immediately after “Liberation Day”, or have return magnitudes exceeded expectations more recently. Big returns may trigger portfolio rebalancing to bring active risk in line with portfolio mandates, but are they always necessary?
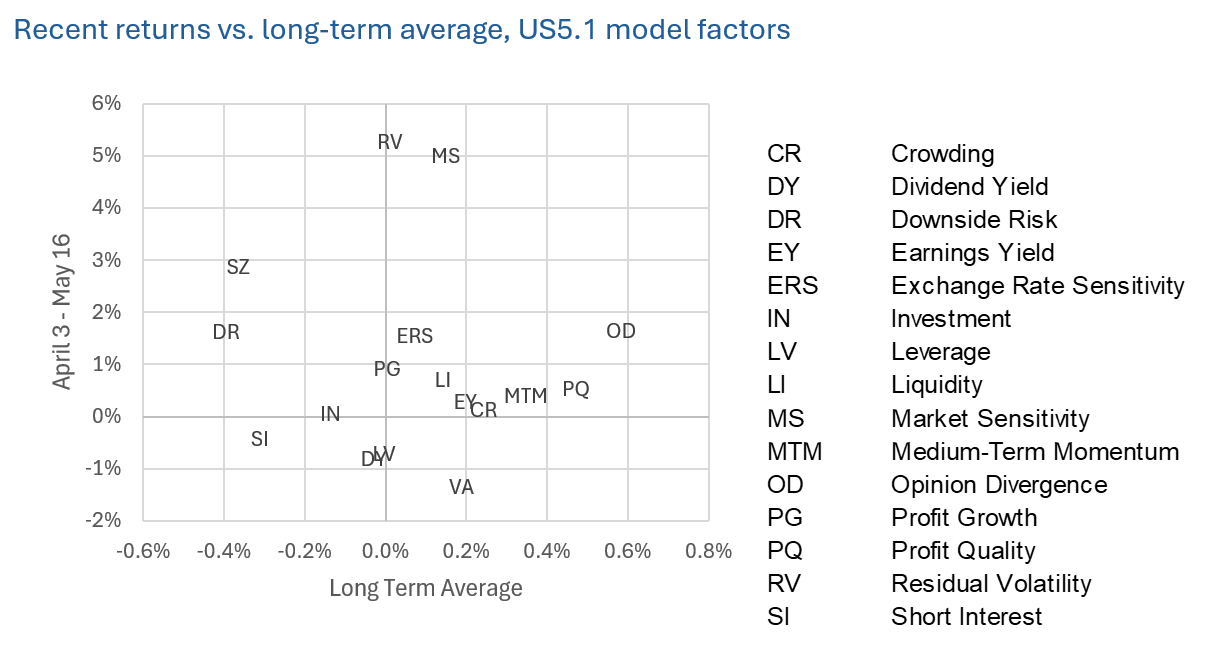
To answer 1) we looked at returns from April 3 through May 16, and plotted them against the long-term average 31-day return. This scatter plot shows that there were few factors that “misbehaved” over this period. Size and Downside Risk produced unusually positive returns when their long-term premia are negative, whereas Value has faltered recently when it has a positive long-term premium. Size (with the highest predicted volatility of all US5.1 factors) and Value (where current predicted volatility is at the low end of its 12-month range) both had returns well within the two-standard deviation range, so of these miscreants only Downside Risk’s returns fell outside expectations set by the risk model.
The following charts are not in the equity risk monitors, but are available on request.
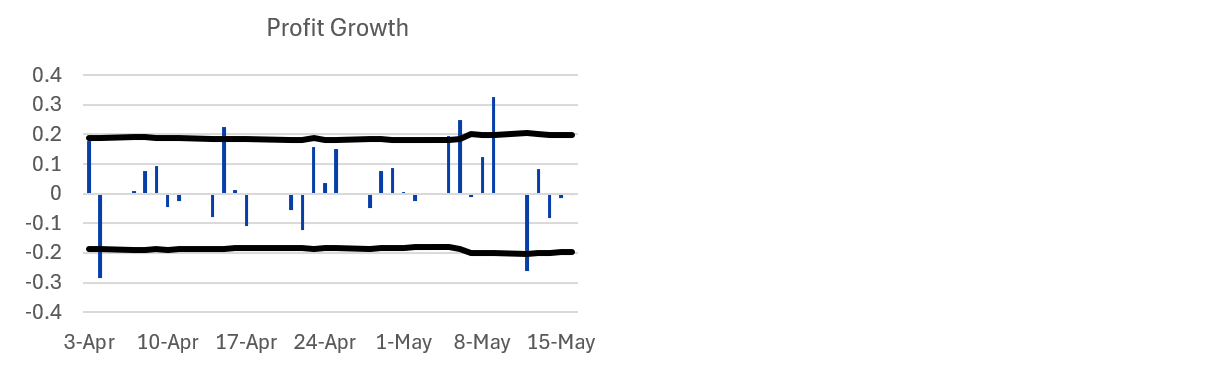
To gain insight into our second question we looked at plots of daily returns with lines showing the two-standard deviation bands. Every factor breached the limit more often since April 3 than over the long term (when they should remain within the bans about 96% of the time). Exchange Rate Sensitivity, Market Sensitivity, and Short-Term Momentum had the highest frequency of breaches in April, while Crowding and Profit Growth overran the bounds in May to date. (For brevity we show only those factors. A complete set of charts is available on request.) No factor showed consistently high-magnitude daily returns over the full April-May period.
Sector weights and risk contributions shift across regions
While high magnitude factor returns may trigger the need for rebalancing, so will big changes in sector weights and especially their contributions to risk.
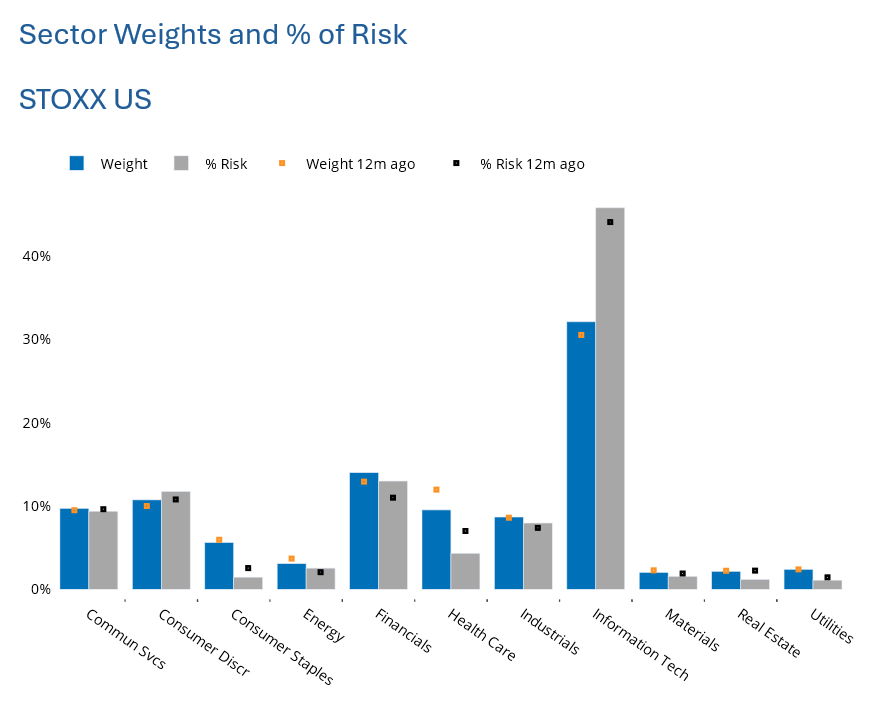
The STOXX US Index continues to be dominated by Information Technology, in terms of both weight and contribution to risk (as defined by the Axioma US4 model). Both metrics are slightly higher currently than they were a year ago, and at 46%, the sector’s risk contribution is substantially higher than would be expected given the 32% weight. Financials’ weight and risk contribution are also a bit higher than they were a year ago. In contrast, Health Care accounts for less weight and risk than it did a year ago, while the gap between them has widened, making Health Care even less risky relative to its weight than it was last year. Overall, however, the sector weights and risks in the US have been relatively stable.
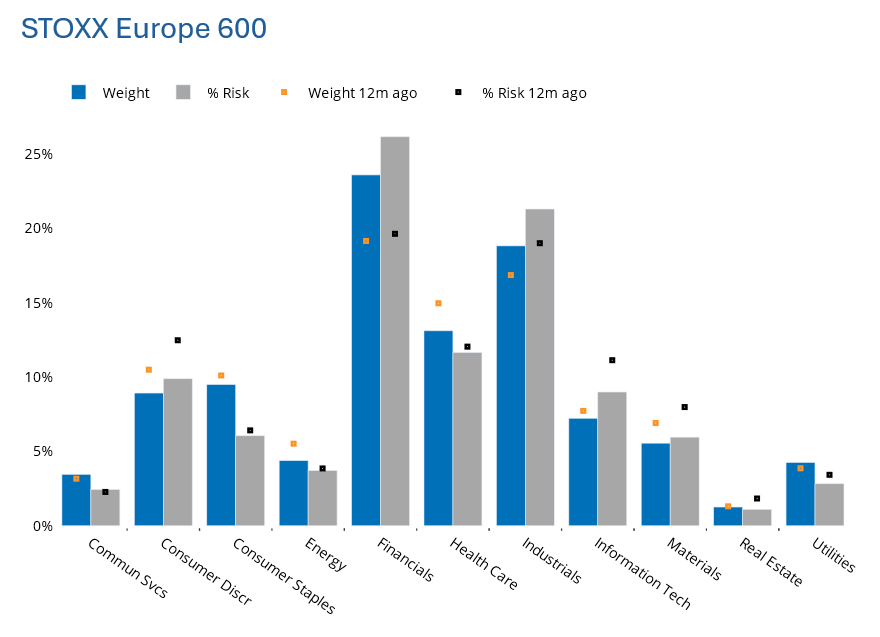
In contrast, Financials’ weight in the STOXX Europe 600 has increased by more than four percentage points, and its contribution to risk (according to the Axioma EU4 model) is up 6.5 percentage points, meaning the gap between risk contribution and weight has also widened substantially. In addition, Financials is the dominant sector. Industrials’ weight and risk both rose by around two percentage points, and the sector is second in terms of its index dominance. Those sectors’ gains were also Health Care’s losses in Europe. And while Info Tech’s weight declined slightly, its contribution to risk fell even more.
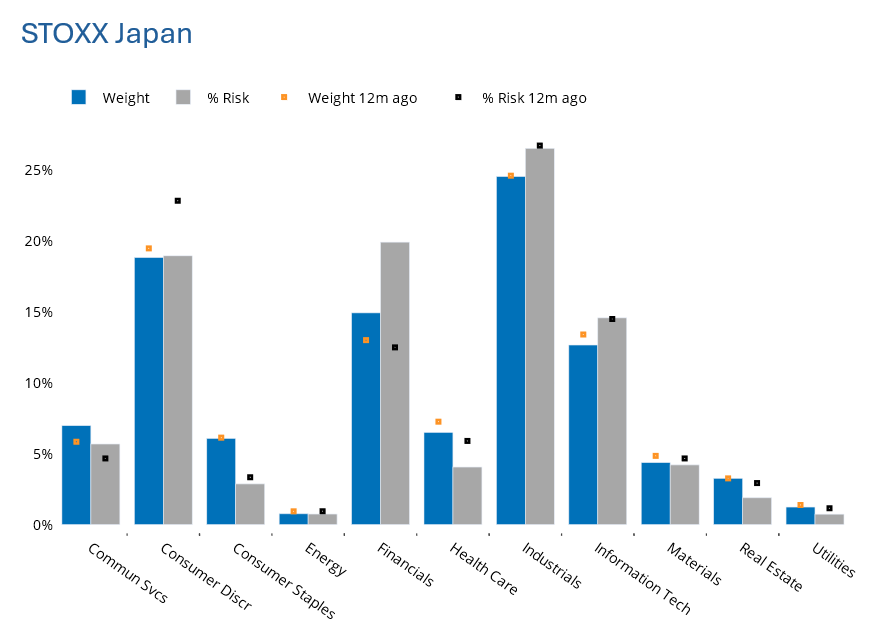
In STOXX Japan, while Financials’ weight increased about two percentage points, the sector’s contribution to risk (per Axioma’s JP4 model) rose more than seven percentage points, creating a substantially wider gap between weight and risk, and likely leading to changes in active risk for managers taking sector bets. This increase in risk contribution was the biggest we observed among the four markets we looked at. The increase in Financials’ risk contribution in Japan was met with a sharp decrease in the weight-risk gap for Consumer Discretionary; this is interesting, as one might have expected tariffs to drive risk in that sector higher, not lower.
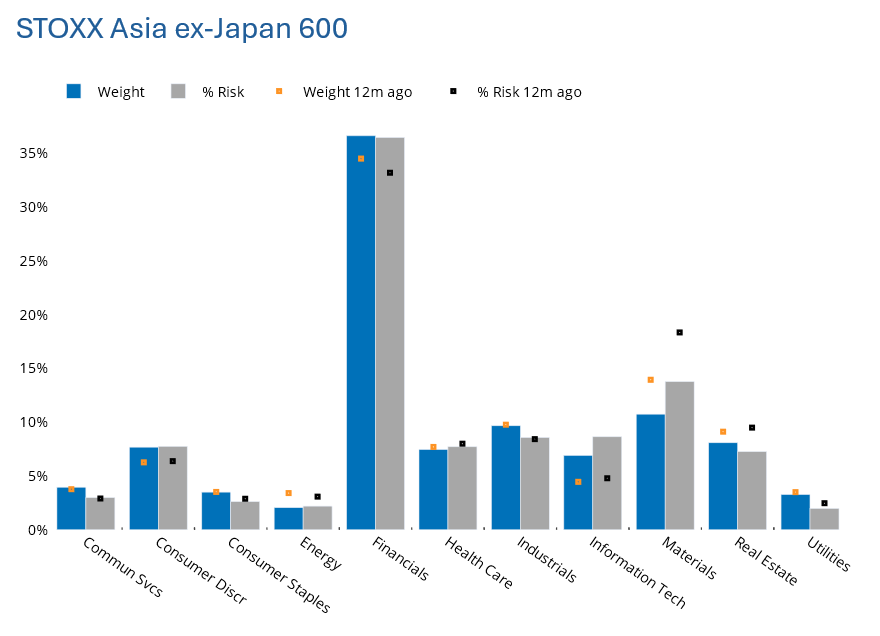
Finally, STOXX Asia ex-Japan 600, was already highly dominated by Financials, but over the past year their weight and risk contribution increased. This was also the case for Information Technology. At the same time, Materials’ weight and risk contribution fell and the gap between the two narrowed slightly.
See charts for the STOXX US, STOXX Europe 600, STOXX Japan and STOXX Asia ex-Japan 600 equity risk monitors as of May 16, 2025
You may also like

.png%3Fh%3D1080%26iar%3D0%26w%3D1920&w=3840&q=75)
