EQUITY RISK MONITOR HIGHLIGHTS
WEEK ENDED JUNE 20, 2025
Introducing the newest equity monitor, focusing on Axioma’s new Worldwide (WW5.1) models applied to the STOXX® Developed World Index
- Comparing WW4 and WW5.1: Benchmark risk rose similarly but fell faster using WW5.1 model
- Individual country risk levels: New chart highlights risk contribution from country selection
- Introducing the multiple Non-linear factor interpretations
Last month we released the Worldwide instance of the Axioma version 5.1 risk models. This latest set of models includes new factors, changes in definition for others, and a cross-sectional volatility (CSV) adjustment that emphasizes recent market conditions. The statistical model versions now incorporate 40 factors (versus 20 in the preceding WW4 versions) to assess even more statistical sources of risk. As for the currency model, which stands separately from the other components, four currencies were added to the estimation universe and, importantly, incorporated in the CSV adjustment. For more information on the new Worldwide model, please see here.
This new Equity Risk Monitor comprises all the same charts as the other monitors, with one change. Rather than showing the 12-month range and current level of industry risk (chart 21) we show the same for the major developed market countries. Charts that are not dependent on the risk model (for example benchmark returns or asset dispersion) will of course be exactly the same as we produce for the WW4 model. Sector returns may be slightly different as WW5.1 uses the latest GICS classifications and a few companies changed sector.
Current observations:
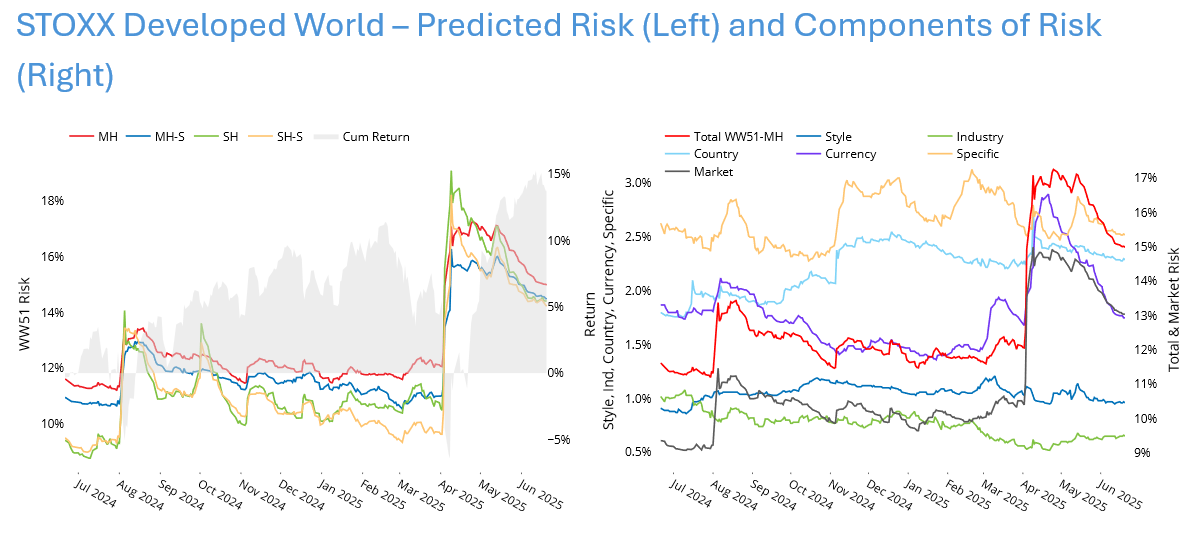
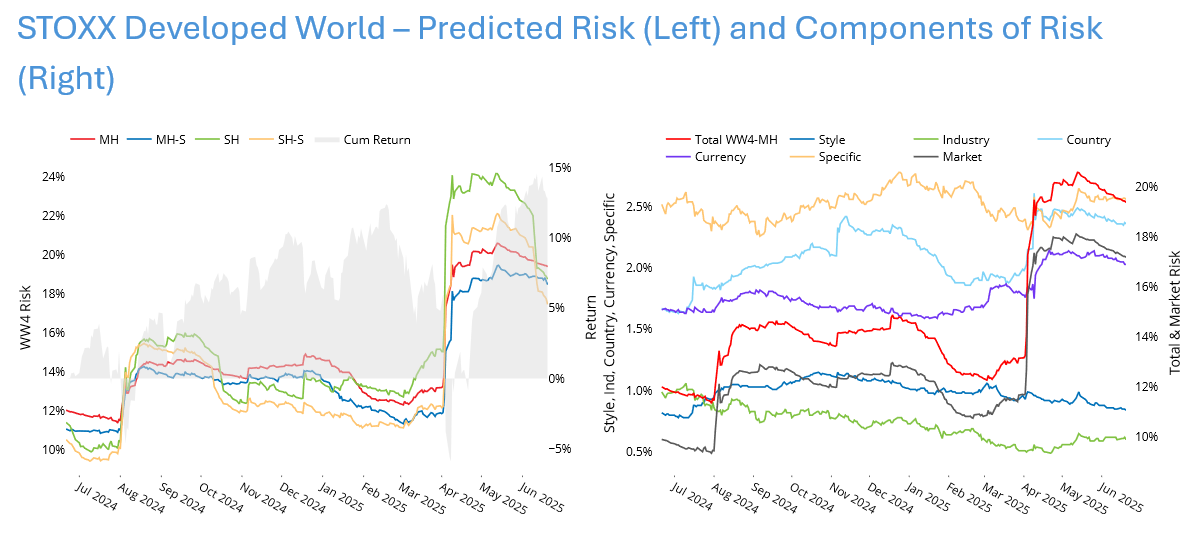
Comparing WW4 and WW5.1: Benchmark forecasted risk rose similarly but fell faster using WW5.1 model
Index risk, as measured by all four WW5.1 model variants, jumped suddenly and substantially on “Liberation Day”, with Market, Country and Currency risk leading the way. This jump was likely to have surprised managers making country bets more than those with currency allocations: Country risk at its April peak was in the 97th percentile relative to its history since 2012, whereas the level of Currency risk, even with the big jump, was about average.
Although risk has fallen from the peak a few days after the jump it remains at a higher level than it was for the nine months leading up to early April. Note that risk has fallen more rapidly in WW5.1 as compared with WW4, likely a result of the quicker reaction from the CSV adjustment. The biggest proportional decline from April 9 to June 20 was in WW5.1 Currency risk, followed closely by WW5.1 Country risk. Interestingly, WW5.1 Industry risk actually increased a bit over the same period, although the overall level of risk remained lower than it was earlier in the 12-month period.
See charts from the June 20, 2025 STOXX Developed World (WW5.1) Equity Risk Monitor
See charts from the June 20, 2025 STOXX Developed World (WW4) Equity Risk Monitor
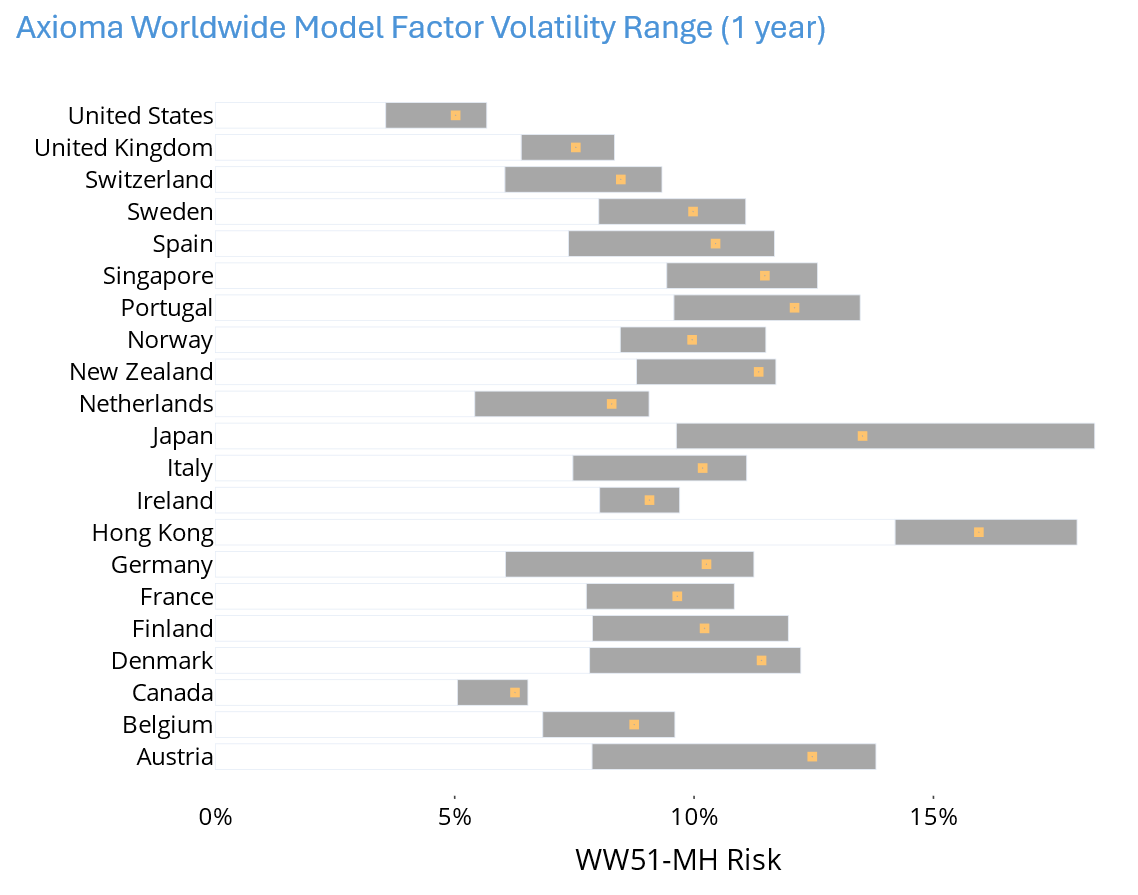
Individual country risk levels: New chart highlights risk contribution from country selection
As we often note in our quarterly Insight webinars (you can sign up here for the upcoming one on July 8), country risk is risk over and above that of all the other model factors and we sometimes call it extra-market risk. It can be thought of as tracking error of the country to the investment universe.
Clearly, individual country risk is important to those making country bets. We can see in the chart of country volatilities that they can vary widely. Japan’s country risk, for example, ranged from about 9% to over 18% over the last 12 months, and its current level is right in the middle of that range. Still, the current level is exceeded only by that of Hong Kong.
Japan has by far the widest range of country volatilities. The US, in contrast, saw a volatility range between about 3.5% and 5.6%. Canada and Ireland had similarly tight ranges. Country risk for most developed market countries hit the high end of the range on or about April 9, corresponding with the overall high aggregate country risk. One lesson here is a bet on Japan requires higher conviction than, say, a bet on Canada, and will lead to higher portfolio tracking error.
See chart from the June 20, 2025 STOXX Developed World (WW5.1) Equity Risk Monitor
Introducing the multiple Non-linear factor interpretations
As noted, the new global model has several new style factors (some introduced in the US5.1 model) as well as reformulations of existing factors. WW5.1 has three Non-linear factors, where stocks are divided by region.
This week we focus on these Non-linear Factor Structure factors, but will certainly look at other factors in the next weeks and months, as well as in our quarterly webinars.
Most of the standard model factors assume linearity – e.g. that those with the highest Downside Risk (also a new factor, by the way) will be riskier than the next-highest, which in turn are riskier than the lowest. Non-linear Factors recognize that this linear structure may not always hold. For example, small stocks with high Downside Risk may be riskier than small stocks with low Downside Risk, but the same may not be true in the universe of larger stocks to the same degree. Hence, we look at a cross-term that is Downside Risk x Size.
In building the model we measure these non-linearities by taking cross-terms of all the factors as well as squaring and cubing them to see how the extreme exposures look versus those in the middle, and we do this for US, Developed Markets ex-US and Emerging Markets stocks separately, as these markets behave differently. The factor Non-linearities are re-estimated once a year for the medium-horizon model and quarterly for the short-horizon, although the dominant Non-linearities can persist. For example, Downside Risk x Size has dominated the Non-linear structure for Developed Markets ex-US for many years.
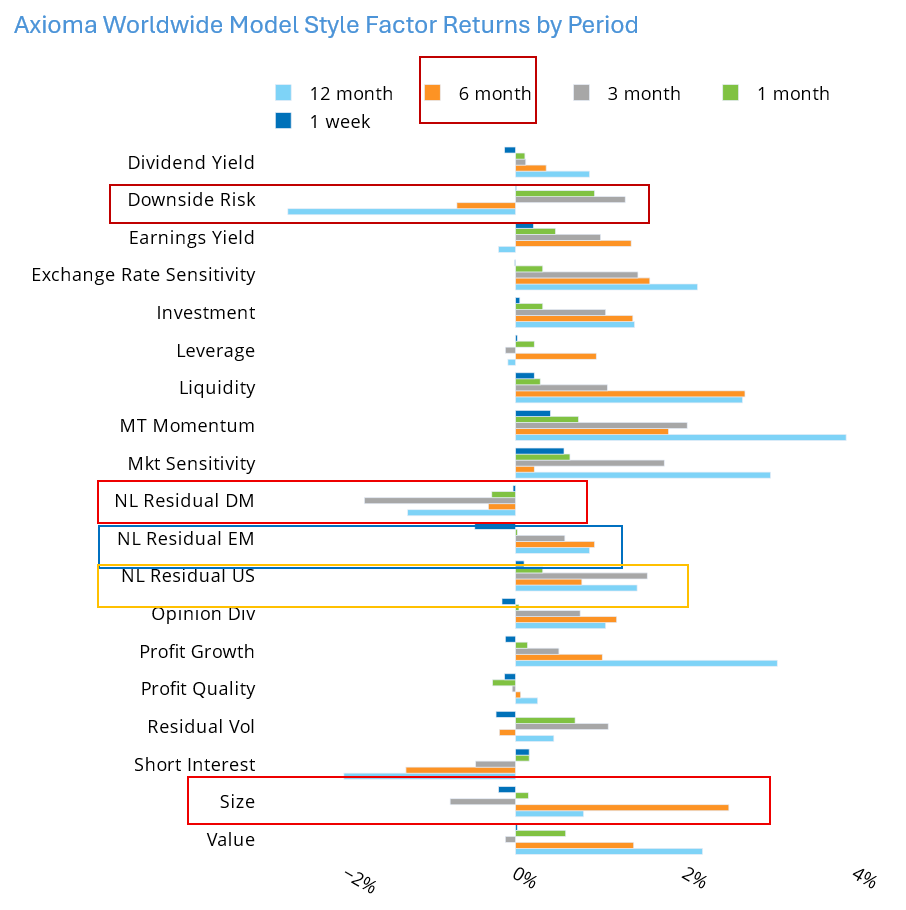
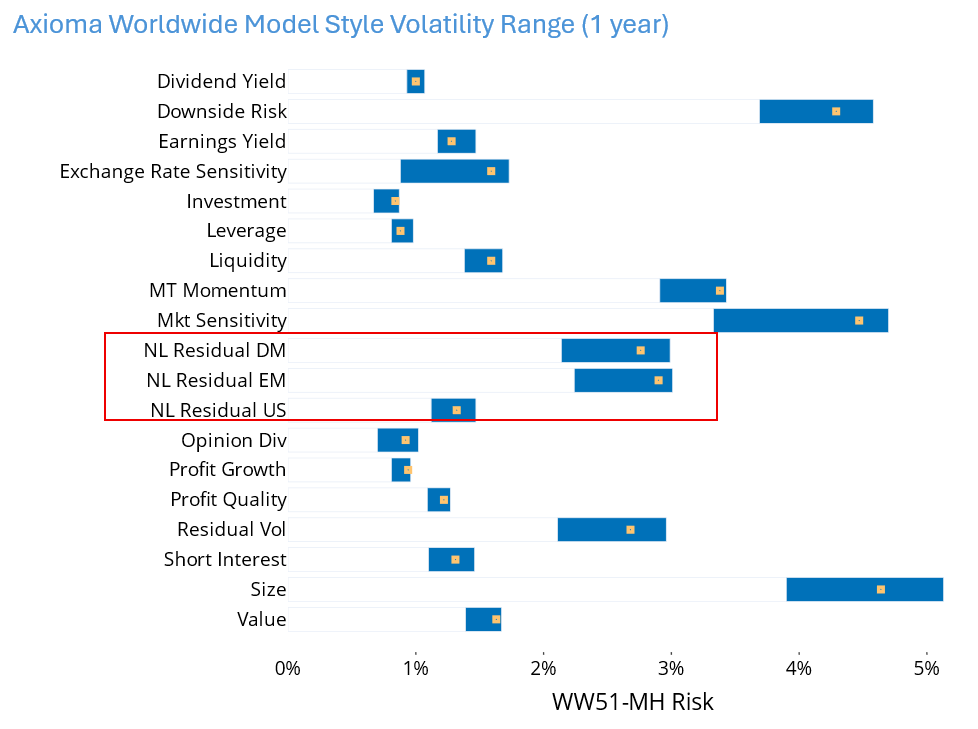
Interpretation of exposures and returns: When we look at the realized six-month performance of the Non-linear Residual Developed Markets (“NL Residual DM”) factor we see that it is negative. Over the same horizon standard Size turned in a positive return, while standard Downside Risk had a negative return. What this tells us is that high Downside Risk small-cap names did even more poorly than expected; it was likely higher-risk larger names that drove performance of the Size factor.
The Non-linear factor in Emerging Markets (“NL Residual EM”) is also dominated by Downside Risk x Size. Here, however, the Non-linear factor return for the past six months was positive. This means that Large-Cap Emerging Markets stocks with low Downside Risk performed well, while the other categories (small, low risk; large, high risk and large, low risk) all fared relatively worse.
In contrast to the Non-linear factors outside the US, the US Non-linear factor is dominated by the Size^2 and Size^3 term, both of which have positive exposures. In other words, risk in the US is concentrated in the largest of the large and the smallest of the small names, with relatively less risk in the middle. Combining this exposure with the positive Size return over the past six months means that while the mega-caps did fairly well, it was really the smallest of the small names that got clobbered.
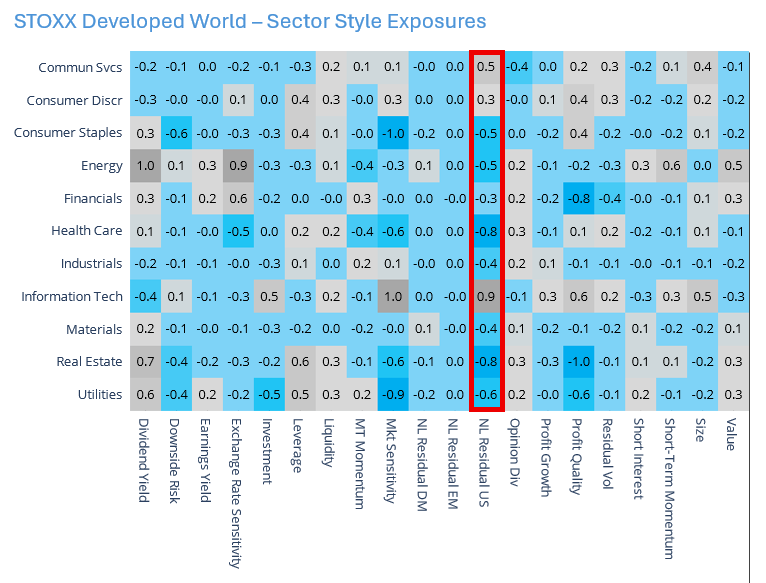
Why is understanding these Non-linear structures important? While they are not the most volatile of the style factors, they are meaningful. The two non-US Non-linear factors are the 5th and 6th most risky (out of 19 medium-horizon factors) while the US Non-linear factor is the 11th. In addition, an active portfolio may have a meaningful exposure to one or more of the factors. As an example, we can see below how many of the sectors comprising the STOXX Developed Markets Index have highly positive or negative exposures to the Non-linear US factor. This suggests that a portfolio with big sector bets could have large active non-linear exposures, as could any portfolio making active bets.
For more information about performance of the Non-linear factors, see our recent blog post, which you can find here.
See charts from the June 20, 2025 STOXX Developed World (WW5.1) Equity Risk Monitor
You may also like