

EQUITY RISK MONITOR HIGHLIGHTS
WEEK ENDED JULY 4, 2025
- Don’t Bet Against the USA
- “Risk Off” factors continue to lead recovery
- The History of Crowding Drawdowns
Don’t Bet Against the USA
The US market saw fresh highs again in the holiday-shortened week celebrating the 249th anniversary of the signing of the American Declaration of Independence from Great Britain. In that spirit, it would seem that despite YTD underperformance of US equities relative to their developed and emerging counterparts, American exceptionalism is alive and well, as that underperformance has reversed since May:
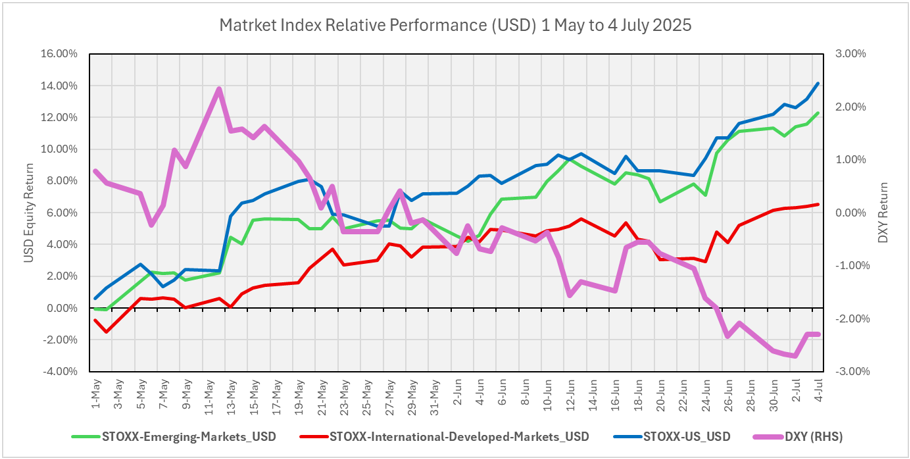
The Emerging and International Developed Markets returns are both stated in USD, thus the concomitant continued decline of the DXY dollar index by an additional 2.3% over this time period makes the US outperformance since May 1 even more impressive, particularly compared to non-US developed markets.
“Risk Off” factors continue to lead recovery
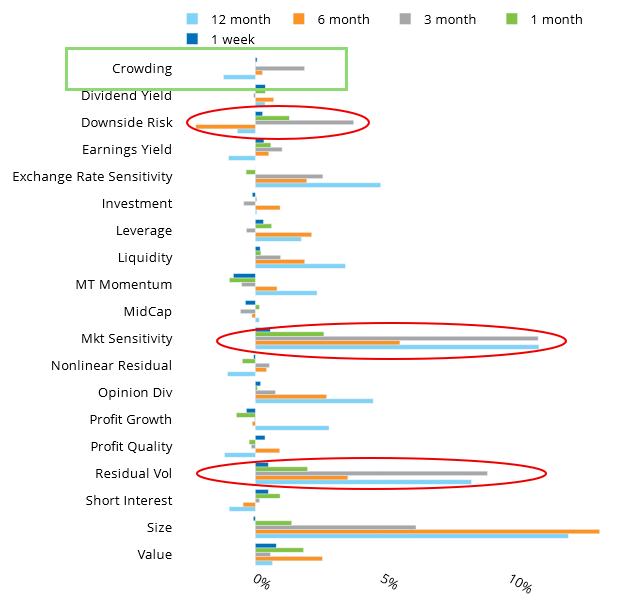
This has occurred in a decidedly “risk-on” environment, as Market Sensitivity, Volatility, Residual Volatility, and Downside Risk have been the best performing factors over the last 3 months since “Liberation Day” in the US and non-US Developed Markets:
See Chart 17, Axioma US Model Style Factor Returns by Period, July 4, 2025
See Chart 17, Axioma Developed Markets ex-US Model Style Factor Returns by Period, July 4, 2025
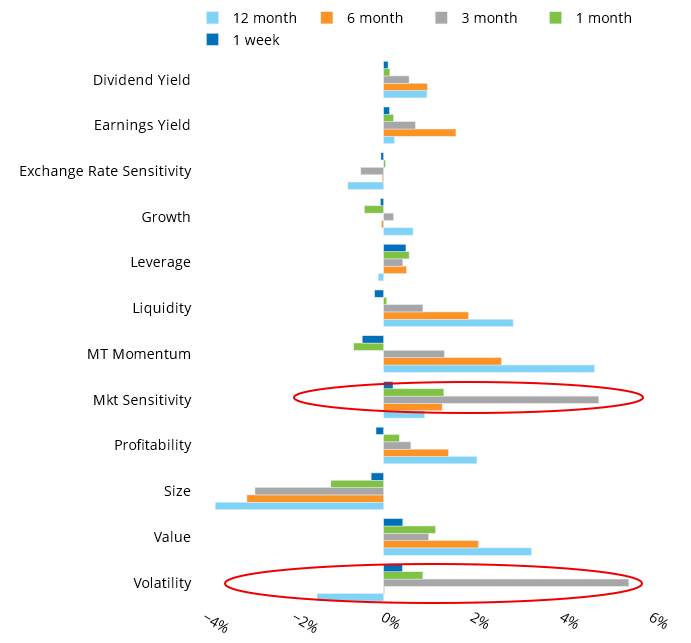
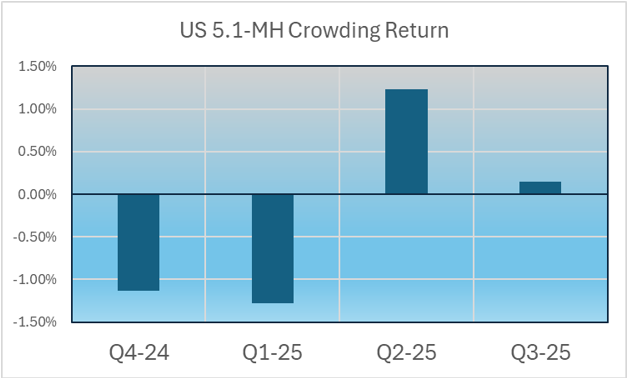
The three-month returns for the “risk” factors in US51 and WWexUS4 exceed all other factor returns over that period by a wide margin, except for Size in the US. The Size factor in the other developed markets is -2.9% over the trailing 3 months while it is 6.3% in the US. This illustrates the continued dominance of the largest US tech behemoths over all the world’s equity markets, as the expectation is that small size (negative Size exposure) performs well in “risk-off” periods. Notice that in the US factor return chart, Crowding is highlighted in a green box. We had written a few times in these highlights about the drag from the Crowding factor in Q4 of 2024 and Q1 of this year. Here are the quarterly returns for the last 3 quarters (and the first 3 days of Q3) for the US Crowding factor:
The History of Crowding Drawdowns
The Crowding factor generally has forecast annualized volatility of ~2% ,so the cumulative 2-quarter drawdown of -2.34% over Q4’24 and Q1’25 is notable. That’s not a 2-standard deviation move, but it is a somewhat sustained drawdown for a factor that has such a strong positive drift over time. Typically drawdowns in Crowding are sharp and short-lived, a few days to a few weeks in periodic market-wide liquidity squeezes. Over the 19-year model history of the Crowding factor return, there have only been 8 drawdowns of 2 percentage points or more. These have tended to last quite a while, but the current drawdown which began in June 2024, is the second deepest and 3rd longest on record:
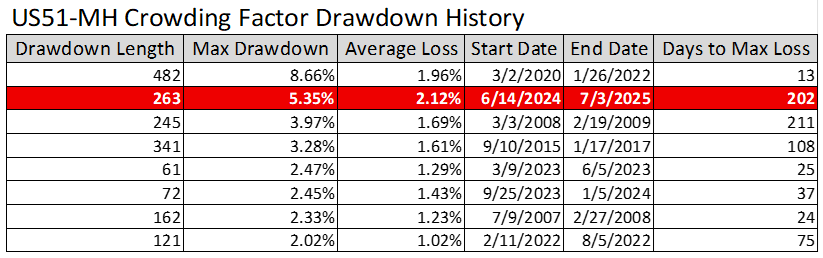
In the very long-lasting drawdown from March 2020 to January 2022, the max drawdown of -8.65% was reached in 13 days, and half the loss was made up by the 45th day. In the current one we did not reach the maximum drawdown of 5.35% until the 202nd day (April 4th, 2025), but we are 60% of the way back from that loss as of last week, so by comparison the current drawdown has been slow on the way down, but the rebound (in progress) has been quite rapid.
You may also like


