Do factor returns change with your investment horizon?
Axioma Worldwide Trading Horizon: factor performance across investment timeframes
Author
Robert D. Stock, PhD
Principal, Equity and Analytics Research
Does the Size factor behave the same way for day traders and long-term investors? Our analysis of factor returns from 1995 through 2025 found that your investment time horizon fundamentally changes which factors deliver returns – and by how much. Some factors show return spreads exceeding 2% annually depending on whether you're trading over days, weeks, or months.
The newly launched Axioma Worldwide 5.1 Trading Horizon equity risk model (AXWW5.1-TH) demonstrates the importance of these time-dependent dynamics. But what exactly makes a "trading horizon" model different from medium horizon (MH) and short horizon (SH) approaches?
The most obvious answer is that the shorter horizon models use shorter half-lives for the construction of the covariance matrix, for both the factor return inputs and the cross-sectional volatility adjustment. Shorter half-lives result in greater responsiveness at the cost of stability.
What's different in the factor definitions?
While the SH and TH Worldwide models both have two factors that are not included in the MH model due to higher turnover (Short-Term Momentum and Opinion Divergence), the factor definitions are exactly the same across the model horizons – except for five factors in the “market risk” theme which have data windows tuned to the horizon in question.
Market Sensitivity and Exchange Rate Sensitivity, for example, both use 104 weeks, 52 weeks, and 26 weeks of data for the MH, SH, and TH models, respectively. Likewise, for relevant descriptors within Residual Volatility, Liquidity, and Downside Risk, the models use six months, three months, or one month of lookback across the horizons.
But the more interesting question is: how do these different horizons affect actual factor performance?
Comparing the average annual return of each factor across model horizons from January 1995 through October 2025, we find almost exactly what we would expect: Factors with the same definitions have very similar returns across horizons, and the larger variations are found among the five factors with different data windows. There are two exceptions: the return to Size also varies strongly across horizons, but Exchange Rate Sensitivity’s does not.
The latter result is not surprising, as Exchange Rate Sensitivity is not an alpha factor and never had any systematic return to it; its purpose is to describe risk so it is actually gratifying to see the stability of low returns across horizons. The variation in the Size factor return, however, is rather interesting.
Figure 1 shows the spread between the lowest and highest average annual return for the relevant factors across model horizons. All other factors had spreads less than 0.71% (with an average of 0.26%).
Figure 1: Average annual return spread across model horizons for factors of interest
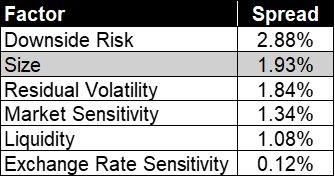
Source: Axioma Worldwide 5.1 equity risk models
Examining the factors with large spreads in more detail, Size exhibits an ordering of returns corresponding to the horizons, with a marked difference between MH and the other two horizons. Given the same exposure definition, the reason for the return difference is not obvious. Beyond a certain point, adding new or modified factors tends to “steal” return from other factors because of collinearity, rather than finding a completely orthogonal systematic return anomaly. The presence of Opinion Divergence and Short-Term Momentum in the SH and TH horizons with strong returns could affect their Size returns relative to the MH model; the factors with different definitions could also cause some shuffling of returns. The Non-linear Residual Structure (US) factor, with its typical Size^2 and Size^3 exposures also plays a role, but cannot explain the whole effect alone.
Another observation about Size is that in theory it should be sloping downwards if small stocks outperform over time. While this is somewhat true for the MH model, the SH model’s Size return is flat, and TH has an overall positive return! Closer examination shows this is due to two periods where Size had strong positive returns (during the late 1990s, and around 2008), on top of a general downward slope. Furthermore, the Size return seems to have bottomed around 2018 and has been rising ever since, even accelerating in the last two years with the AI boom and the rise of the “Mag 7”.
While the rough correspondence of large-cap dominance during or prior to the boom/bust cycles of the dot-com era and the Global Financial Crisis may give us pause to observe it happening again now in the context of a potential AI bubble, the timing is too imprecise and the data too sparse to use this as a firm signal. But the behavior of the Size factor suggests there is something abnormal about these market environments, which may relate to “narrowness.”
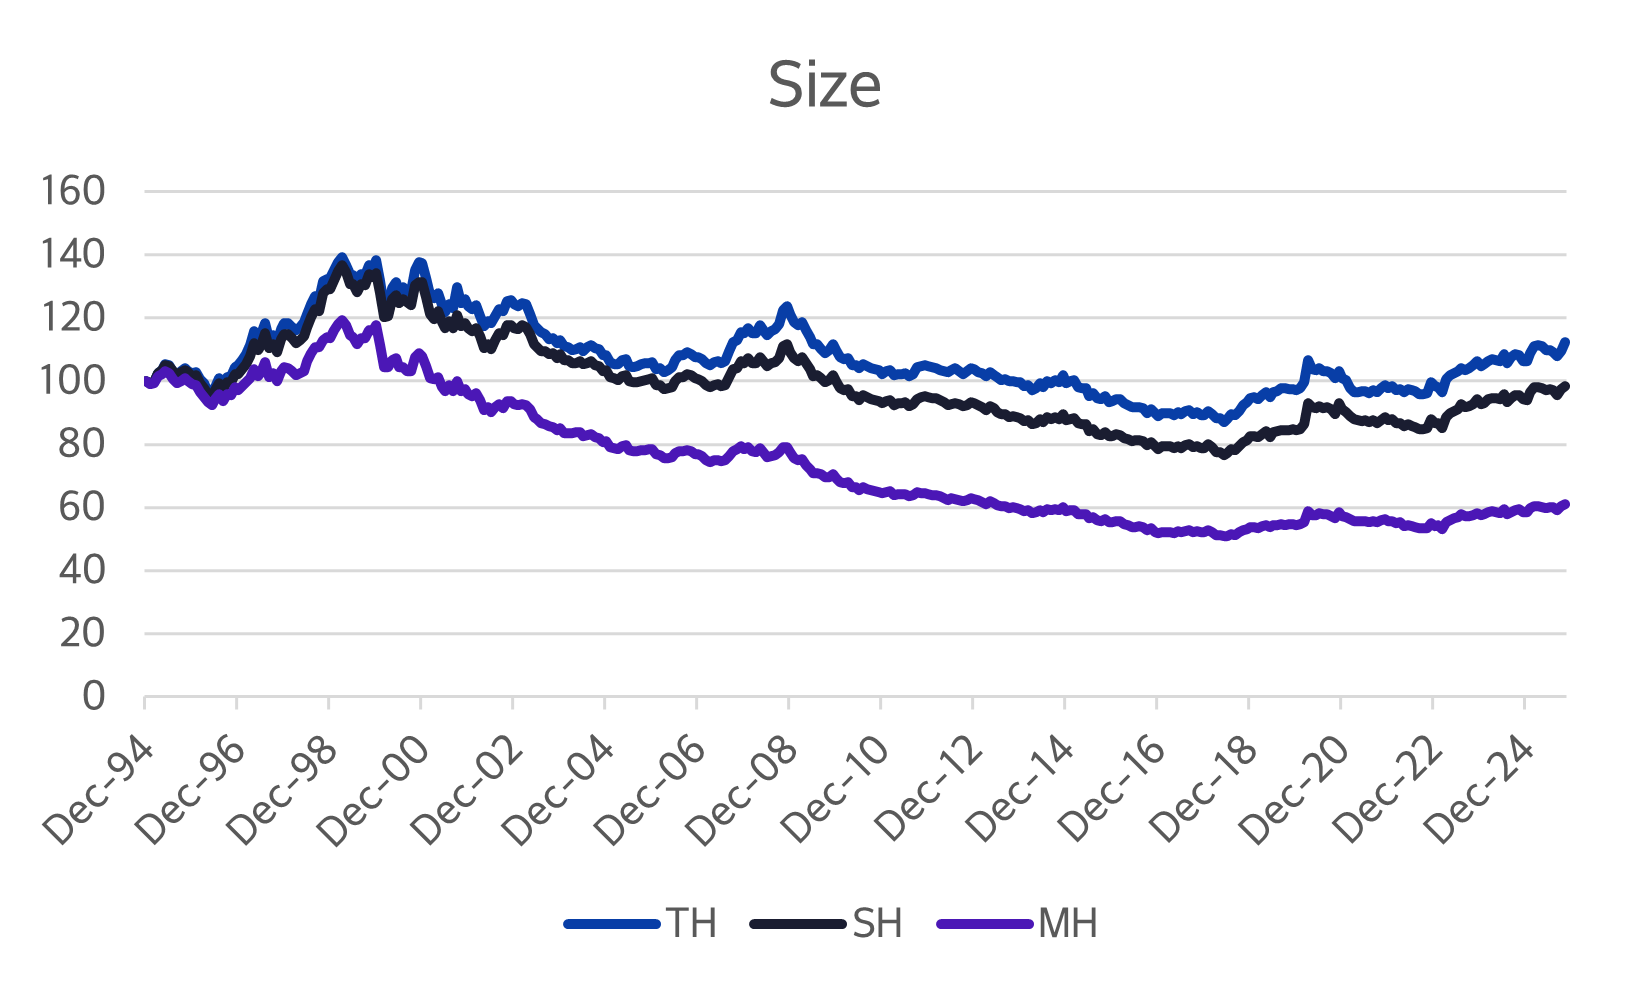
Source: Axioma Worldwide 5.1 equity risk models
For Downside Risk, we also see an ordering of returns matching the horizons, and it is generally consistently downward as expected. The lower return of the MH model implies that downside volatility measured over a longer horizon is more persistent and results in greater cumulative negative returns.

Source: Axioma Worldwide 5.1 equity risk models
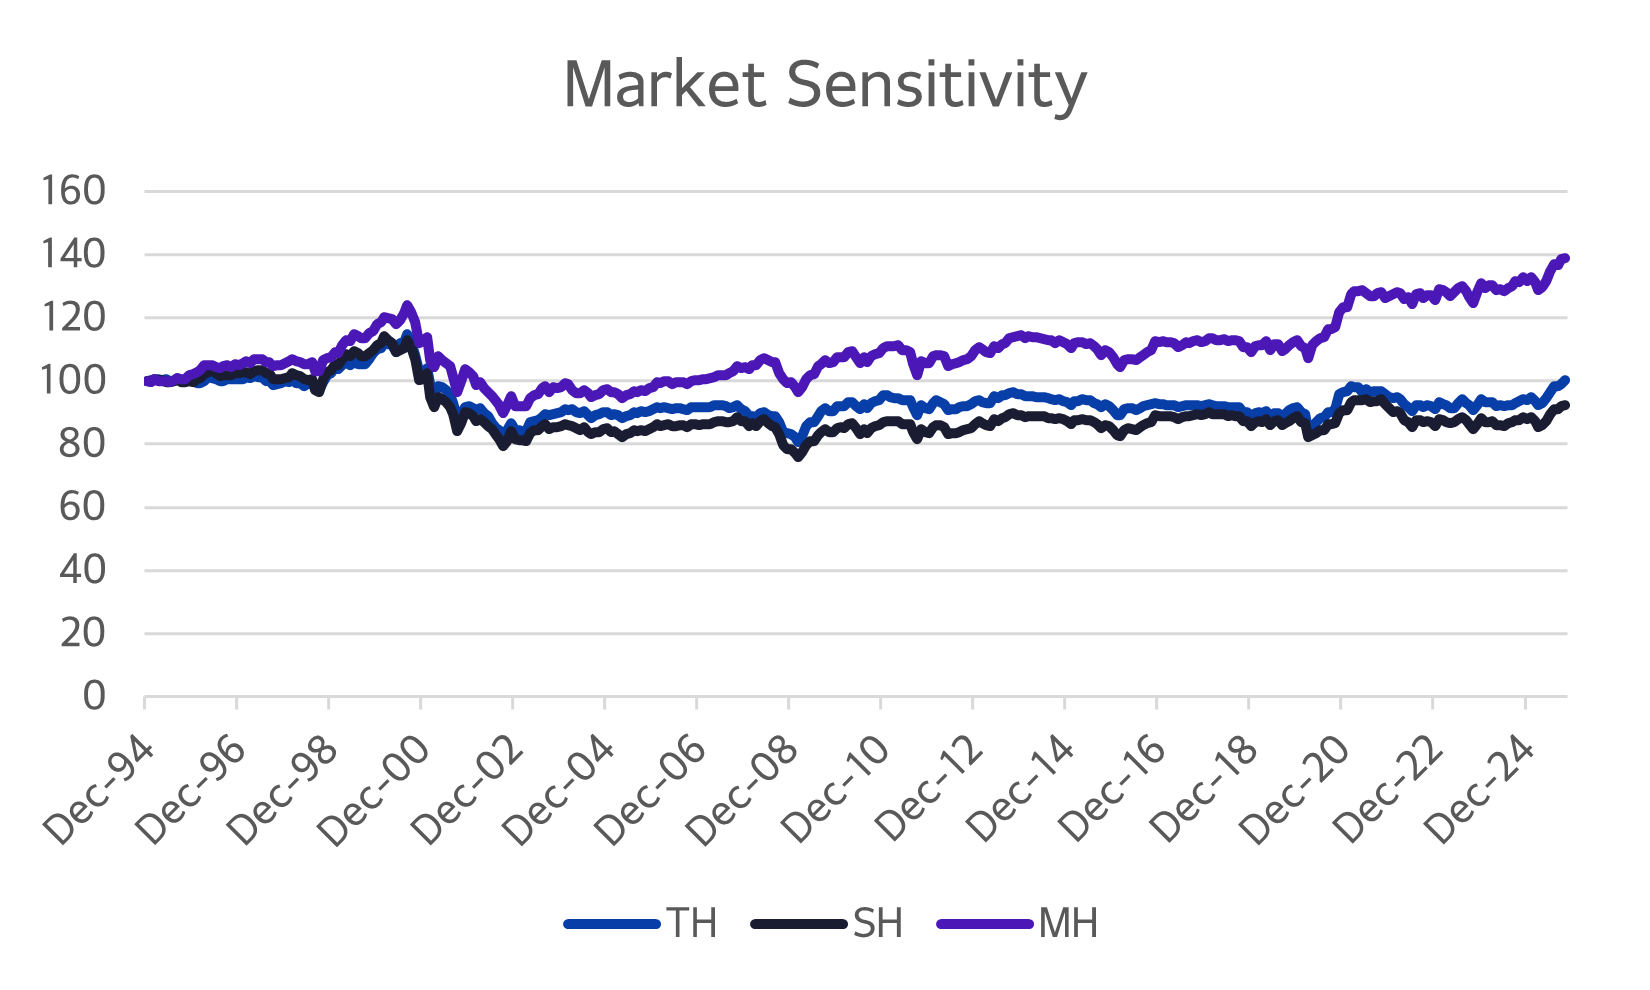
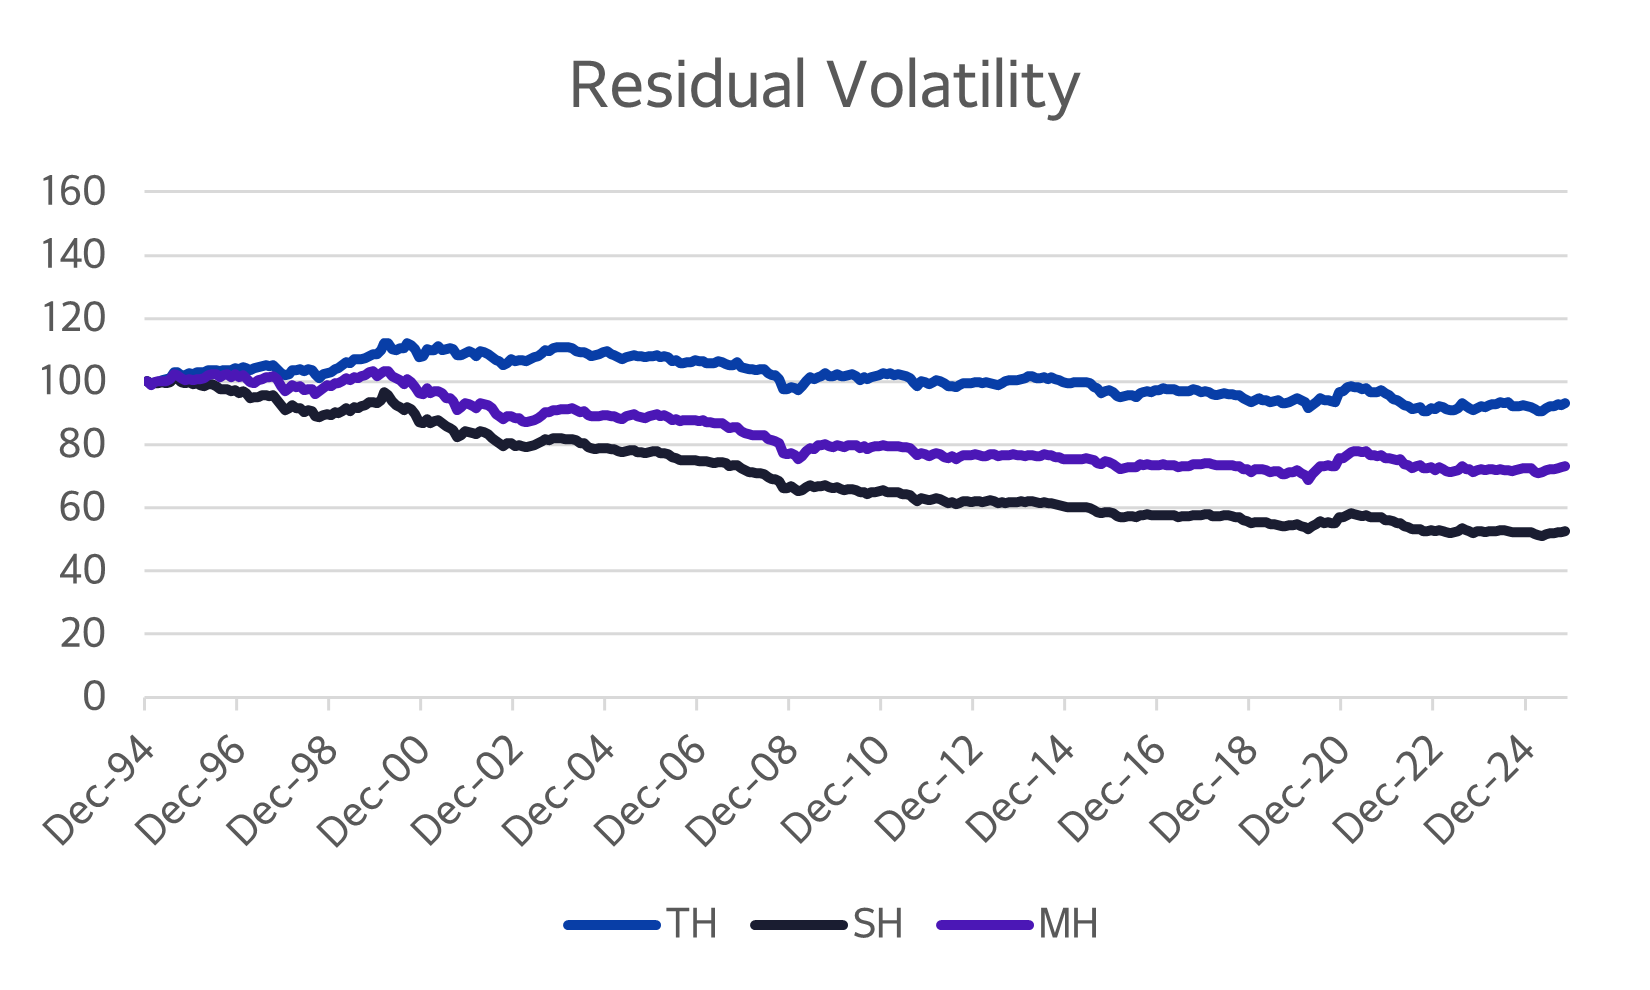
The other factors related to Downside Risk are Market Sensitivity and Residual Volatility (which is orthogonalized against the other two). Whereas Downside Risk was constructed with the intention of having a strong negative return based on economic theory, the arguments behind the expected systematic direction of Market Sensitivity and Residual Volatility (especially after orthogonalization) are more debatable. Their return rankings are also not as consistently ordered across model horizons.
Market Sensitivity has flat returns over almost the entire period for both the TH and SH horizons, with a positive return to the MH model which has been consistently upward since 2002. Residual Volatility’s returns are generally downward but, as with Market Sensitivity, the SH model has the lowest return instead of lying between the TH and MH horizons. In fact, betting against risk by shorting all three of these factors (Downside Risk, Market Sensitivity, and Residual Volatility) would have been most profitable by far using the SH model (though all three would have made money).
Source: Axioma Worldwide 5.1 equity risk models
Source: Axioma Worldwide 5.1 equity risk models
Liquidity has the same mixed ordering as Residual Volatility, but the returns are shifted upwards. Now, the SH model’s factor has consistently flat returns, and positive returns are associated with the MH and TH factors. The TH model’s shorter horizon does best, indicating that capturing short-term surges in trading activity is profitable. Likewise, the longer-term sustained measures of liquidity in the MH model also lead to positive returns.
A closer look, however, reveals that Liquidity’s returns peaked in August 2009, and were slightly negative from then until bottoming in March of 2020. The last five years have been nicely positive. This observation ties into recent research (Bessembinder, Burt and Hrdlicka 2024) that factor return premia are neither constant, nor arbitraged away, nor random noise, but rather go through cycles of time variation lasting on the order of months to years. Many factors lost their premia around 2009 but have since been observed regaining them.

Source: Axioma Worldwide 5.1 equity risk models
No single risk model horizon is best for all applications
What this study has shown is that factor behavior isn’t universal across time horizons. Matching your risk model to your investment horizon is essential and portfolio managers that understand these dynamics gain greater flexibility to manage risk and target returns.
Discover the suite of Axioma equity models including the newest Trading Model.
"…the behavior of the Size factor suggests there is something abnormal about these market environments…"
References/footnotes
Bessembinder, H., Burt, A. P. and Hrdlicka, C. M., More factors matter and factors matter more than you might think: The role of time variation in factor premia (March 25, 2024). Available at SSRN: https://ssrn.com/abstract=3992041Related content