When markets turn, turn to a Trading Model
How to react quickly to major market events
Author
Melissa Brown, CFA
Global Head of Investment Decision Research
An analysis of the Global Financial Crisis, COVID and “Liberation Day” shows how
- The Axioma global trading horizon model forecasts risk over ~20 days, responding faster and with greater magnitude to market shifts than short- and medium-horizon models.
- Analysis of the 2008 GFC, 2020 COVID crash, and 2025 "Liberation Day" shows the trading horizon model provided earlier warning signals in each crisis, though patterns varied.
- Even long-term investors benefit from monitoring the Trading Model as a leading indicator for portfolio rebalancing decisions and understanding risk sources during volatile periods.
Earlier this year we released version 5.1 of the Axioma Worldwide equity models. We introduced new factors and reformulated others while keeping the same concepts (and many original factors) intact. The goal was to produce a model that provided an even better forecast of risk over short- and medium horizons.
Axioma Worldwide Trading Horizon Model: A model for any manager
This month we extended the models to include an even shorter horizon than what we call “short” horizon: a trading horizon, meant to forecast risk over the next 20 days or so. The new version will be helpful for traders and managers with very short holding periods, but will also be useful for any manager when there is an abrupt change in market direction or in the underlying sources of risk. When we see market inflection points, especially when the market turns south, risk forecasts from all model variants tend to move up, but the trading horizon typically moves more quickly and the magnitude of the change is higher.
To illustrate this we chose three periods in which we know there was a sudden jump in volatility as markets swooned, precipitated by events that would impact markets around the world. The first, the Global Financial Crisis (GFC) starts before Lehman Brothers failed, when volatility soared and remained elevated for many months; the second was the onset of the COVID crisis, where we saw about three to four weeks of heightened volatility; and finally most recently the tariff announcements of “Liberation Day”, which saw a rapid and steep market drop and corresponding volatility increase, but which lasted for only a short time, until many of the proposed upcoming tariffs were postponed. In each instance we saw a timely jump in trading-horizon risk that was higher than we saw for either of the other horizons, but the length of the market reaction and the corresponding pattern of elevated risk was different in each case. In each case we used the FTSE Developed Index as the benchmark for which we calculated risk.
Global Financial Crisis1: Risk jumped even before Lehman fell
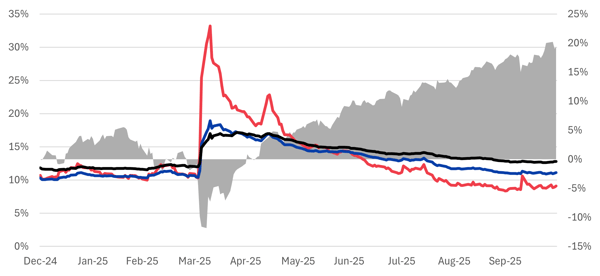
We begin by examining the period from the end of July 2008 through the end of April 2009, a time dominated by the Global Financial Crisis. Although there were clear signs of trouble as early as 2006, the “official” onset of the crisis is usually associated with the failure of Lehman Brothers in September 2008. In Exhibit 1 below, we see that the three model variants (trading, short and medium) had similar risk forecasts through August 2008 and reached a near-term low at the end of that month. But trading risk bottomed out on September 1, and by September 4 (well before the Lehman collapse) was up from 10.4% to 14.5%, an increase of almost 14%. The trading-horizon risk forecast had its ups and downs, but trended up until it reached 51% on October 30. Trading horizon risk remained higher than its short- and medium-horizon counterparts until late December, when all three variants finally started to fall. Risk forecasts from the short- and medium-horizon variants rose much more slowly, although daily volatility remained high. The market, meanwhile, continued to fall, bottoming out on March 9, 2009. Trading horizon risk had started another upward climb in mid-February, as the magnitude of daily returns increased (first to the downside, then to the upside, as we can see in Exhibit 2), and peaked on March 19. The other variants saw a similar, but much more muted pattern. We also note that it took another year for the risk forecasts to return to their long-term median levels. This was indeed a long period of heightened risk.
Exhibit 1: Risk forecasts and return: Global Financial Crisis, FTSE Developed Index
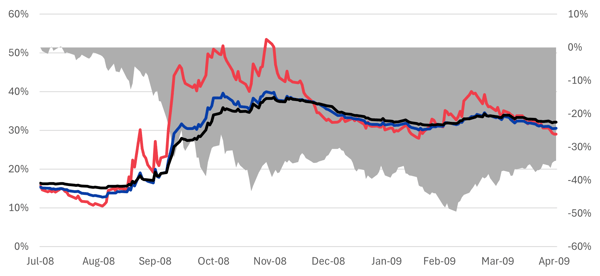
Source: FTSE Russell, Axioma WW5.1 fundamental models
Exhibit 2: Daily return vs. predicted one standard deviation bands, trading and short-horizon models, FTSE Developed Index
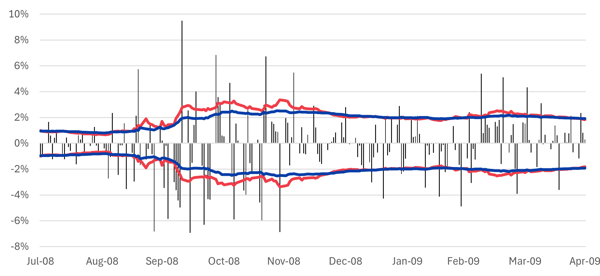
Source: FTSE Russell, Axioma WW5.1 fundamental models
COVID First Wave – the calm, the storm, the calm again
Here we looked at the first seven months of 2020 to illustrate the calm before the COVID storm, the impact of the sharp but short-lived decline in stock prices associated with the lockdowns, and the subsequent market recovery back to its previous high water mark through the lenses of the three model horizons.
2020 got off to a quiet start. In fact, predicted volatility from all models was near historical lows, as few grasped the enormity of the oncoming crisis. However, by February 20, as the news turned bad, the FTSE Developed Index started to plunge, falling in 10 of the 12 days starting February 20 and subsequently seeing historically large one-day declines of 7.1% on March 9, 9.8% on March 12 and 9.3% on March 16 (Exhibits 3 and 4). In all, the global market fell more than 30% in just a month. It is no surprise that risk rose steadily starting February 20 and ended around March 20. Trading horizon risk was up more than eight-fold (from 10.5% to 88.2%!). To be sure, the short- and medium-horizon risk forecasts climbed as well, almost 600% and about 250%, respectively. For each variant the increase in risk was the biggest in the model’s history since at least 2006, and for the trading horizon model the magnitude of the increase dwarfed that seen in all 22-day periods since 2006. In fact, risk peaked for all three variants on March 26 and has not been nearly as high since then.
During that period, the equity market recovered, erasing all of its March losses by early June. By then the predicted risk according to the Trading Model had fallen to about 18% (roughly 20% of its peak level) and was also lower than that of the short- and medium-horizon forecasts. Daily returns settled down and were largely within the one standard deviation band based on model risk predictions. A substantial market decline on June 10 of 2020 led to a quick jump in trading-horizon risk, but in general it continued to decline through August. Risk from the other models also declined. Their declines were much slower, albeit without the periodic spikes we saw in the trading-horizon model after big down days. We would also note here that, as usual, markets tend to drop quickly but rise slowly. Market gains generally do not, therefore, result in risk spikes. During the Global Financial Crisis there were some large down days, but also prolonged periods of smaller negative returns. In this crisis the market drop was large and sudden, whereas the recovery was slow but steady.
Exhibit 3: Risk forecasts and return, COVID first wave, FTSE Developed Index
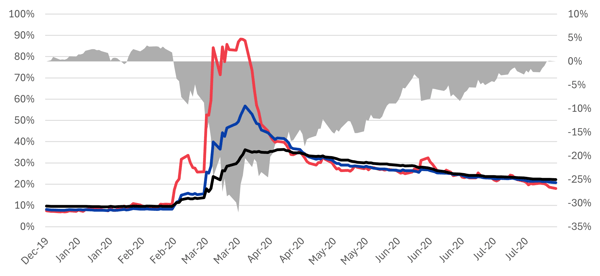
Source: FTSE Russell, Axioma WW5.1 fundamental models
Exhibit 4: Daily return vs. predicted one standard deviation bands, trading and short-horizon models, FTSE Developed Index, COVID First Wave
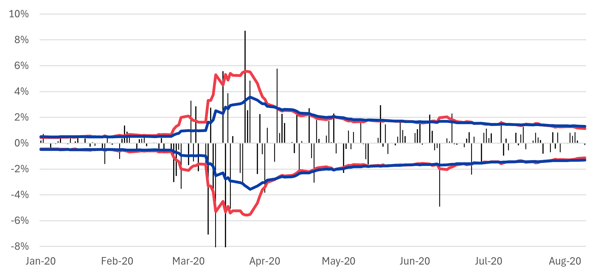
Source: FTSE Russell, Axioma WW5.1 fundamental models
“Liberation Day” – short-lived spike followed by even lower trading horizon risk
In the GFC, the market’s decline played out over a long period that was punctuated by a few really bad days. The bear market driven by COVID started with a set of small down days that were followed by a few of the worst days investors had seen for many years. But when the Fed came in to support both stock and bond markets, stocks bottomed out but took about four months for equities to reach their previous high-water mark.
In contrast, the market correction triggered by the announcement of broad global tariffs on April 2, 2025 was over almost before it started, as the US administration quickly eased up on the magnitude and timing of tariff threats. Still, the trading horizon model risk forecast almost doubled from April 3 to April 4, a much bigger increase than we saw for the other model variants. It still took several months for the risk forecasts to ease back to their recent lows as markets were buffeted by continued tariff uncertainty. Exhibit 6 shows the daily returns breaching one standard deviation prediction bands more often for the short-horizon model, especially on the down days.
Although the market correction was short-lived, investors trying to navigate the choppiness would have been helped by seeing the trading model’s perspective, especially as it retraced most of the risk increase quite quickly.
Exhibit 5: Risk forecasts and return, “Liberation Day”, FTSE Developed Index
Source: FTSE Russell, Axioma WW5.1 fundamental models
Exhibit 6: Daily return vs. predicted one standard deviation bands, trading and short-horizon models, FTSE Developed Index, “Liberation Day”
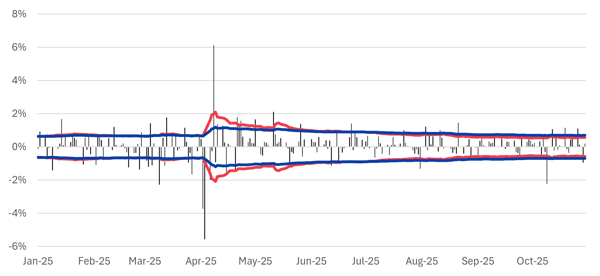
Source: FTSE Russell, Axioma WW5.1 fundamental models
Why is parsing the differences in risk model forecasts useful even for investors with longer horizons?
Consider the following:
- As we have often noted about the short-horizon model, it tends to be a leading indicator vis-à-vis the medium horizon. We can view the trading-horizon model in the same way: as trading-horizon risk changes substantially, the models many of our clients use to rebalance their portfolios are likely to follow on its heels. Some may not want to trade “today” when they know they will have to trade again “tomorrow” because risk will have increased (or possibly decreased, as we saw in the “Liberation Day” example), and they will need to bring risk in line with budget. The trading horizon model can help provide perspective.
- While longer-horizon models work extremely well in “normal” markets, investors may want to turn to the Axioma trading horizon models to understand what is happening to their portfolios in times of crisis, as we have illustrated above. Even if they don’t use the model to trade, just understanding the sources of ultra-short-term risk and return can be extremely helpful in making investment decisions and explaining results to clients.
- Although we have not discussed the additional components of the new trading horizon model on top of what is included in the other horizon models, some of those factors may help with more quickly identifying opportunities or threats to a global portfolio. For quantitatively driven investors, these factors can easily be added to an optimization, even if the risk target is based on a different horizon model.
For more information about the Axioma Equity Factor Risk Model – Trading Horizon, visit www.simcorp.com/tradingmodel.
References/footnotes
1 Note that some of this text is borrowed from the article we wrote when we introduced the US5.1 Trading Horizon Model, as we used two of the same three periods in that analysis.Related articles