

Risk fell in every region in Q3, as investors reassessed their equity preferences
Author:

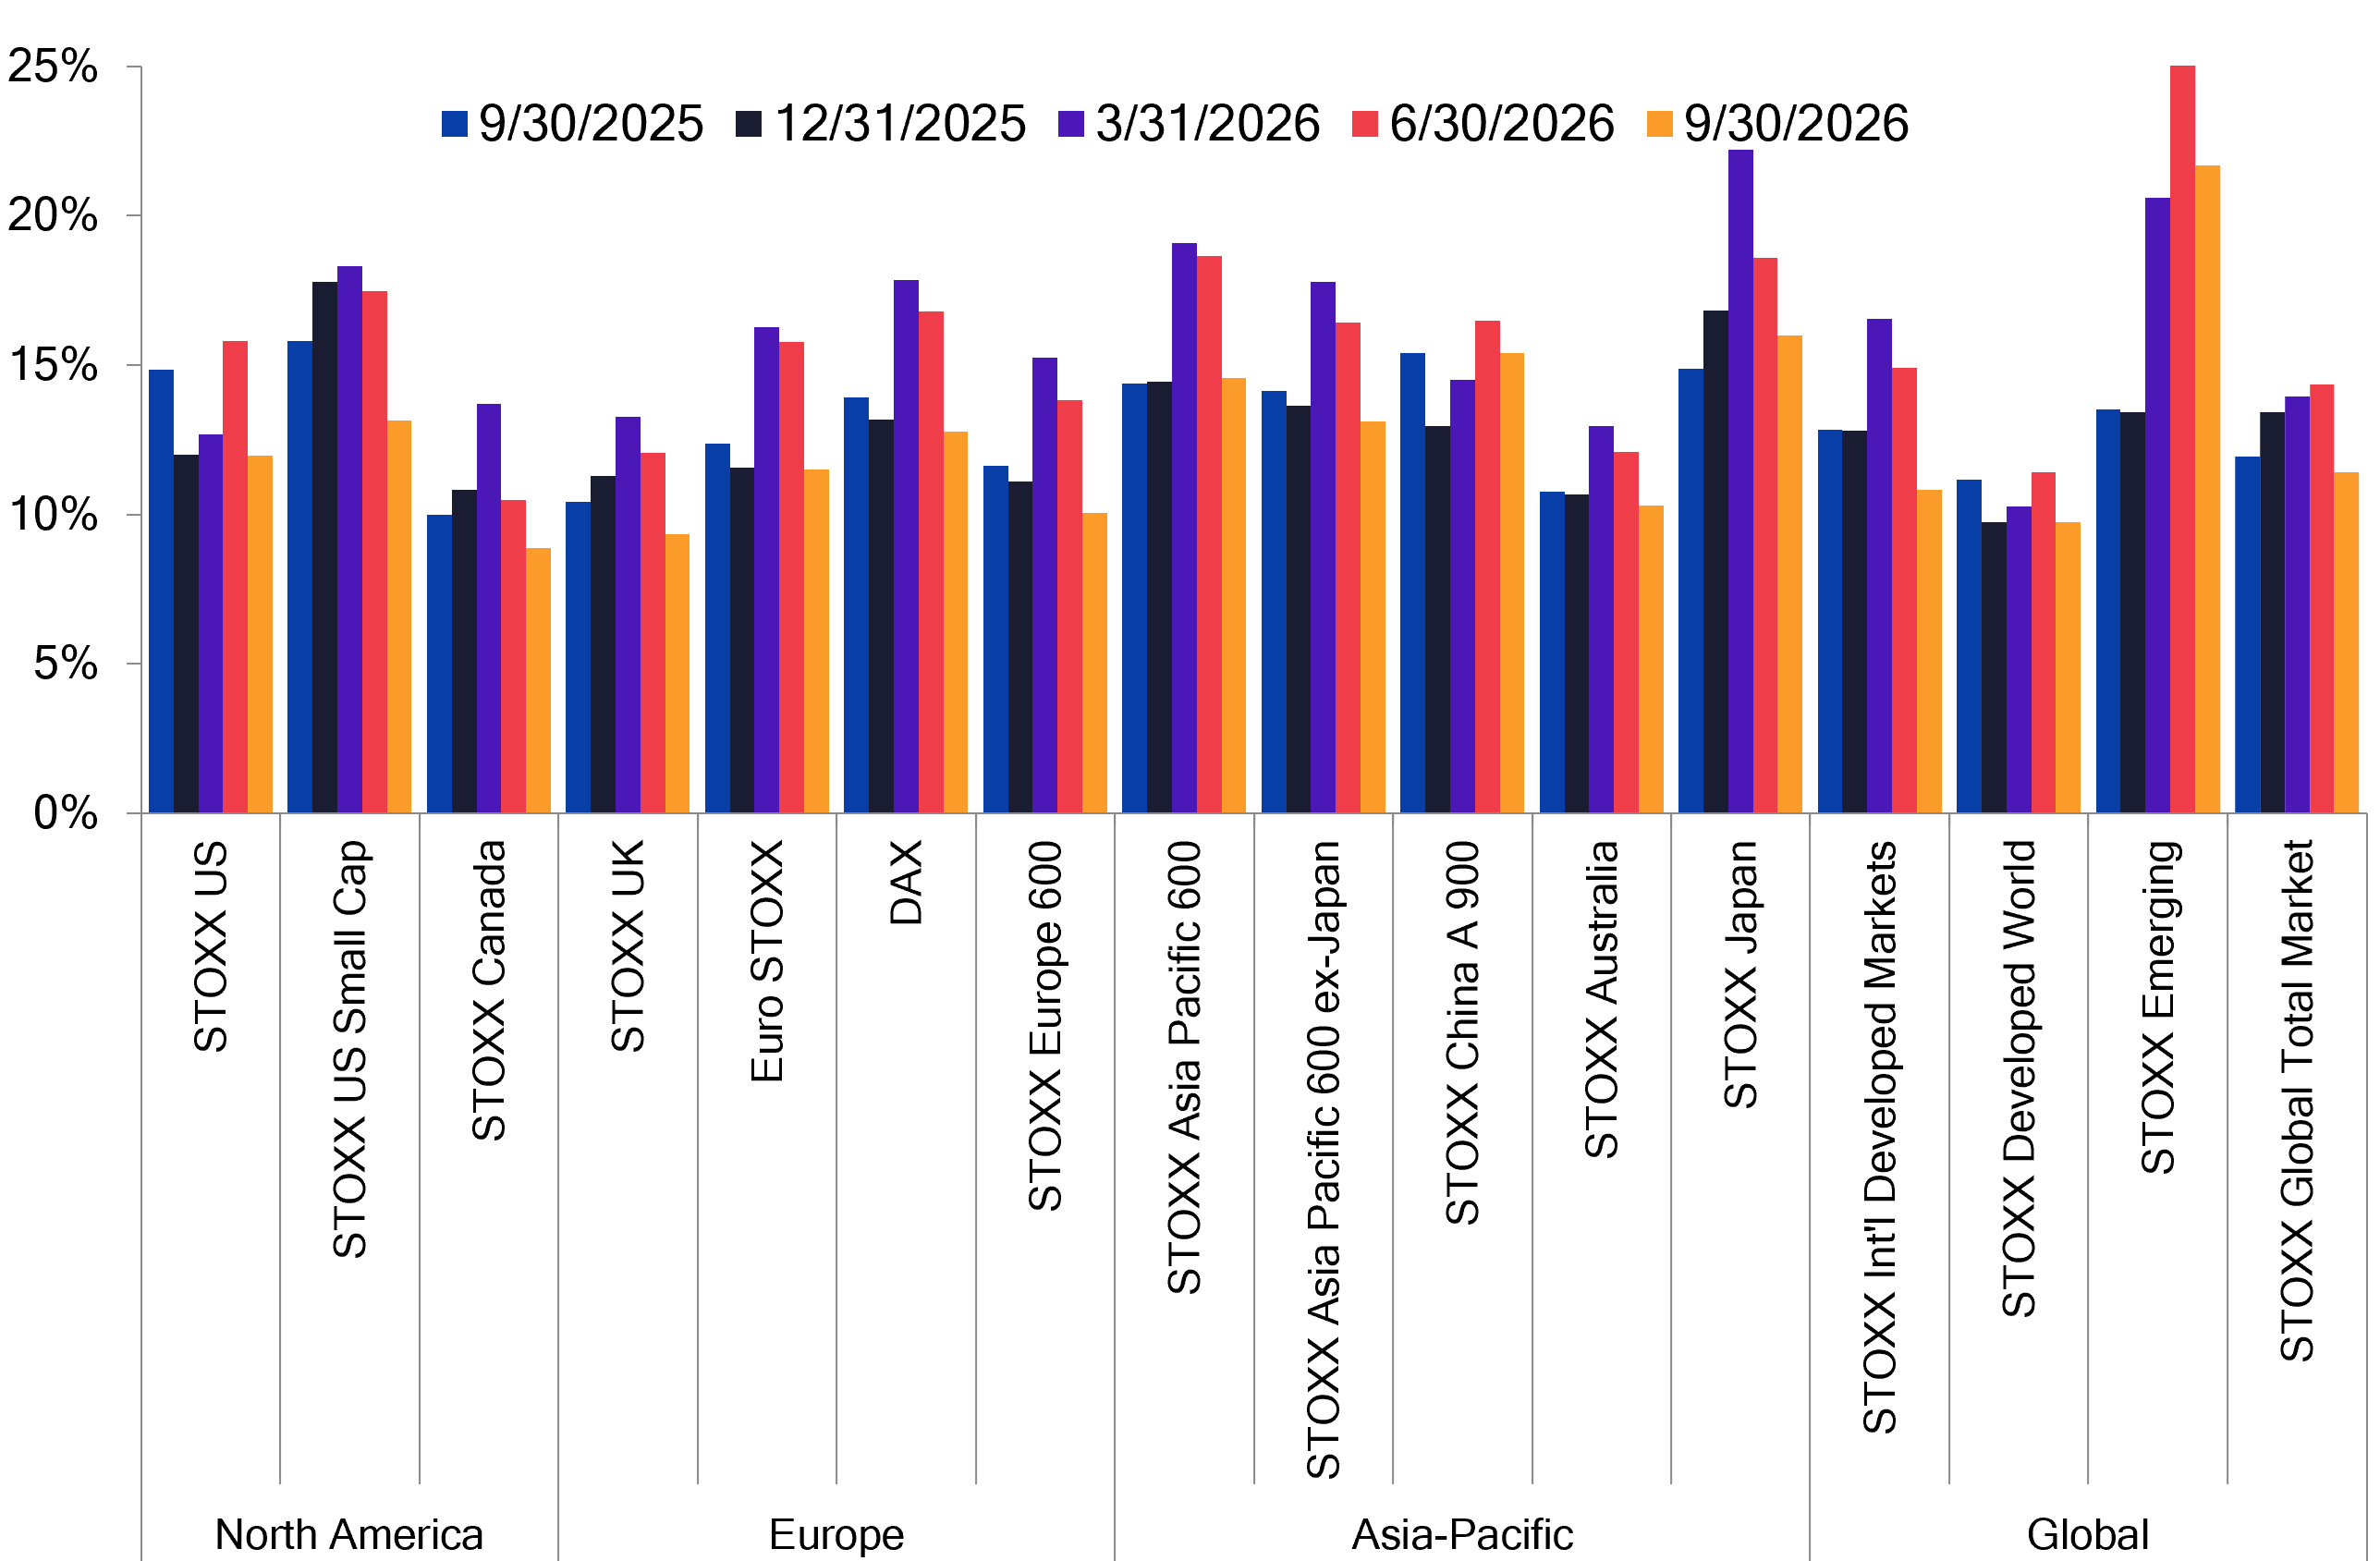
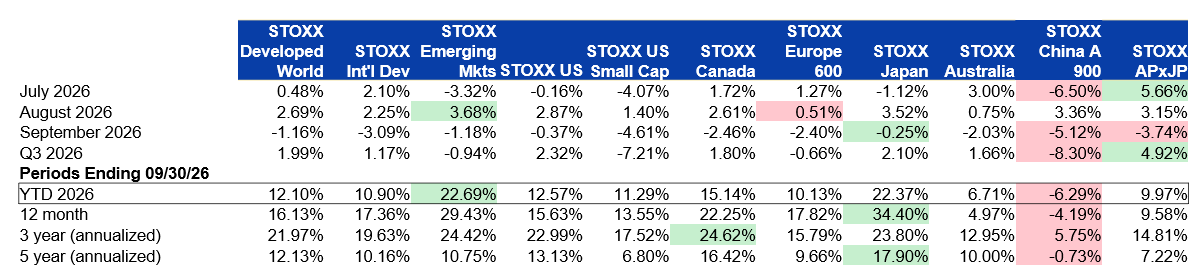
In Q3 2026, predicted equity risk fell in every region, most by 20–30 percent, as asset correlations dropped to multi-year lows. Asia ex-Japan’s returns led the quarter, Emerging Markets and Japan lead the year, and Value and Earnings Yield performed well. The review also shows where risk is concentrating, a useful base for investors to reassess where their opportunities are.
Q3 2026 Equities Review: Risk & Performance
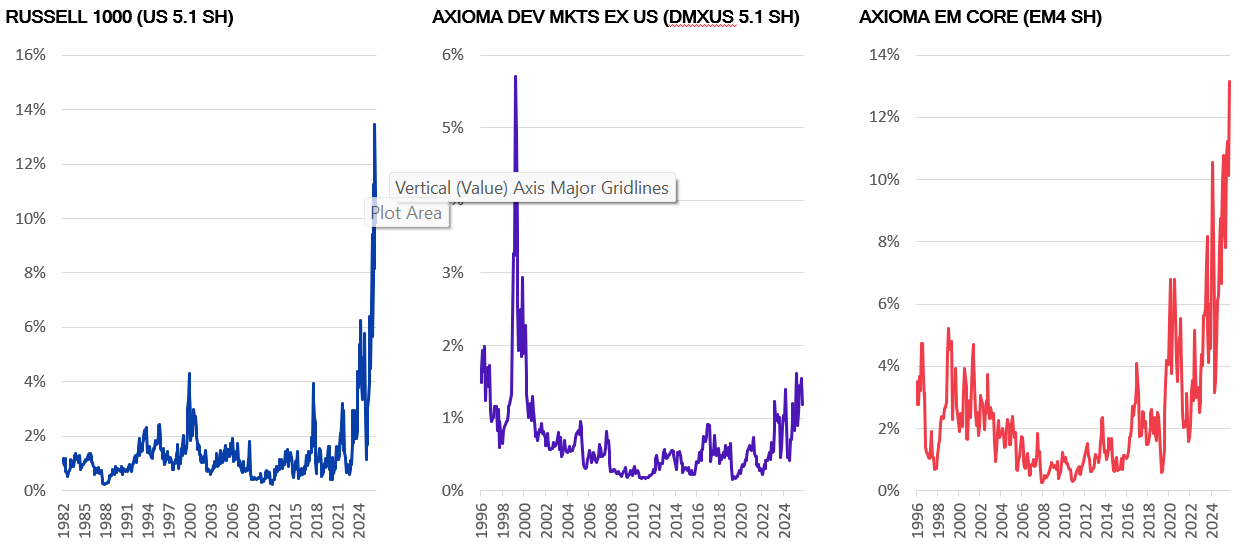
One striking aspect of the Q3 risk environment was the sharp increase in specific risk as a percent of total risk, a potential positive for stock pickers, may have made it more difficult for style-based investors
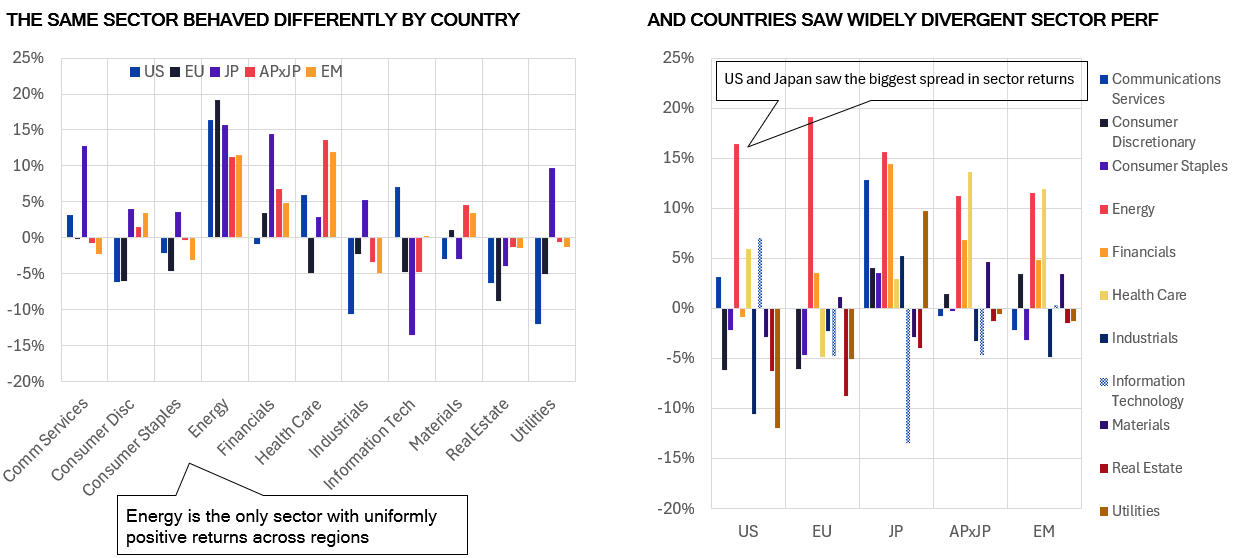
Q3 2026 was a quarter of reset expectations. With no clear end to the Iran conflict in sight, investors adjusted to higher oil prices and continued inflation. They also became resigned to higher-for-longer rates, fiscal strain, political gridlock and ongoing trade wars and supply shocks. AI remains a cautious source of optimism although more measured, given security threats and data center backlash.
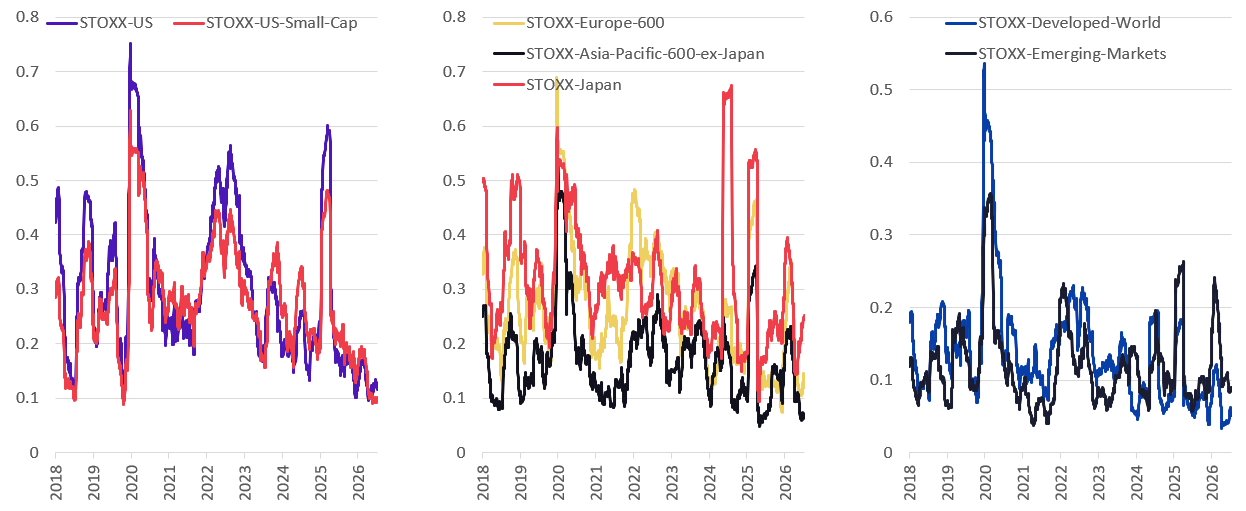
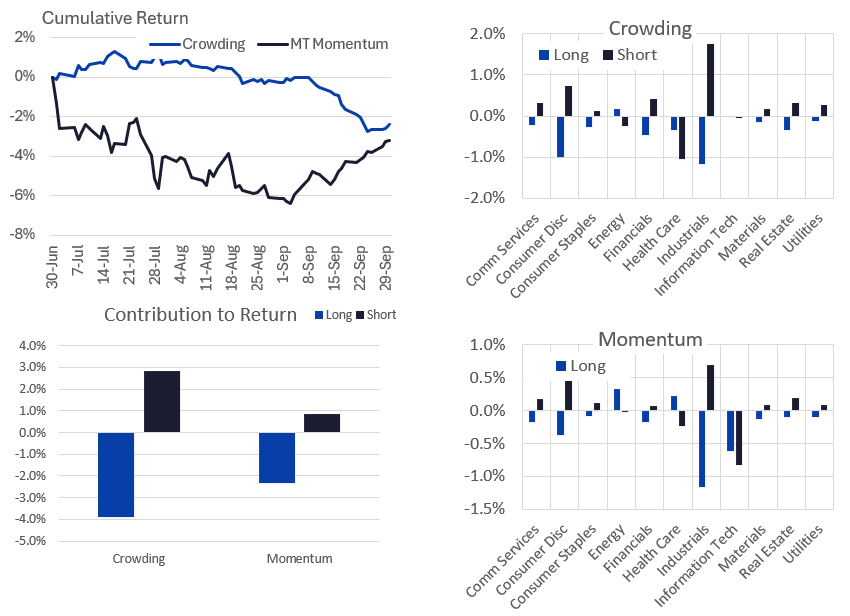
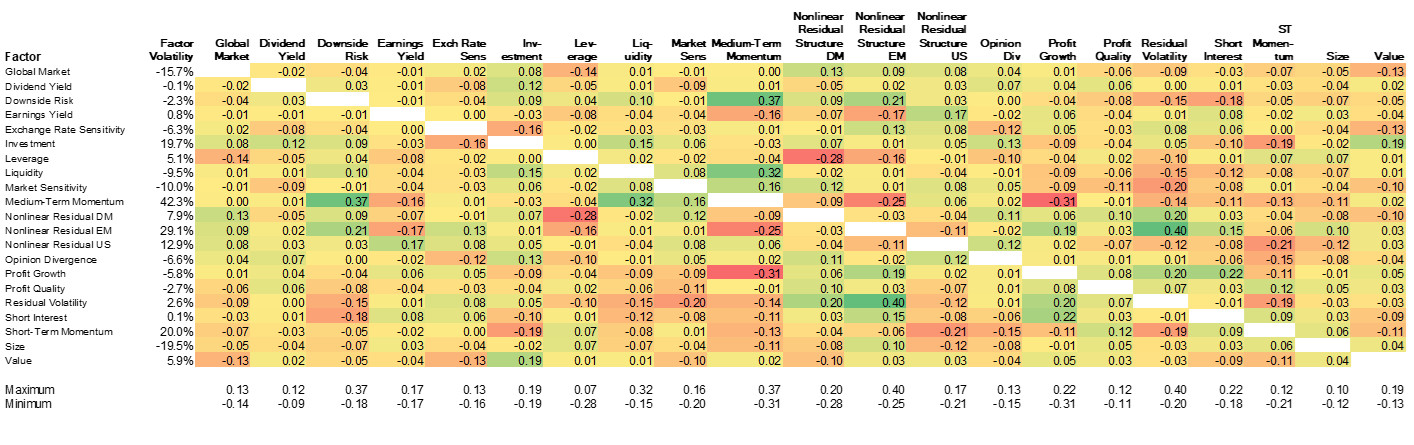
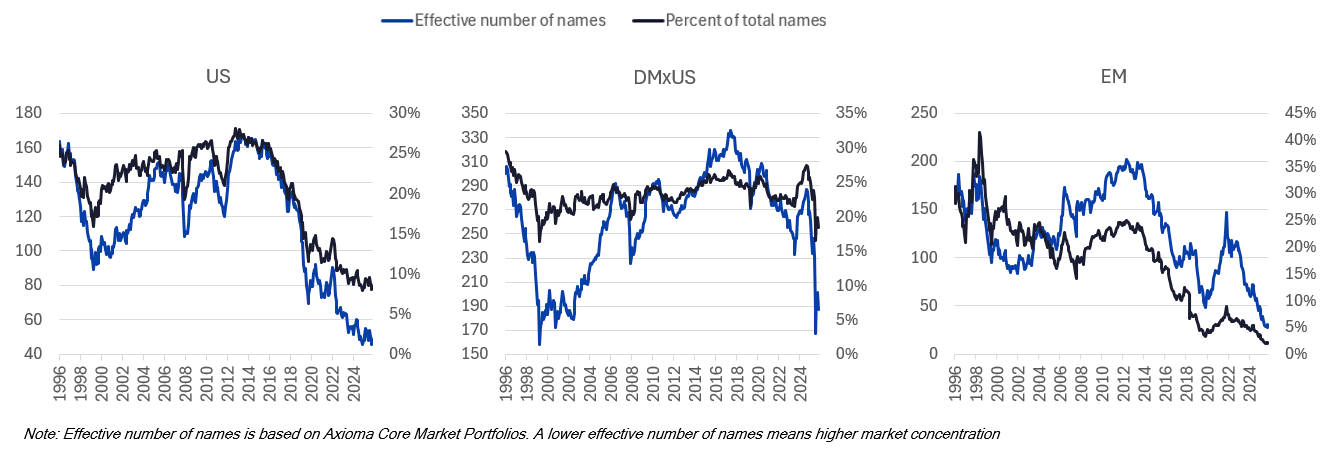
Against this backdrop, sector returns diverged, asset correlations stayed at or near eight-year lows or longer, leading predicted risk to fall in every region we track. While this may give investors some comfort, some less obvious risks lurk under the surface. Trading volume fell in most regions, which suggests less support for market rallies, and Crowding and Momentum had among their most difficult quarters in model history, highlighting the change in sentiment. The eight key findings below set out what drove the risk environment in Q3 and where risk currently sits, so investors can weigh them and decide what their own options and opportunities are heading into the final months of 2026.
Download the slide deck for the full set of detailed charts behind each finding.
Eight key findings from the last three months
Outlook heading into the final months of 2026
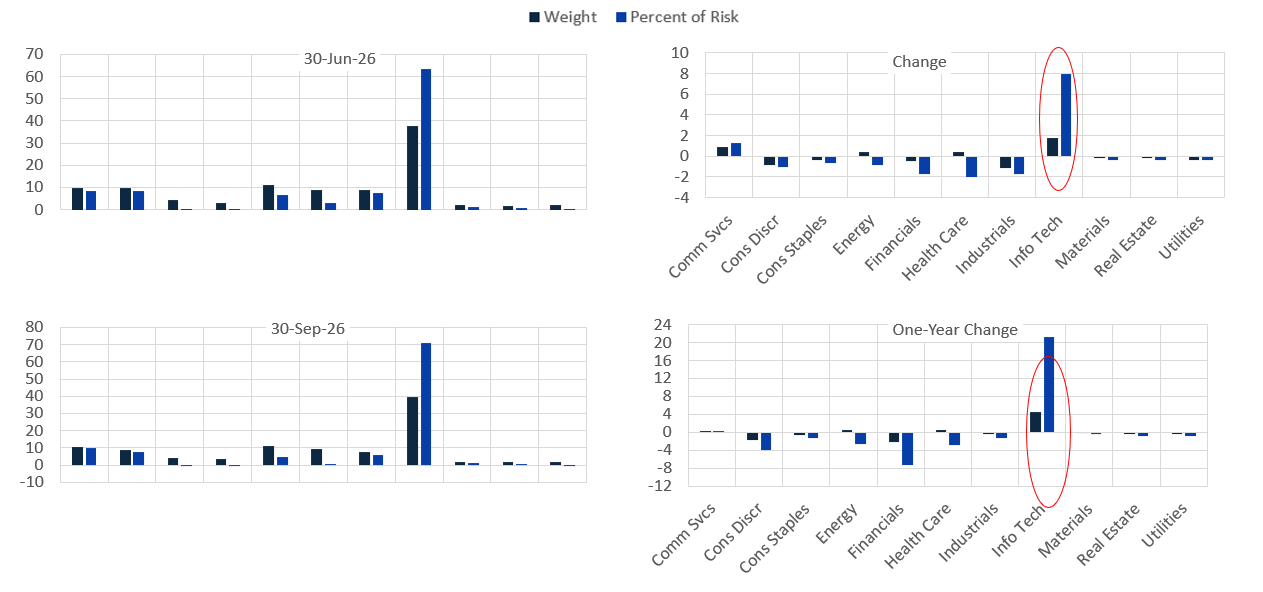
Lower correlations brought predicted risk down across regions in Q3. Under the surface, risk was climbing in Technology, and indices became even more concentrated. Specific risk accounts an unusually high share of index risk which is a potential positive for stock selection but a difficult backdrop for factor-based investors. Trading volume has fallen in most regions, with Japan the exception, which shows recent market performance was lacking strong underlying support. Of course, opportunities remain. After its sharp drawdown, Momentum has already started to recover.
Download the slide deck for the full set of detailed charts on regional risk, benchmark returns, correlations, sector concentration, specific risk, currency and style factor returns.
FAQs
FAQs
Why did equity risk fall in Q3 2026?
Predicted risk fell in every region we track, most by 20–30 percent proportionally, according to SimCorp's Q3 2026 Equities Review. Asset correlations fell in every region except China and are at or near eight-year lows globally, and these lower correlations, along with small declines in individual stock volatility, drove the decline in most regions we track closely.
FAQs
What is specific risk, and why did it matter in Q3 2026?
Specific risk is the part of risk that comes from individual companies rather than from common factors: the market, countries, currencies, industries and styles. According to SimCorp's analysis, its share of benchmark risk rose to an unusually high proportion in the US and EM, and a small sample of exchange-traded funds (ETFs) showed a similar pattern. While this newly high proportion of specific risk may help stock pickers, it may negatively impact factor-based investors.
FAQs
How did oil and interest rates show up in the data?
In Axioma's Macroeconomic Projection Model, the Oil factor's Q3 return was in the 98th percentile of its history, and its year-to-date return is more than two standard deviations above the long-term average (an unusually large move). Given the volatility in oil prices driven by the continued wars in the Middle East and Ukraine this is not surprising. As long rates rose globally, Term spread factor returns in the EU, UK and US were in the top quintile of history, as were EU and UK inflation returns. The inflation returns are based on breakeven inflation, not recently reported levels, and reflect investor views about longer-term inflation potential. The return to the US inflation factor was almost flat, as investors expect recent Fed action to meet its intended goal of lowering inflation.
FAQs
Which style factors performed well in Q3 2026?
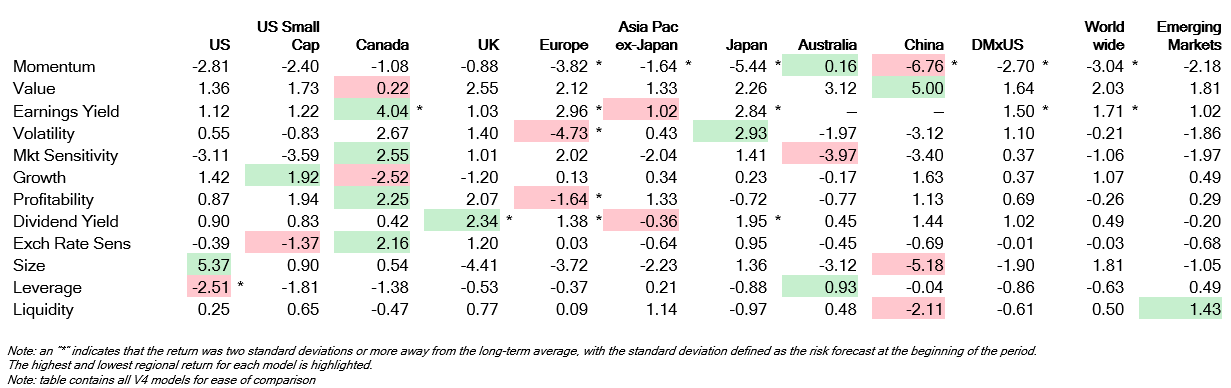
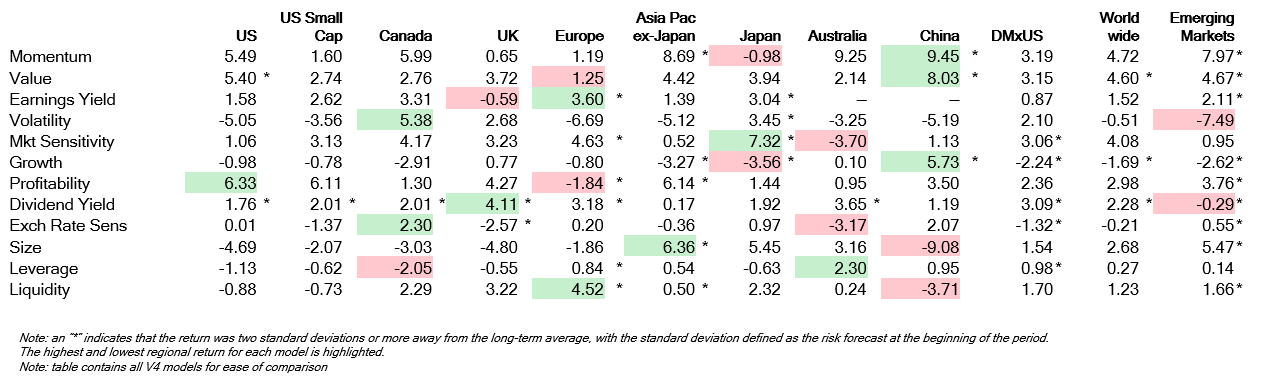
Value and Earnings Yield fared well, and Earnings Yield exceeded the two-standard-deviation threshold in several regions. Medium-Term Momentum fell more than two standard deviations below its long-term average in many regions, although it recovered in the US in September and remains strong year to date in Asia ex-Japan, China and EM. Many factors have seen year-to-date returns that are larger in magnitude than would have been expected given predicted risk at the beginning of the year, especially in Emerging Markets, Europe and Asia ex-Japan.
You may also like


