

EQUITY RISK MONITOR HIGHLIGHTS
WEEK ENDED SEPTEMBER 18, 2026
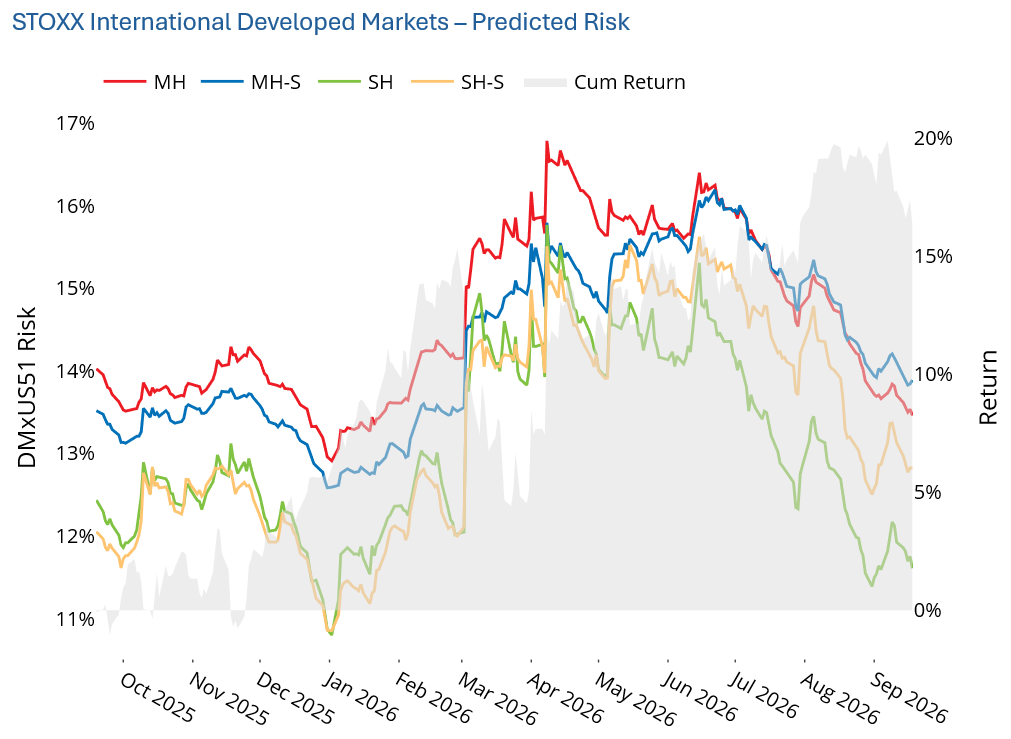
- Statistical model may be seeing risk not uncovered by fundamental
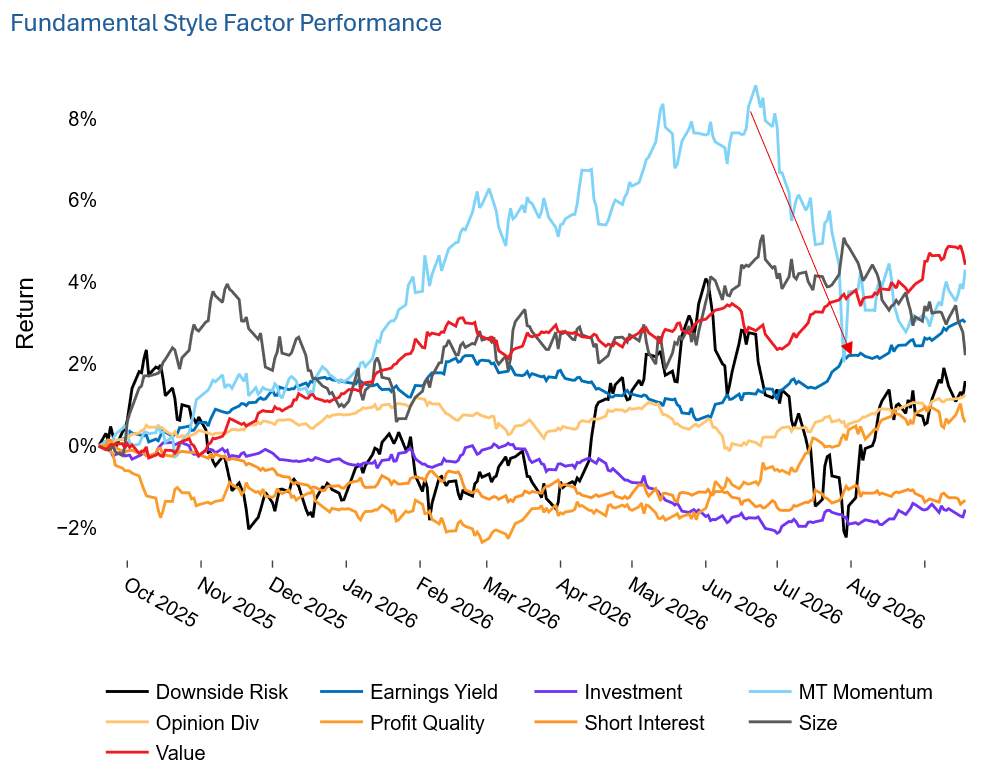
- Momentum investors beware (1): DMxUS 5.1 Medium-Term Momentum: large drawdown in Q3
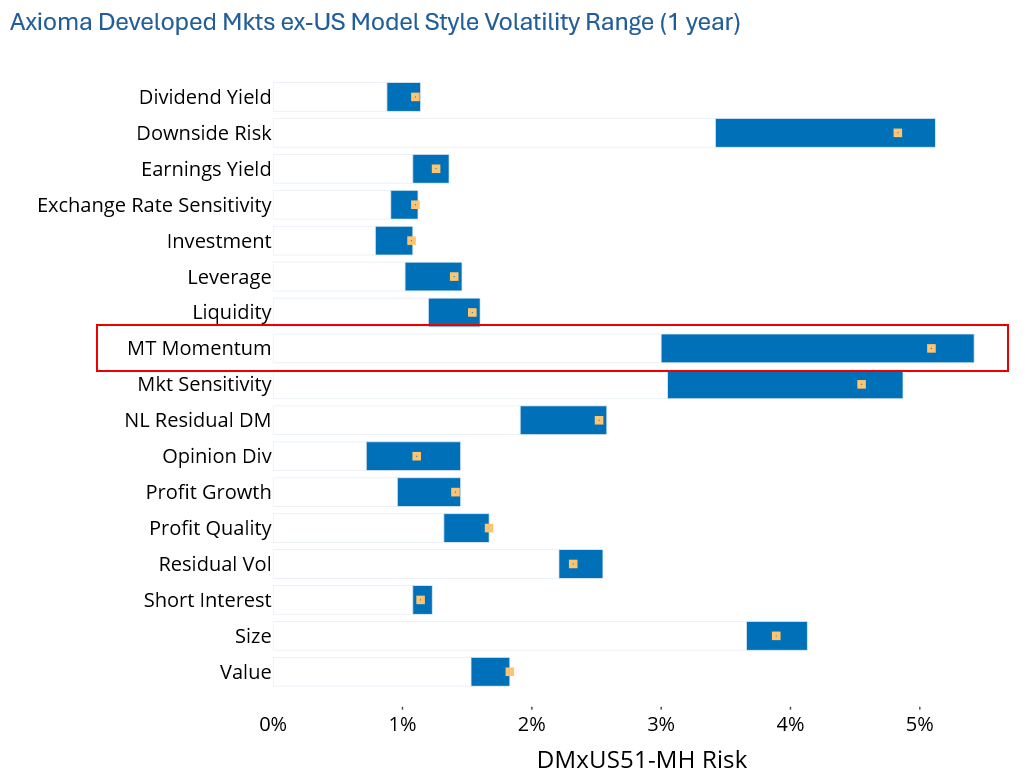
- Momentum investors beware (2): performance drawdown means factor volatility runup
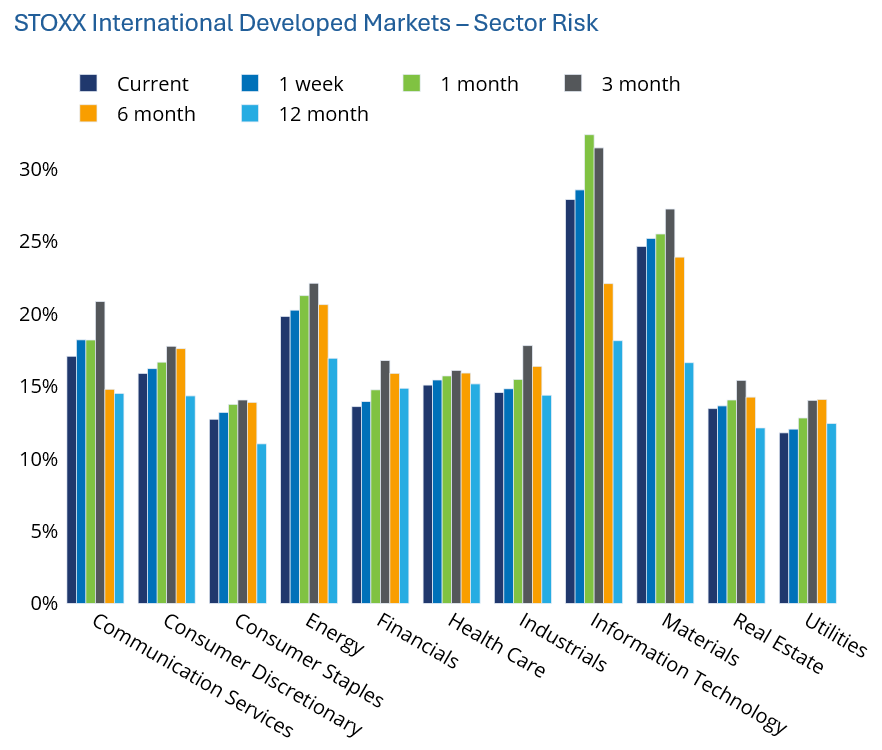
- Sector risk has ticked down recently, but Tech saw the biggest increase – and widened the spread - vs. a year ago
We are pleased to introduce the Equity Risk Monitor that accompanies our latest risk model release, Developed Markets ex-US 5.1. This model covers roughly 20,000 securities from 24 markets and incorporates enhancements introduced in our WW5.1 model. The upgrades include five new factors, three redefined factors, GICS 2023 industry factors, some methodology improvements and an improved currency model. See your SimCorp representative for more details.
In our new risk monitor the featured benchmark is the STOXX International Developed Markets Universal Index. For our highlights this week we will cover some of the output from this new monitor.
Statistical model may be seeing risk not uncovered by fundamental
Currently, statistical risk forecasts for the STOXX International Developed Markets Index are above their fundamental counterparts, most notably in the short-horizon variants. The statistical forecast is currently about 1.2 percentage points higher than that of the fundamental forecast, a difference of more than 10%. This difference has persisted for about five months, and suggests there may be an underlying risk not accounted for by fundamental characteristics. Over a longer-term period the statistical forecast averages about 40 (short horizon) to 60 (medium horizon) basis points lower than the fundamental, so this difference is even bigger than it seems.
Still, fundamental risk forecasts at both horizons are low – less than a percentage point off the year’s low, and in the bottom third of values historically. In contrast, the risk forecasted currently by the statistical models is well off the lows for the last 12 months and closer to longer-term median levels.
Our colleagues Leon Serfaty and Jordan Francis recently wrote about how the stat model may be seeing an AI factor here.
See chart from the DMxUS5 & STOXX International Developed Markets Equity Risk Monitor of September 18, 2026
DMxUS 5.1 Medium-Term Momentum: large drawdown in Q3
Last week we wrote about the drawdown in Medium-Term Momentum (hereafter just called Momentum) across regions, including that factor from the Developed Markets ex-US version 4 model. Momentum saw similar performance in the version 5 model, where it experienced a drawdown of 5.32% in the 20 days from July 6 to July 29 2026. This drawdown was among the worst we have seen in the history of the model, falling well into the bottom percentile of 20-day returns. The only times the factor performed even more poorly were at the burst of the internet bubble in 2000 and for the 20 days ending April 17, 2009, as the market was just starting to turn around from the impact of the Global Financial Crisis.
Momentum has started to recover, but still has a long way to go to get back to its recent high-water mark. Since that recent bottom the factor has returned 2.2%, with several disappointing days during the period, especially in early August when it retreated about 90 basis points. If the recovery doesn’t pick up, Q3 2026 could go down as one of the worst quarters the factor has ever seen.
See chart from the DMxUS5 & STOXX International Developed Markets Equity Risk Monitor of September 18, 2026
Momentum investors beware: performance drawdown means factor volatility runup
The July drawdown drove Momentum’s predicted volatility to its one-year high on July 29. That level of volatility was one of the highest in the history of the model. Momentum’s risk has retreated from that high, although it remains in the top 6% of readings – and higher than the volatility of any other style factor in the model.
Most factors are currently seeing risk at the high end of their 12-month ranges, but only Momentum’s is that high as compared to its full history.
See chart from the DMxUS5 & STOXX International Developed Markets Equity Risk Monitor of September 18, 2026
Sector risk has ticked down recently, but Tech saw the biggest increase – and widened the spread – vs. a year ago
Finally, a note on sector risk. Following the overall decline in benchmark risk, predicted sector risk for the sectors comprising the STOXX International Developed Markets Index has fallen versus one week, one month, and three months in every sector. The three-month change in benchmark risk was about -22% (11.9% currently vs. 14.9%), a bigger proportional change than in any individual sector, suggesting that sector correlations have fallen over this period. (See more about this on Diana Baechle’s LinkedIn post here.)
Conversely, risk is now higher than it was six and 12 months ago for most sectors. The 12-month change is positive everywhere except Financials, Utilities and (just barely) Health Care. Information Technology shows this most dramatically: its risk is down sharply from its one- and three-month levels but up +5.8 percentage points (26% proportionally) versus 6 months ago and +9.7 percentage points and almost 54% proportionally versus a year ago. The recent tick down pales in comparison to the substantial increase over longer periods. Materials shows a similar pattern (almost 50% higher than a year ago, but 10% lower versus a quarter ago).
Financials is the clear outlier in the other direction: it's lower than every single comparison column, including 12m ago (-1.27) — the only sector with a steady, sustained decline in risk across every horizon. Information Technology, Materials and Energy have steadily remained in the top three sectors based on risk, while Financials went from 5th place a year ago (where 1st is most risky) to 8th currently, the biggest move in relative rank among sectors.
Finally, the spread in sector risk has widened substantially compared with a year ago. Sector risk levels in September 2025 ranged from 11% (Consumer Staples) to 18.1% (Info Tech). Currently the range is more than twice as wide, going from a low of 11.8% (Utilities) to 27.9% (Info Tech). This suggests that, for sector investors, one needs more confidence in the sector return forecast to justify a higher active weight.
See chart from the DMxUS5 & STOXX International Developed Markets Equity Risk Monitor of September 18, 2026
You may also like


